


Total staff
143
Employees
74
Contractors
69
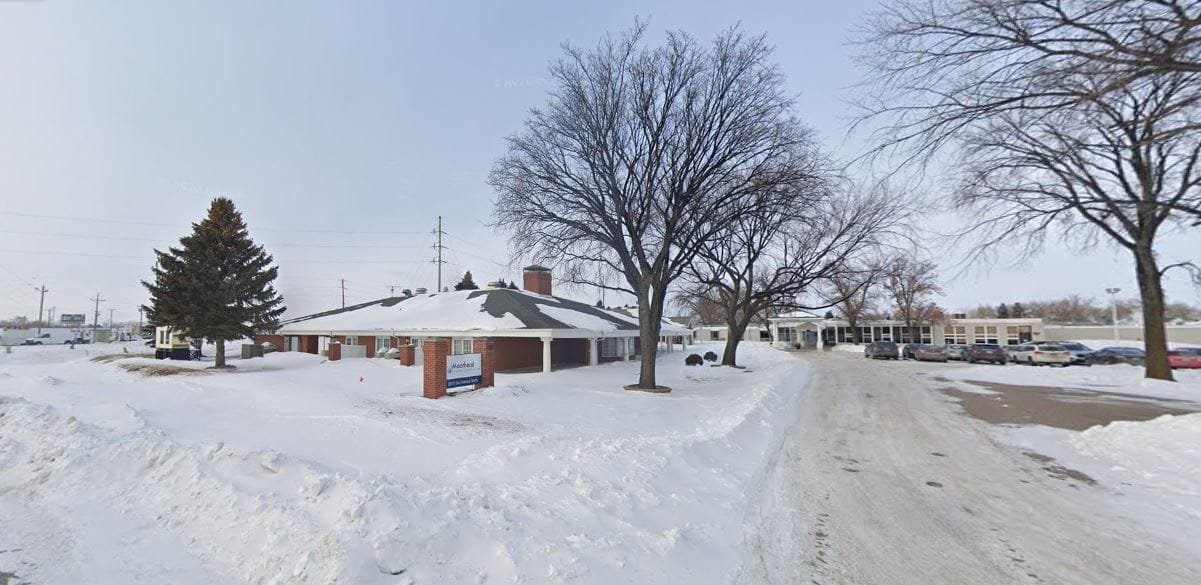
Owned by Jeffrey Muencz, Golden LivingCenter in Moorhead is a 42-bed nursing home on 2nd Avenue North in Moorhead, Minnesota. Families can choose from Medicare, Medicaid, and private pay to pay for care.
Residents stay an average of 195 days, including a mix of people recovering after illness or hospitalization and those receiving longer-term nursing care. Nurse staffing averages 4 hours and 5 minutes of care per resident each day. Residents are cared for by registered nurses, licensed practical nurses, and nurse aides who work together to provide the hands-on support residents need throughout the day.
The neighborhood has a Walk Score of 48, so a few nearby places are within walking distance, but most errands and visits are easier by car. The setting may appeal to families who prefer a quieter residential area and have reliable transportation.
| Staff type | Hours / Day / Resident | vs state avg |
|---|---|---|
|
Registered Nurse (RN)
| 1h 0m per day | ▲ 9% State avg: 56m per day · National avg: 41m per day |
|
LPN / LVN
| 27m per day | ▼ 13% State avg: 31m per day · National avg: 52m per day |
|
Nurse Aide
| 1h 50m per day | ▼ 39% State avg: 2h 58m per day · National avg: 2h 20m per day |
|
Weekend Total Nursing
| 3h 0m per day | ▼ 22% State avg: 3h 50m per day · National avg: 3h 27m per day |
|
Physical Therapist
| 6m per day | ▲ 122% State avg: 3m per day · National avg: 4m per day |
|
Weekend RN
| 44m per day | ▲ 25% State avg: 35m per day · National avg: 29m per day |
Reporting period: October 1 – December 31, 2025 (Q4 2025). Source: CMS Payroll-Based Journal report.
Manages medical care and health needs.
Assists with medical care and medications.
Helps with daily care and mobility.
Total hours from contractors
3,062 contractor hours this quarter
| Certified Nursing Assistant | 45 | 40 | 85 | 6,122 | 92 | 100% | 6.8 |
| Registered Nurse | 11 | 10 | 21 | 2,288 | 92 | 100% | 7.8 |
| Licensed Practical Nurse | 5 | 5 | 10 | 1,493 | 89 | 97% | 7.4 |
| Other Dietary Services Staff | 4 | 0 | 4 | 993 | 91 | 99% | 6.9 |
| Clinical Nurse Specialist | 4 | 0 | 4 | 734 | 69 | 75% | 8 |
| Dental Services Staff | 1 | 0 | 1 | 449 | 57 | 62% | 7.9 |
| Administrator | 1 | 0 | 1 | 443 | 59 | 64% | 7.5 |
| Physical Therapy Assistant | 0 | 5 | 5 | 410 | 65 | 71% | 5.9 |
| Nurse Practitioner | 1 | 0 | 1 | 356 | 46 | 50% | 7.7 |
| Respiratory Therapy Technician | 0 | 2 | 2 | 320 | 62 | 67% | 5.2 |
| Occupational Therapy Aide | 1 | 0 | 1 | 49 | 8 | 9% | 6.1 |
| Qualified Social Worker | 0 | 4 | 4 | 12 | 14 | 15% | 0.8 |
| Physical Therapy Aide | 0 | 1 | 1 | 12 | 3 | 3% | 4 |
| Medical Director | 0 | 1 | 1 | 6 | 3 | 3% | 2 |
| Occupational Therapy Assistant | 0 | 1 | 1 | 6 | 3 | 3% | 2 |
| RN Director of Nursing | 1 | 0 | 1 | 3 | 1 | 1% | 2.5 |
Federal penalties imposed by CMS for regulatory violations, including civil money penalties (fines) and denials of payment for new Medicare/Medicaid admissions.
Source: CMS Penalties Database
No penalties in the past 3 years
No civil money penalties or payment denials were reported in the last 3 years.
These measures show how residents usually do over time at this home, based on health outcomes and preventive care.
North Dakota average: 11.1
North Dakota average: 22.6
North Dakota average: 18.9%
North Dakota average: 23.8%
North Dakota average: 25.0%
North Dakota average: 3.7%
North Dakota average: 5.4%
North Dakota average: 2.7%
North Dakota average: 4.1%
North Dakota average: 4.4%
North Dakota average: 17.2%
North Dakota average: 97.3%
North Dakota average: 96.0%
North Dakota average: 88.9%
North Dakota average: 1.9%
North Dakota average: 82.6%
Quality measures are calculated from Minimum Data Set (MDS) assessments. For most measures, lower percentages indicate better care quality.
49% of new residents, usually for short-term rehab.
46% of new residents, often for short stays.
5% of new residents, often for long-term daily care.
Source: CMS Long-Term Care Facility Characteristics (Data as of Jan 2026)
Residents meet regularly to discuss policies, care quality, and activities
Organized group of residents that meets regularly to discuss facility policies, quality of life, and activities.
Data sourced from CMS Long-Term Care Facility Characteristics quarterly report. Payer mix reflects the current resident census by primary payment source.
Historical financial and operational data for Golden LivingCenter in Moorhead from 2012–2023, based on CMS SNF Cost Reports.
Key figures below are for fiscal year ending in 12/2023.
Based on CMS SNF Cost Report for fiscal year ending in 12/2023.
Most residents typically stay for a few weeks or months before returning home or moving on.
New residents most often arrive under Medicare (49% of admissions), and a typical Medicare stay runs around 1 - 2 months.
Coverage residents most often arrive under.
Coverage residents most often leave under.
![]() 1.6 miles from city center
1.6 miles from city center
![]() Estimated distance in miles from Moorhead's city center to Golden LivingCenter in Moorhead's address, calculated via Google Maps.
Estimated distance in miles from Moorhead's city center to Golden LivingCenter in Moorhead's address, calculated via Google Maps.
Add your location
Info below is compiled from CMS reports & the ND Dept. of Health & Human Services (NDHHS), senior community websites & trusted data sources such as Walk Score & BBB.
Communities are listed from highest to lowest based on our ranking methodology.
| Golden LivingCenter in Moorhead | AL NH | Moorhead | 42 | 86.7% | +19% | 4.09 | +4% | -14% | $0 | 4 | 2.0 | - | 36 | - | 48 | Jeffrey Muencz | $4.6MFiscal year ending 12/2023 | $2.6MFiscal year ending 12/2023 | 55.9%Fiscal year ending 12/2023 | 245345 | ||||
| Eventide Fargo | AL HOS IL MC NH RC SNF | Fargo (Brandt Crossing) | 98
Facility
98
ND AVG
75
Rank
#14 / 53 |
97.9%
Facility
97.9%
ND AVG
87.2
Rank
#2 / 12 | +12% | 4.94
Facility
4.94
ND AVG
5.16
Rank
#13 / 21 | -5% | -4% | $9.0k
Facility
$9.0k
ND AVG
$38.3k
Rank
#13 / 21 | 11
Facility
11
ND AVG
16.5
Rank
#7 / 21 | 2.2
Facility
2.2
ND AVG
3.9
Rank
#5 / 21 | 1 | 96 | - |
21
Facility
21
ND AVG
42
Rank
#60 / 80 | Christopher Gilson | $18.0MFiscal year ending 09/2023
Facility
$18.0MFiscal year ending 09/2023
ND AVG
$11.5M
Rank
#6 / 20 | $9.9MFiscal year ending 09/2023
Facility
$9.9MFiscal year ending 09/2023
ND AVG
$5.6M
Rank
#8 / 20 | 55.1%Fiscal year ending 09/2023
Facility
55.1%Fiscal year ending 09/2023
ND AVG
48.6%
Rank
#16 / 20 | 355127 | ||||
| Eventide Catered Living | AL HOS IL MC NH RC SNF | Moorhead | 145 | 76.7% | +5% | 5.00 | -59% | +5% | $46.0k | 28 | 2.3 | 4 | 111 | A+ | 44 | Jodee Bock | $25.3MFiscal year ending 09/2023 | $14.2MFiscal year ending 09/2023 | 56%Fiscal year ending 09/2023 | 245461 | ||||
| Fargo Elim Care Center | AL HOS IL NH RC SNF | Fargo (River Drive) | 95
Facility
95
ND AVG
75
Rank
#16 / 53 |
67.2%
Facility
67.2%
ND AVG
87.2
Rank
#11 / 12 | -23% | 3.63
Facility
3.63
ND AVG
5.16
Rank
#20 / 21 | +44% | -30% | $41.0k
Facility
$41.0k
ND AVG
$38.3k
Rank
#19 / 21 | 18
Facility
18
ND AVG
16.5
Rank
#15 / 21 | 4.5
Facility
4.5
ND AVG
3.9
Rank
#19 / 21 | 1 | 64 | - |
52
Facility
52
ND AVG
42
Rank
#31 / 80 | - | $7.2MFiscal year ending 12/2023
Facility
$7.2MFiscal year ending 12/2023
ND AVG
$11.5M
Rank
#16 / 20 | $5.0MFiscal year ending 12/2023
Facility
$5.0MFiscal year ending 12/2023
ND AVG
$5.6M
Rank
#15 / 20 | 69%Fiscal year ending 12/2023
Facility
69%Fiscal year ending 12/2023
ND AVG
48.6%
Rank
#1 / 20 | 355024 |
Golden LivingCenter in Moorhead is located in Moorhead, North Dakota.
Here are the financial assistance programs available to residents in North Dakota.
Golden LivingCenter in Moorhead is in the Moorhead neighborhood.
Golden LivingCenter in Moorhead has a walk score of 48. Somewhat walkable. A few nearby services may be reachable on foot, but most trips require transportation.
Golden LivingCenter in Moorhead's occupancy is 73.6%.
No, Golden LivingCenter in Moorhead has a no-pet policy.
Golden LivingCenter in Moorhead is registered as a for-profit.
Yes — there is 1 photo of Golden LivingCenter in Moorhead in the photo gallery on this page.
Golden LivingCenter in Moorhead is located at 2810 2Nd Ave N, Moorhead, MN 56560.
Care Cost Calculator: See Prices in Your Area
Nursing Home Data Explorer
Don’t Wait Too Long: 7 Red Flag Signs Your Parent Needs Assisted Living Now
The True Cost of Assisted Living in 2025 – And How Families Are Paying For It
Understanding Senior Living Costs: Pricing Models, Discounts & Financial Assistance


