Golden LivingCenter
Nursing Home · Merrilleville, IN
CMS overall rating Info The Overall CMS Rating is scored from 1 to 5 stars and combines results from health inspections, staffing levels, and quality measures. Health inspections carry the most weight. Staffing and quality scores can increase or decrease the final rating based on performance compared to state and national standards.

Golden LivingCenter

Nursing Home · Merrilleville, IN
CMS overall rating Info The Overall CMS Rating is scored from 1 to 5 stars and combines results from health inspections, staffing levels, and quality measures. Health inspections carry the most weight. Staffing and quality scores can increase or decrease the final rating based on performance compared to state and national standards.
Calculator: See prices in your area
Golden LivingCenter accepts Medicare, Medicaid, and private pay.

Overview of Golden Livingcenter

Golden Livingcenter, located in Merrillville, Indiana, is a vibrant and trusted community, renowned as a haven for seniors seeking nursing home care and specialized services. Situated amidst surrounding malls, restaurants, banks, parks, and local conveniences, this community provides a comprehensive range of services, including nursing care, hospice, palliative care, rehabilitation therapy, cardiac care, Alzheimer’s and dementia care, as well as pharmacy services. For those in need of dental, dialysis, podiatry, and other medical services, Golden Livingcenter offers a one-stop solution.
Beyond medical care, the community prioritizes the holistic well-being of residents by offering various avenues for enrichment. Recreational and social activities keep residents entertained, and amenities such as a fitness center and spiritual services contribute to a balanced lifestyle. Golden Livingcenter also acknowledges the importance of companionship by allowing pet visits. For individuals seeking nursing home care in Merrillville, this community stands out as a comprehensive option, providing homes with memory care and senior living services in a supportive and vibrant environment.

(219) 736-1310

Quality ratings

Measured by Centers for Medicare & Medicaid Services (CMS)

Overall rating Info The Overall CMS Rating combines results from health inspections, staffing levels and quality measures. Health inspections carry the most weight. Staffing and quality scores can increase or decrease the final rating based on performance compared to state and national standards.
▼ 66.8% Below IN avg. ▼ 66.8% Below IN avg.Click the badge to see the full State ranking.Click here to see the full State ranking.
Health Inspection Info Based on the results of the facility's three most recent standard inspections and any complaint investigations. CMS reviews the number, scope, and severity of deficiencies, with more recent findings weighted more heavily.
▼ 63.4% Below IN avg. ▼ 63.4% Below IN avg.Click the badge to see the full State ranking.Click here to see the full State ranking.
Staffing Info Measures average nursing staff hours per resident per day, including Registered Nurses (RNs) and total nursing staff. Ratings are adjusted based on the level of care residents require and are compared to state and national benchmarks.
▼ 21.6% Below IN avg. ▼ 21.6% Below IN avg.Click the badge to see the full State ranking.Click here to see the full State ranking.
Quality Measures Info Based on clinical and physical health indicators reported to CMS, such as hospital readmissions, falls, pressure ulcers, and improvements in mobility. These measures reflect how well residents' health needs are being managed.
▼ 25.9% Below IN avg. ▼ 25.9% Below IN avg.Click the badge to see the full State ranking.Click here to see the full State ranking.

Staffing hours breakdown

Info Daily nursing hours per resident by staff type, reported to CMS. Higher is generally better — compare this facility to state and national averages to see where staffing stands.

Hours per resident per day — compared to Indiana state averages

Total nursing care / resident Info This home is ranked 185th out of 287 homes in Indiana. Total adjusted nursing hours per resident per day, combining RN, LPN, and aide time. CMS adjusts this for case-mix so facilities can be fairly compared.
3h 6m per day
Rank #185 / 287Nurse hours — State benchmarkedThis home is ranked 185th out of 287 homes in Indiana. Shows adjusted nurse hours per resident per day benchmarked to the Indiana average, with a ranking across 287 Indiana SNFs. More hours mean more direct care. The national average is about 3.5 hrs; below 3.0 is a red flag.Click the rank badge to see the full State ranking.Click here to see the full State ranking.
This facility Indiana avg (3h 32m per day)
vs Indiana avg
-12%

6 of 6 metrics below state avg

Staff typeHours / Day / Residentvs state avg
Registered Nurse (RN) Info RNs hold the highest nursing license and can assess residents, interpret test results, and direct care plans. More RN hours per day often signals stronger clinical oversight and faster response to health changes. 36m per day ▼ 10% State avg: 40m per day · National avg: 41m per day
LPN / LVN Info Licensed Practical Nurses (LPNs) or Licensed Vocational Nurses (LVNs) deliver routine hands-on care — medication administration, wound dressing, and monitoring vital signs. They work under RN supervision and make up a large share of daily bedside care. 31m per day ▼ 33% State avg: 46m per day · National avg: 52m per day
Nurse Aide Info Certified Nurse Aides (CNAs) provide the most direct day-to-day assistance: bathing, dressing, feeding, and mobility. Nurse aide hours are typically the largest staffing category and directly affect residents' quality of life. 2h 12m per day ▼ 3% State avg: 2h 16m per day · National avg: 2h 21m per day
Weekend Total Nursing Info Combined nursing hours (RN + LPN + Nurse Aide) per resident per day on weekends. Staffing often drops on weekends — this figure reveals whether the facility maintains adequate coverage outside of weekday hours. 2h 55m per day ▼ 10% State avg: 3h 14m per day · National avg: 3h 26m per day
Physical Therapist Info Hours per resident per day provided by licensed Physical Therapists (PTs) or PT Assistants. PT services help residents recover mobility after injury or illness and are especially important for post-acute (short-stay) rehabilitation. 3m per day ▼ 25% State avg: 4m per day · National avg: 4m per day
Weekend RN Info Registered nurse hours specifically on weekends. Facilities sometimes reduce RN presence on Saturdays and Sundays — a low weekend RN figure compared to weekday hours can indicate reduced clinical oversight when most administrative staff are absent. 25m per day ▼ 7% State avg: 27m per day · National avg: 29m per day

Capacity and availability

This home usually has availability

Occupancy lower than 85% suggests more openings may be available.

Higher occupancy than the Indiana average: 69.4%
Occupancy rate 81.4% Rank #88 / 433Occupancy rate — State benchmarkedThis home is ranked 88th out of 433 homes in Indiana. Shows this facility's occupancy rate versus the Indiana average, with its Statewide rank out of 433. Higher occupancy signals strong local demand and financial stability.Click the rank badge to see the full State ranking.Click here to see the full State ranking.
Avg. Length of Stay 152 days
Occupancy rate
81.4% Rank #88 / 433Occupancy rate — State benchmarkedThis home is ranked 88th out of 433 homes in Indiana. Shows this facility's occupancy rate versus the Indiana average, with its Statewide rank out of 433. Higher occupancy signals strong local demand and financial stability.Click the rank badge to see the full State ranking.Click here to see the full State ranking.
Avg. Length of Stay
152 days
Years in operation
18 years in operation Rank #68 / 412Years in operation — State benchmarkedThis home is ranked 68th out of 412 homes in Indiana. Shows how long this facility has been in operation compared to other Indiana SNFs. Longer operating histories may benefit residents, families, and staff.Click the rank badge to see the full State ranking.Click here to see the full State ranking.
A longer operating history, which may indicate experience navigating regulations and delivering ongoing care.
Walk Score
Walk Score: 5 / 100 Rank #519 / 588Walk Score — State benchmarkedThis home is ranked 519th out of 588 homes in Indiana. Shows how walkable this facility's neighborhood is compared to the average Walk Score across Indiana SNFs. Higher scores benefit residents, families, and staff.Click the rank badge to see the full State ranking.Click here to see the full State ranking.
Car-dependent. Most errands require a car, with limited nearby walkable options.

Contact Golden LivingCenter

Inspection History

In Indiana, the Department of Health, Division of Long Term Care is the primary regulatory body that performs onsite inspections and quality of care reviews for all licensed facilities.

Read the full inspection reports for this facility, including detailed findings and corrective actions.

Show Inspection Reports

Health Inspection History

Inspections since 2023
Total health inspections 9

Indiana average 6


Last Health inspection on Aug 2025
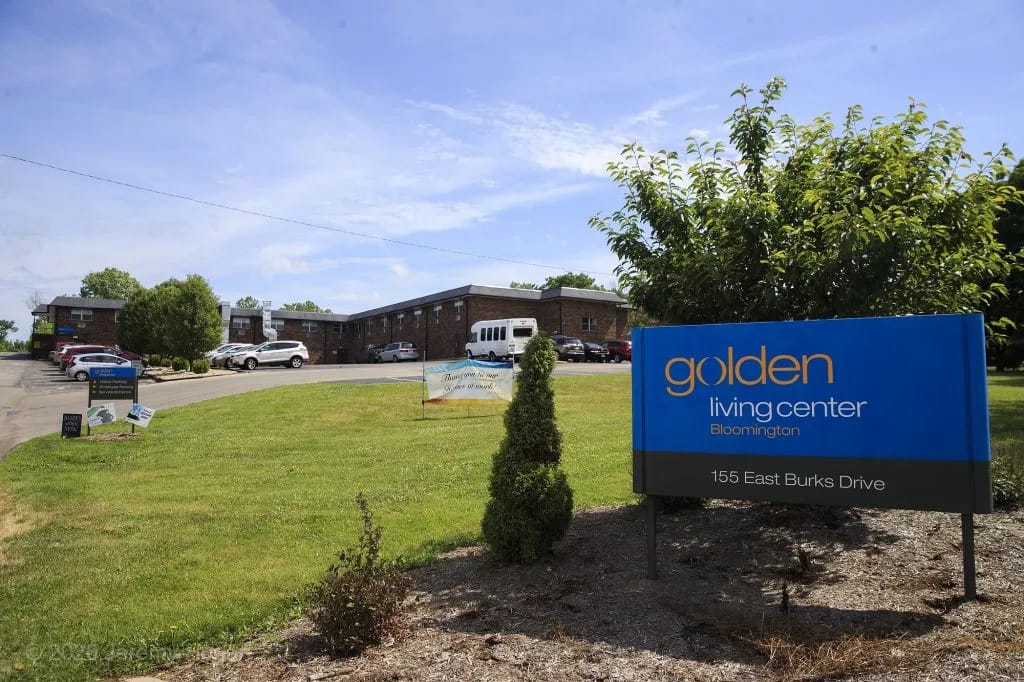
Total health citations
42 Rank #239 / 288Health citations — State benchmarkedThis home is ranked 239th out of 288 homes in Indiana. Shows this facility's total health deficiency citations benchmarked to the Indiana State average, with a ranking across all 288 IN SNFs. Lower citation counts earn a better rank.Click the rank badge to see the full State ranking.Click here to see the full State ranking.

Indiana average 25

Citations per inspection
4.67 Rank #194 / 288Citations per inspection — State benchmarkedThis home is ranked 194th out of 288 homes in Indiana. Shows average deficiency citations per CMS inspection for this facility versus the Indiana mean across 288 SNFs with citation data. Lower is better.Click the rank badge to see the full State ranking.Click here to see the full State ranking.

Indiana average 4.12


Health citations are formal notices following inspections when they fail to comply with safety and care standards.

27 of 42 citations resulted from standard inspections; and 15 of 42 resulted from complaint investigations.

Breakdown of citation severity (last 3 years)
Critical Health citations
0
100% better than Indiana average

Indiana average: 0.2


Serious Health citations
1 Rank #1 / 108Serious citations (G–I) — State benchmarkedThis home is ranked 1st out of 108 homes in Indiana. Shows G–I scope serious health citations for this facility versus other Indiana SNFs. Lower counts rank better.Click the rank badge to see the full State ranking.Click here to see the full State ranking.
67% worse than Indiana average

Indiana average: 0.6

0 critical citations Indiana average: 0.2

1 serious citation Indiana average: 0.6

41 moderate citations Indiana average: 23.8

0 minor citations Indiana average: 0.4
Citations history (last 3 years)
Abuse/Neglect moderate citation Aug 08, 2025
Corrected

Environmental moderate citation Aug 08, 2025
Corrected

Infection Control moderate citation Aug 08, 2025
Corrected

Nutrition moderate citation Aug 08, 2025
Corrected

Staffing Data

Reporting period: October 1 – December 31, 2025 (Q4 2025). Source: CMS Payroll-Based Journal report.

Total staff 163
Employees 137
Contractors 26
Staff to resident ratio 1.12:1
1116338% better than Indiana average
Indiana average ratio: 0.00:1 Indiana average ratio: 0.00:1See full Indiana ranking
Avg staff/day 68
Average shift 8.2 hours
6% better than Indiana average
Indiana average: 7.7 hours Indiana average shift: 7.7 hoursSee full Indiana ranking
Total staff hours (quarter) 51,493

Nursing staff breakdown

Q4 2025 · Oct 1 – Dec 31 More info This data comes from the CMS Payroll-Based Journal report covering October 1 – December 31, 2025.
Registered Nurse

Manages medical care and health needs.

RN Staff 15
Average shift length Info Average shift length. Calculated as total hours divided by days worked and average staff per day. 10 hours

No contractors work on this role.

Licensed Practical Nurse

Assists with medical care and medications.

LPN Staff 19
Average shift length Info Average shift length. Calculated as total hours divided by days worked and average staff per day. 9.1 hours

No contractors work on this role.

Certified Nursing Assistant

Helps with daily care and mobility.

CNA Staff 71
Average shift length Info Average shift length. Calculated as total hours divided by days worked and average staff per day. 8.1 hours

This role is partially covered by contractors.

Contractor staffing

Q4 2025 · Oct 1 – Dec 31 More info This data comes from the CMS Payroll-Based Journal report covering October 1 – December 31, 2025.

Total hours from contractors

8.9%

4,578 contractor hours this quarter

Physical Therapy Aide: 5 Clinical Nurse Specialist: 5 Qualified Social Worker: 4 Certified Nursing Assistant: 3 Respiratory Therapy Technician: 2 Physical Therapy Assistant: 2 Speech Language Pathologist: 1 Occupational Therapy Aide: 1 Dental Services Staff: 1 Medical Director: 1 Occupational Therapy Assistant: 1

Staff by category

Q4 2025 · Oct 1 – Dec 31 More info This data comes from the CMS Payroll-Based Journal report covering October 1 – December 31, 2025.
Certified Nursing Assistant6837123,53392100%8.1
Registered Nurse150156,19592100%10
Licensed Practical Nurse190195,78992100%9.1
Medication Aide/Technician110114,86392100%9.6
Other Dietary Services Staff5051,3058693%7.7
Clinical Nurse Specialist3581,2578592%7.1
RN Director of Nursing3031,2426571%7.9
Administrator2029686470%8
Mental Health Service Worker2029297076%7.6
Qualified Social Worker0449136773%7.4
Respiratory Therapy Technician0228688188%6.7
Physical Therapy Aide0557498087%5.8
Nurse Aide in Training4046985560%7.1
Physical Therapy Assistant0225026267%8.1
Dietitian1014325560%7.9
Nurse Practitioner1014005054%8
Speech Language Pathologist0113365661%6
Occupational Therapy Aide1121914145%3.5
Dental Services Staff2131842628%7.1
Medical Director011861314%6.6
Occupational Therapy Assistant0115478%7.7
71 Certified Nursing Assistant
% of Days 100%
15 Registered Nurse
% of Days 100%
19 Licensed Practical Nurse
% of Days 100%
11 Medication Aide/Technician
% of Days 100%
5 Other Dietary Services Staff
% of Days 93%
8 Clinical Nurse Specialist
% of Days 92%
3 RN Director of Nursing
% of Days 71%
2 Administrator
% of Days 70%
2 Mental Health Service Worker
% of Days 76%
4 Qualified Social Worker
% of Days 73%
2 Respiratory Therapy Technician
% of Days 88%
5 Physical Therapy Aide
% of Days 87%
4 Nurse Aide in Training
% of Days 60%
2 Physical Therapy Assistant
% of Days 67%
1 Dietitian
% of Days 60%
1 Nurse Practitioner
% of Days 54%
1 Speech Language Pathologist
% of Days 61%
2 Occupational Therapy Aide
% of Days 45%
3 Dental Services Staff
% of Days 28%
1 Medical Director
% of Days 14%
1 Occupational Therapy Assistant
% of Days 8%

Penalties and fines

Federal penalties imposed by CMS for regulatory violations, including civil money penalties (fines) and denials of payment for new Medicare/Medicaid admissions.

Source: CMS Penalties Database

No penalties in the past 3 years

No civil money penalties or payment denials were reported in the last 3 years.

Quality of care over time

These measures show how residents usually do over time at this home, based on health outcomes and preventive care.

High-risk clinical events score Info A composite score based on pressure ulcers, falls with injury, weight loss, walking ability decline, and activities of daily living decline. 8.2
In line with Indiana average

Indiana average: 8.0

Functional decline score Info A composite score based on activities of daily living decline, walking ability decline, and incontinence. 18.7
10% worse than Indiana average

Indiana average: 17.1

Long-stay resident measures
Significantly above average Info CMS star rating based on long-stay quality measure performance. 5 stars = significantly above average, 1 star = significantly below average.
Need for Help with Daily Activities Increased Info Percent of long-stay residents whose need for help with daily activities has increased 8.9%
27% better than Indiana average

Indiana average: 12.0%

Walking Ability Worsened Info Percent of long-stay residents whose ability to move independently worsened 14.7%
In line with Indiana average

Indiana average: 14.4%

Low Risk Residents with Bowel/Bladder Incontinence Info Percent of low risk long-stay residents who lose control of their bowels or bladder 32.7%
33% worse than Indiana average

Indiana average: 24.6%

Falls with Major Injury Info Percent of long-stay residents experiencing one or more falls with major injury 2.9%
26% better than Indiana average

Indiana average: 3.9%

High Risk Residents with Pressure Ulcers Info Percent of long-stay high risk residents with pressure ulcers 10.9%
149% worse than Indiana average

Indiana average: 4.4%

Urinary Tract Infection Info Percent of long-stay residents with a urinary tract infection 0.2%
83% better than Indiana average

Indiana average: 1.2%

Lost Too Much Weight Info Percent of long-stay residents who lose too much weight 3.9%
31% better than Indiana average

Indiana average: 5.7%

Depressive Symptoms Info Percent of long-stay residents who have depressive symptoms 30.3%
26% worse than Indiana average

Indiana average: 24.1%

Antipsychotic Use Info Percent of long-stay residents who received an antipsychotic medication 2.2%
82% better than Indiana average

Indiana average: 12.4%

Pneumococcal Vaccine Info Percent of long-stay residents assessed and appropriately given the pneumococcal vaccine 97.4%
In line with Indiana average

Indiana average: 93.7%

Influenza Vaccine Info Percent of long-stay residents assessed and appropriately given the seasonal influenza vaccine 80.9%
15% worse than Indiana average

Indiana average: 95.4%

Hospitalizations per 1,000 days Info Number of hospitalizations per 1,000 long-stay resident days. 2.03
27% worse than Indiana average

Indiana average: 1.60

ED visits per 1,000 days Info Number of outpatient emergency department visits per 1,000 long-stay resident days. 1.49
In line with Indiana average

Indiana average: 1.48

Short-stay resident measures
Significantly below average Info CMS star rating based on short-stay quality measure performance. 5 stars = much above average, 1 star = much below average.
Pneumococcal Vaccine Info Percent of short-stay residents assessed and appropriately given the pneumococcal vaccine 96.7%
18% better than Indiana average

Indiana average: 81.7%

Antipsychotic medication increase Info Percent of short-stay residents who newly received an antipsychotic medication 2.5%
83% worse than Indiana average

Indiana average: 1.4%

Influenza Vaccine Info Percent of short-stay residents assessed and appropriately given the seasonal influenza vaccine 95.4%
21% better than Indiana average

Indiana average: 79.0%

Re-hospitalized after SNF stay Info Percentage of short-stay residents who were re-hospitalized after their nursing home admission. 25.9%
16% worse than Indiana average

Indiana average: 22.4%

Emergency department visits Info Percentage of short-stay residents who had an outpatient emergency department visit. 13.5%
29% worse than Indiana average

Indiana average: 10.5%

Falls with major injury Info Percentage of SNF residents who experience falls with major injury during their stay. 0.0%
100% better than Indiana average

Indiana average: 0.8%

Ability to care for self at discharge Info Percentage of residents at or above expected ability to care for themselves at discharge. 61.4%
14% better than Indiana average

Indiana average: 53.7%

Successful return to home or community Info Rate of successful return to home or community from a skilled nursing facility. 33.3%
34% worse than Indiana average

Indiana average: 50.6%

Breakdown by payment type

Medicare

20% of new residents, usually for short-term rehab.

Typical stay 29 days

Private pay

47% of new residents, often for short stays.

Typical stay 2 - 3 months

Medicaid

32% of new residents, often for long-term daily care.

Typical stay 11 - 12 months

Facility Characteristics

Source: CMS Long-Term Care Facility Characteristics (Data as of Jan 2026)

Total residents 146
Medicare
5
3.4% of residents
Medicaid
97
66.4% of residents
Private pay or other
44
30.1% of residents

Finances and operations

Governmental community
Operated by county authorities.
Home revenue
$16.0M
Surplus of revenue
$1.9M
Governmental community Operated by county authorities.
Home revenue
$16.0M Rank #69 / 290Revenue — State benchmarkedThis home is ranked 69th out of 290 homes in Indiana. Shows this facility's annual revenue compared to the Indiana SNF average. Higher revenue generally means more resources for staffing and capital — read alongside Payroll %.Click the rank badge to see the full State ranking.Click here to see the full State ranking.
Surplus of revenue
$1.9M
Payroll costs Info The portion of the home's budget spent on staff, including nurses, caregivers, and other employees who support care and operations. Rank #38 / 290Payroll — State benchmarkedThis home is ranked 38th out of 290 homes in Indiana. Shows total annual staff payroll benchmarked to the Indiana average. Higher payroll investment relative to peers often signals better staffing and less reliance on cheaper contract labor.Click the rank badge to see the full State ranking.Click here to see the full State ranking.
$8.6M
53.9% of revenue Rank #93 / 290Payroll % — State benchmarkedThis home is ranked 93rd out of 290 homes in Indiana. Shows payroll as a percentage of revenue versus the Indiana average. Well-run Indiana SNFs typically land around 54–68% — the top third Statewide. Below 25% may signal understaffing or heavy agency use — read with Staffing ratings.Click the rank badge to see the full State ranking.Click here to see the full State ranking.
Other operating costs Info All remaining costs needed to run the home, such as food, utilities, building maintenance, supplies and administrative expenses.
$5.5M
Total costs $14.1M

Who this home usually serves

TYPE OF STAY

Mix of rehab and long-term care

This home supports both short-term rehab and long-term care, with residents staying for a wide range of durations.

Places of interest near Golden LivingCenter

Address 1.9 miles from city center Info Estimated distance in miles from Merrillville's city center to Golden LivingCenter's address, calculated via Google Maps. — 0.49 miles to nearest hospital (Methodist Hospitals Southlake Campus)

Calculate Travel Distance to Golden LivingCenter

Add your location

Address

Financial Assistance for
Nursing Home in Indiana

Golden LivingCenter is located in Merrillville, Indiana.
Here are the financial assistance programs available to residents in Indiana.

Get Financial aid guidance

Aged and Disabled Waiver

Indiana Medicaid A&D Waiver

Age 65+ or disabled
General Indiana resident, Medicaid-eligible, nursing home-level care need.
Income Limits (2025) ~$2,829/month 300% FBR, individual
Asset Limits $2,000 (individual), $3,000 (couple).
IN

Requires level-of-care determination.

Benefits
Personal care (5-7 hours/day) Respite (240 hours/year) Adult day care (~$60/day) Home health services

CHOICE Program

Indiana CHOICE

Age 60+
General Indiana resident, at risk of nursing home.
Income Limits ~$2,000/month varies
Asset Limits $10,000 individual
IN

Limited funding; regional variation.

Benefits
In-home care (3-5 hours/week) Respite (up to 10 days/year) Transportation (~5 trips/month)

Residential Care Assistance Program (RCAP)

Indiana Residential Care Assistance Program

Age 65+
General or blind, or disabled, Indiana resident, in approved facility, low-income or SSI recipient.
Income Limits (2025) ~$1,004/month including SSI
Asset Limits $2,000 (individual), $3,000 (couple).
IN

~50 facilities statewide; per diem rate set by FSSA.

Benefits
Room/board Laundry Minimal care coordination (~$20-$50/day subsidy)

Medicare Savings Program (MSP)

Indiana Medicare Savings Program

Age 65+ or disabled
General Indiana resident, Medicare Part A/B.
Income Limits (2025) ~$2,510/month (QMB), ~$3,380/month (SLMB), ~$3,598/month (QI)—individual.
Asset Limits $9,430 (individual), $14,130 (couple).
IN

Three tiers; no waitlist.

Benefits
Covers Part B premiums ($174.70/month) Deductibles ($240/year) Copays (~20%)

National Family Caregiver Support Program (NFCSP) Respite

Indiana NFCSP Respite Care

Age
General Caregivers of 60+ needing care or 55+ caregivers of others; Indiana resident; functional needs (2+ ADLs).
Income Limits (2025) Prioritizes ~$24,980/year (individual); no strict cap.
Asset Limits Not assessed; need-based.
IN

16 AAAs; prioritizes low-income, rural caregivers.

Benefits
Respite (4-6 hours/week or 5 days/year) Adult day care ($60/day) Caregiver training

VA Aid and Attendance (A&A) and Housebound Benefits

Indiana VA Aid and Attendance/Housebound

Age 65+ or disabled veteran/spouse
General Indiana resident, wartime service, need for ADL help (A&A) or homebound.
Income Limits (2025) Net income < ~$1,984/month (veteran with dependent, A&A); pension offsets income.
Asset Limits ~$155,356 net worth limit
IN

High veteran demand statewide.

Benefits
Cash (~$1,433-$2,642/month veteran, ~$951-$1,318 spouse) for care costs (e.g., in-home, assisted living)

Compare Nursing Home around Merrilleville

The information below is reported by the Indiana Department of Health, Division of Long Term Care.

2 facilities compared · CMS & IN Dept. of Health data

Filter by care type
Golden LivingCenter
NH

Nursing Home Licensed facility providing 24/7 skilled nursing care for residents with complex, ongoing medical needs. Staffed by RNs, LPNs, and CNAs. Inspected and star-rated annually by CMS. Accepts Medicare (short-term rehab) and Medicaid (long-term care).

AL

Assisted Living A licensed, long-term care setting for seniors or individuals with disabilities who need help with daily activities — like bathing, dressing, and medication management — but not 24-hour skilled nursing. Offers housing, meals, and around-the-clock support while aiming to maximize resident independence.

Merrillville164 81.4% +17%3.10 -6%-10%$0424.71143 5 Merrillville Operating LLC$16.0M$8.6M53.9%155362
Lincolnshire Health Care Center
NH

Nursing Home Licensed facility providing 24/7 skilled nursing care for residents with complex, ongoing medical needs. Staffed by RNs, LPNs, and CNAs. Inspected and star-rated annually by CMS. Accepts Medicare (short-term rehab) and Medicaid (long-term care).

AL

Assisted Living A licensed, long-term care setting for seniors or individuals with disabilities who need help with daily activities — like bathing, dressing, and medication management — but not 24-hour skilled nursing. Offers housing, meals, and around-the-clock support while aiming to maximize resident independence.

Merrillville100 73.0% +5%2.65 -29%-23%$3.4k515.1-75 33 Lincolnshire Health & Rehabilitation Center LLC$8.7M$4.2M48.9%155650

Frequently Asked Questions about Golden LivingCenter

Is Golden LivingCenter in a walkable area?

Golden LivingCenter has a walk score of 5. Car-dependent. Most errands require a car, with limited nearby walkable options.

What is the phone number of Golden LivingCenter?

(219) 736-1310 will put you in contact with the team at Golden LivingCenter.

Is Golden LivingCenter Medicare or Medicaid certified?

Yes — Golden LivingCenter is a CMS-certified provider of Medicare and Medicaid.

Guides for Better Senior Living

Care Cost Calculator: See Prices in Your Area

Nursing Home Data Explorer

Don’t Wait Too Long: 7 Red Flag Signs Your Parent Needs Assisted Living Now

The True Cost of Assisted Living in 2025 – And How Families Are Paying For It

Understanding Senior Living Costs: Pricing Models, Discounts & Financial Assistance

Explore Open Rooms
1 Contact details
2 What type of senior care service are you looking for?
3 What budget do you have in mind for senior care?
4 How soon do you need to find care?
5 Additional details

Thank you for your interest!

Our team will be in touch shortly to help with next steps.