Golden Oasis Senior Living II
Nursing Home, Assisted Living & Hospice Care · Catonsville, MD
CMS overall rating Info CMS (the Centers for Medicare & Medicaid Services) is the federal agency that rates nursing home quality. Its Overall Rating runs from 1 to 5 stars, combining health inspections, staffing, and quality measures, with inspections weighted most heavily.

Golden Oasis Senior Living II

Nursing Home, Assisted Living & Hospice Care · Catonsville, MD
CMS overall rating Info CMS (the Centers for Medicare & Medicaid Services) is the federal agency that rates nursing home quality. Its Overall Rating runs from 1 to 5 stars, combining health inspections, staffing, and quality measures, with inspections weighted most heavily.
Calculator: See prices in your area
Golden Oasis Senior Living II accepts Medicare, Medicaid, and private pay.

Overview of Golden Oasis Senior Living II

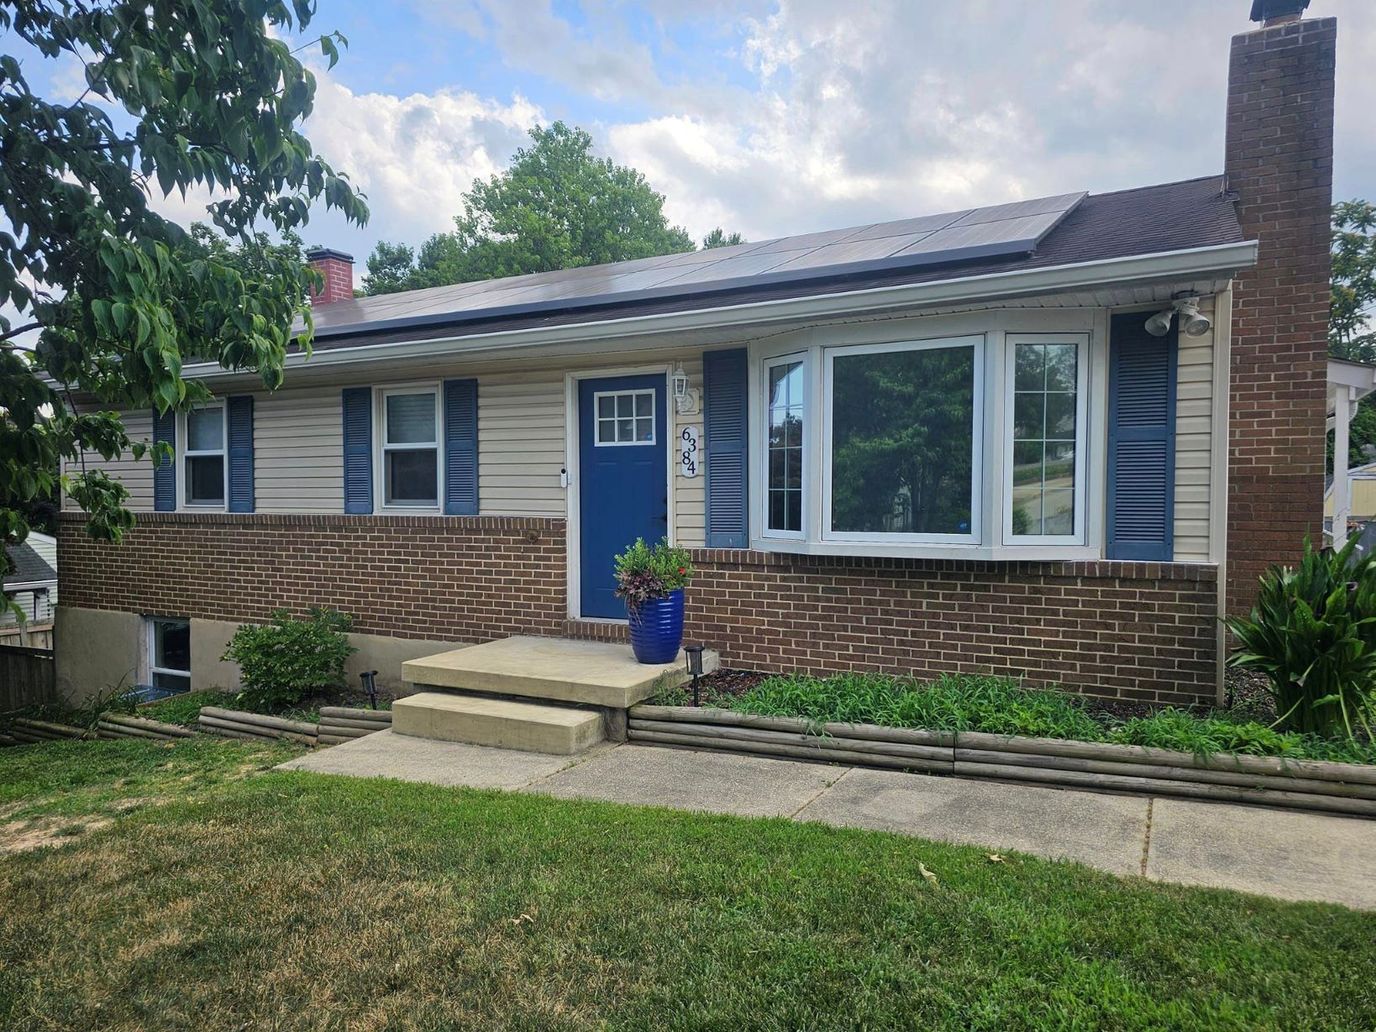
Golden Oasis SL II is an intimate senior living community in Elkridge, MD that offers compassionate assisted living services. Residents are welcomed into private or semi-private accommodations with housekeeping and laundry services included for a comfortable lifestyle. The community’s flexible care teams are on-site 24/7 alongside on-call doctors and registered nurses to make sure residents are provided with all-inclusive care.

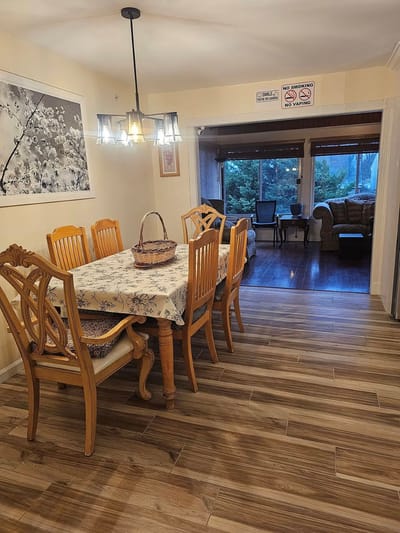
Residents delight in fun activities and delectable meals that are prepared to accommodate their unique tastes and needs. The community also offers physical and occupational therapy, podiatry services, and salon services to help residents maintain their wellness. With access to short-term care, long-term care, and hospice care, residents are sure to age gracefully within a friendly community.

(410) 379-1322

Quality ratings

Measured by Centers for Medicare & Medicaid Services (CMS)

Overall rating Info The Overall CMS Rating combines results from health inspections, staffing levels and quality measures. Health inspections carry the most weight. Staffing and quality scores can increase or decrease the final rating based on performance compared to state and national standards.
At MD avg. At MD avg.MD average: 3.0Click the badge to see the full State ranking.Click here to see the full State ranking.
Health Inspection Info Based on the results of the facility's three most recent standard inspections and any complaint investigations. CMS reviews the number, scope, and severity of deficiencies, with more recent findings weighted more heavily.
▲ 6.5% Above MD avg. ▲ 6.5% Above MD avg.MD average: 2.8Click the badge to see the full State ranking.Click here to see the full State ranking.
Staffing Info Measures average nursing staff hours per resident per day, including Registered Nurses (RNs) and total nursing staff. Ratings are adjusted based on the level of care residents require and are compared to state and national benchmarks.
At MD avg. At MD avg.MD average: 3.0Click the badge to see the full State ranking.Click here to see the full State ranking.
Quality Measures Info Based on clinical and physical health indicators reported to CMS, such as hospital readmissions, falls, pressure ulcers, and improvements in mobility. These measures reflect how well residents' health needs are being managed.
▼ 45.9% Below MD avg. ▼ 45.9% Below MD avg.MD average: 3.7Click the badge to see the full State ranking.Click here to see the full State ranking.

Staffing hours breakdown

Info Daily nursing hours per resident by staff type, reported to CMS. Higher is generally better — compare this facility to state and national averages to see where staffing stands.

Hours per resident per day — compared to Maryland state averages

Total nursing care / resident Info Total adjusted nursing hours per resident per day, combining RN, LPN, and aide time. CMS adjusts this for case-mix so facilities can be fairly compared.
4h 0m per day
This facility Maryland avg (3h 46m per day)
vs Maryland avg
+6%

1 of 6 metrics below state avg

Standout metric LPN / LVN is +18% above state avg
Staff typeHours / Day / Residentvs state avg
Registered Nurse (RN) Info RNs hold the highest nursing license and can assess residents, interpret test results, and direct care plans. More RN hours per day often signals stronger clinical oversight and faster response to health changes. 52m per day ▲ 5% State avg: 49m per day · National avg: 41m per day
LPN / LVN Info Licensed Practical Nurses (LPNs) or Licensed Vocational Nurses (LVNs) deliver routine hands-on care — medication administration, wound dressing, and monitoring vital signs. They work under RN supervision and make up a large share of daily bedside care. 1h 4m per day ▲ 18% State avg: 55m per day · National avg: 52m per day
Nurse Aide Info Certified Nurse Aides (CNAs) provide the most direct day-to-day assistance: bathing, dressing, feeding, and mobility. Nurse aide hours are typically the largest staffing category and directly affect residents' quality of life. 2h 9m per day ■ Avg State avg: 2h 8m per day · National avg: 2h 20m per day
Weekend Total Nursing Info Combined nursing hours (RN + LPN + Nurse Aide) per resident per day on weekends. Staffing often drops on weekends — this figure reveals whether the facility maintains adequate coverage outside of weekday hours. 3h 50m per day ▲ 9% State avg: 3h 31m per day · National avg: 3h 27m per day
Physical Therapist Info Hours per resident per day provided by licensed Physical Therapists (PTs) or PT Assistants. PT services help residents recover mobility after injury or illness and are especially important for post-acute (short-stay) rehabilitation. 6m per day ▼ 4% State avg: 6m per day · National avg: 4m per day
Weekend RN Info Registered nurse hours specifically on weekends. Facilities sometimes reduce RN presence on Saturdays and Sundays — a low weekend RN figure compared to weekday hours can indicate reduced clinical oversight when most administrative staff are absent. 39m per day ▲ 7% State avg: 37m per day · National avg: 29m per day

Capacity and availability

This home usually has availability

Lower occupancy than the Maryland average: 82.4%
Occupancy rate
68.3%
Avg. Length of Stay
68 days
Bed community size
70-bed community Rank #191 / 697Bed count — State benchmarkedThis home is ranked 191st out of 697 homes in Maryland. Shows this facility's certified or reported bed count compared to other Maryland facilities. Larger communities may offer more amenities, programs, and on-site services for residents and families.Rankings are based only on facilities in Maryland that report data for that category. Facilities without available data are excluded from the ranking.Click the rank badge to see the full State ranking.Click here to see the full State ranking.
A moderately sized community that may balance personal attention with shared amenities and social activities.
Walk Score
Walk Score: 12 / 100 Rank #802 / 985Walk Score — State benchmarkedThis home is ranked 802nd out of 985 homes in Maryland. Shows how walkable this facility's neighborhood is compared to the average Walk Score across Maryland facilities. Higher scores benefit residents, families, and staff.Rankings are based only on facilities in Maryland that report data for that category. Facilities without available data are excluded from the ranking.Click the rank badge to see the full State ranking.Click here to see the full State ranking.
Car-dependent. Most errands require a car, with limited nearby walkable options.

Contact Golden Oasis Senior Living II

Staffing Data

Reporting period: October 1 – December 31, 2025 (Q4 2025). Source: CMS Payroll-Based Journal report.

Total staff 199
Employees 96
Contractors 103
Staff to resident ratio 3.11 : 1
71% more staff per resident than Maryland average
Maryland average ratio: 1.81 : 1 Maryland average ratio: 1.81 : 1See full Maryland ranking
Avg staff/day 46
Average shift 7.5 hours
6% worse than Maryland average
Maryland average: 8 hours Maryland average shift: 8 hoursSee full Maryland ranking
Total staff hours (quarter) 31,694

Nursing staff breakdown

Q4 2025 · Oct 1 – Dec 31 More info This data comes from the CMS Payroll-Based Journal report covering October 1 – December 31, 2025.
Registered Nurse

Manages medical care and health needs.

RN Staff Info 25 total: 15 full-time employees and 10 contractors. 25
Average shift length Info Average shift length. Calculated as total hours divided by days worked and average staff per day. 8.8 hours
Licensed Practical Nurse

Assists with medical care and medications.

LPN Staff Info 23 total: 14 full-time employees and 9 contractors. 23
Average shift length Info Average shift length. Calculated as total hours divided by days worked and average staff per day. 8.8 hours
Certified Nursing Assistant

Helps with daily care and mobility.

CNA Staff Info 83 total: 33 full-time employees and 50 contractors. 83
Average shift length Info Average shift length. Calculated as total hours divided by days worked and average staff per day. 7.3 hours

Contractor staffing

Q4 2025 · Oct 1 – Dec 31 More info This data comes from the CMS Payroll-Based Journal report covering October 1 – December 31, 2025.

Total hours from contractors

19.8%

6,271 contractor hours this quarter

Certified Nursing Assistant: 50 Registered Nurse: 10 Licensed Practical Nurse: 9 Respiratory Therapy Technician: 9 Speech Language Pathologist: 6 Physical Therapy Aide: 6 Physical Therapy Assistant: 5 Qualified Social Worker: 5 Occupational Therapy Aide: 1 Medical Director: 1 Occupational Therapy Assistant: 1

Staff by category

Q4 2025 · Oct 1 – Dec 31 More info This data comes from the CMS Payroll-Based Journal report covering October 1 – December 31, 2025.
Certified Nursing Assistant33508311,86392100%7.3
Licensed Practical Nurse149235,12092100%8.8
Registered Nurse1510253,04392100%8.8
Other Dietary Services Staff9091,86092100%7.5
Clinical Nurse Specialist6061,56692100%7
RN Director of Nursing3031,2428491%8.8
Speech Language Pathologist0661,1577278%6.7
Nurse Aide in Training9098967885%7.6
Dietitian2028546773%7.4
Physical Therapy Assistant0556186672%7.3
Physical Therapy Aide0666077480%5.8
Respiratory Therapy Technician0995546975%6.2
Nurse Practitioner1014916267%7.9
Dental Services Staff1014446166%7.3
Mental Health Service Worker1014426065%7.4
Administrator1014355863%7.5
Qualified Social Worker0552984549%6.2
Occupational Therapy Aide1121602628%6.1
Medical Director011281718%1.6
Occupational Therapy Assistant0111833%6
83 Certified Nursing Assistant
% of Days 100%
23 Licensed Practical Nurse
% of Days 100%
25 Registered Nurse
% of Days 100%
9 Other Dietary Services Staff
% of Days 100%
6 Clinical Nurse Specialist
% of Days 100%
3 RN Director of Nursing
% of Days 91%
6 Speech Language Pathologist
% of Days 78%
9 Nurse Aide in Training
% of Days 85%
2 Dietitian
% of Days 73%
5 Physical Therapy Assistant
% of Days 72%
6 Physical Therapy Aide
% of Days 80%
9 Respiratory Therapy Technician
% of Days 75%
1 Nurse Practitioner
% of Days 67%
1 Dental Services Staff
% of Days 66%
1 Mental Health Service Worker
% of Days 65%
1 Administrator
% of Days 63%
5 Qualified Social Worker
% of Days 49%
2 Occupational Therapy Aide
% of Days 28%
1 Medical Director
% of Days 18%
1 Occupational Therapy Assistant
% of Days 3%

Penalties and fines

Federal penalties imposed by CMS for regulatory violations, including civil money penalties (fines) and denials of payment for new Medicare/Medicaid admissions.

Source: CMS Penalties Database

No penalties in the past 3 years

No civil money penalties or payment denials were reported in the last 3 years.

Quality of care over time

These measures show how residents usually do over time at this home, based on health outcomes and preventive care.

High-risk clinical events score Info A composite score based on pressure ulcers, falls with injury, weight loss, walking ability decline, and activities of daily living decline. 24.2
87% worse than Maryland average

Maryland average: 12.9

Functional decline score Info A composite score based on activities of daily living decline, walking ability decline, and incontinence. 42.8
67% worse than Maryland average

Maryland average: 25.7

Long-stay resident measures
Need for Help with Daily Activities Increased Info Percent of long-stay residents whose need for help with daily activities has increased 29.0%
22% worse than Maryland average

Maryland average: 23.7%

Walking Ability Worsened Info Percent of long-stay residents whose ability to move independently worsened 69.5%
151% worse than Maryland average

Maryland average: 27.7%

Low Risk Residents with Bowel/Bladder Incontinence Info Percent of low risk long-stay residents who lose control of their bowels or bladder 30.0%
16% worse than Maryland average

Maryland average: 25.9%

Falls with Major Injury Info Percent of long-stay residents experiencing one or more falls with major injury 5.9%
157% worse than Maryland average

Maryland average: 2.3%

High Risk Residents with Pressure Ulcers Info Percent of long-stay high risk residents with pressure ulcers 9.0%
38% worse than Maryland average

Maryland average: 6.5%

Urinary Tract Infection Info Percent of long-stay residents with a urinary tract infection 4.3%
168% worse than Maryland average

Maryland average: 1.6%

Lost Too Much Weight Info Percent of long-stay residents who lose too much weight 7.8%
34% worse than Maryland average

Maryland average: 5.8%

Depressive Symptoms Info Percent of long-stay residents who have depressive symptoms 0.7%
97% better than Maryland average

Maryland average: 20.2%

Antipsychotic Use Info Percent of long-stay residents who received an antipsychotic medication 13.8%
6% worse than Maryland average

Maryland average: 12.9%

Pneumococcal Vaccine Info Percent of long-stay residents assessed and appropriately given the pneumococcal vaccine 88.9%
In line with Maryland average

Maryland average: 92.0%

Influenza Vaccine Info Percent of long-stay residents assessed and appropriately given the seasonal influenza vaccine 93.2%
In line with Maryland average

Maryland average: 96.6%

Short-stay resident measures
Pneumococcal Vaccine Info Percent of short-stay residents assessed and appropriately given the pneumococcal vaccine 68.6%
13% worse than Maryland average

Maryland average: 78.4%

Antipsychotic medication increase Info Percent of short-stay residents who newly received an antipsychotic medication 0.5%
64% better than Maryland average

Maryland average: 1.4%

Influenza Vaccine Info Percent of short-stay residents assessed and appropriately given the seasonal influenza vaccine 56.6%
30% worse than Maryland average

Maryland average: 80.6%

Breakdown by payment type

Medicare

71% of new residents, usually for short-term rehab.

Typical stay 22 days

Private pay

22% of new residents, often for short stays.

Typical stay 5 months

Medicaid

7% of new residents, often for long-term daily care.

Typical stay 1 - 2 years

Facility Characteristics

Source: CMS Long-Term Care Facility Characteristics (Data as of Jan 2026)

Total residents 64
Medicare
21
32.8% of residents
Medicaid
27
42.2% of residents
Private pay or other
16
25% of residents
Programs & Services
Nurse Aide Training

State-approved Nurse Aide Training and Competency Evaluation Program on-site

Finances and operations

Based on CMS SNF Cost Report for fiscal year ending in 12/2023.

Voluntary non-profit community
Operated by a church.
Net patient revenue Info Net patient revenue — what the home actually collects for resident care, after contractual allowances, bad debt and discounts are subtracted from its gross charges (CMS cost report, Worksheet G-3). It covers resident care only; money the home earns from other sources is shown separately as "Other income."
$11.1M
Net patient income Info Net patient income: net patient revenue minus the home's total operating expenses. A positive figure means it earns more from resident care than it spends to deliver it; a negative figure means the opposite. It excludes non-operating "other income."
-$1.8M
Voluntary non-profit community Operated by a church.
Net patient revenue Info Net patient revenue — what the home actually collects for resident care, after contractual allowances, bad debt and discounts are subtracted from its gross charges (CMS cost report, Worksheet G-3). It covers resident care only; money the home earns from other sources is shown separately as "Other income."
$11.1M
Net patient income Info Net patient income: net patient revenue minus the home's total operating expenses. A positive figure means it earns more from resident care than it spends to deliver it; a negative figure means the opposite. It excludes non-operating "other income."
-$1.8M
Other income Info Money the home earns outside of resident care — such as investments, grants, rentals and other non-operating sources (CMS cost report, Worksheet G-3). It is tracked separately from net patient revenue: it is not part of that figure, and it is not included in net patient income.
$192.0K
Payroll costs Info Staff salaries plus wage-related costs — benefits such as payroll taxes, health insurance and retirement — from the home's own accounting records (CMS cost report, Worksheet A). Contract or agency labor is counted separately, under other operating costs.
$5.6M 50.4% of net patient revenue Info Payroll as a share of revenue: staff salaries and wage-related benefits divided by net patient revenue. A higher figure means more of each revenue dollar goes to staff pay. Rank #13 / 148Payroll % — State benchmarkedThis home is ranked 13th out of 148 homes in Maryland. Shows payroll as a percentage of revenue versus the Maryland average. Well-run Maryland facilities typically land around 49–57% — the top third Statewide. Below 25% may signal understaffing or heavy agency use — read with Staffing ratings.Rankings are based only on facilities in Maryland that report data for that category. Facilities without available data are excluded from the ranking.Click the rank badge to see the full State ranking.Click here to see the full State ranking.
Other operating costs Info Everything it costs to run the home apart from payroll — food, utilities, supplies, maintenance, contract labor and administration. Calculated as total operating expense minus payroll (staff salaries and wage-related benefits).
$7.3M
Total costs Info The home's total operating expense for the year — all the costs of running it, salaries included (CMS cost report, Worksheet G-3).
$12.9M

What does this home offer?

Housing options icon

Housing Options: Private / Semi-Private Rooms

Building type icon
Building type icon

Building Type: Single-story

Beauty services icon

Beauty Services

Transportation services icon

Transportation Services

Housekeeping icon
Housekeeping icon

Housekeeping Services

Recreational activities icon

Recreational Activities

Exercise program icon

Exercise Programs

Who this home usually serves

TYPE OF STAY

Mostly short-term rehab stays

Most residents typically stay for a few weeks or months before returning home or moving on.

Most new residents arrive under Medicare (71% of admissions), and a typical Medicare stay runs around 22 days.

Admissions
351 total

Coverage residents most often arrive under.

Medicare 71%
Private pay 22%
Medicaid 7%
Discharges
327 total

Coverage residents most often leave under.

Medicare 63%
Private pay 21%
Medicaid 16%

Places of interest near Golden Oasis Senior Living II

Address 1.3 miles from city center Info Estimated distance in miles from Elkridge's city center to Golden Oasis Senior Living II's address, calculated via Google Maps.

Calculate Travel Distance to Golden Oasis Senior Living II

Add your location

Address

Compare Nursing Homes around Catonsville

The information below is reported by the Maryland Department of Health, Office of Health Care Quality.

2 facilities compared · CMS & MD Dept. of Health data

The Waterfalls of Catonsville
NH
AL
MC
Catonsville (Colonial Gardens)
4
Facility 4
MD AVG 43
Rank #601 / 697
85.9% +4%3.10 -36%-18%$0
21
Facility 21
MD AVG 49.9
Rank #16 / 149
21.0-84-
56
Facility 56
MD AVG 43
Rank #357 / 985
-$13.6M$5.2M38.1%215107
Golden Oasis Senior Living II
NH
AL
HC
Elkridge (West Elkridge)
70
Facility 70
MD AVG 43
Rank #191 / 697
68.3% -17%4.00 -8%+6%$0
29
Facility 29
MD AVG 49.9
Rank #31 / 149
7.3165-
12
Facility 12
MD AVG 43
Rank #802 / 985
Nkhondo Nkunika$11.1M$5.6M
50.4%
Facility 50.4%
MD AVG 38.5%
Rank #13 / 148
215357

Frequently Asked Questions about Golden Oasis Senior Living II

What neighborhood is Golden Oasis Senior Living II in?

Golden Oasis Senior Living II is in the West Elkridge neighborhood of Elkridge.

Is Golden Oasis Senior Living II in a walkable area?

Golden Oasis Senior Living II has a walk score of 12. Car-dependent. Most errands require a car, with limited nearby walkable options.

What is the occupancy rate at Golden Oasis Senior Living II?

Golden Oasis Senior Living II's occupancy is 68.3%.

Are there photos of Golden Oasis Senior Living II?

Yes — there are 4 photos of Golden Oasis Senior Living II in the photo gallery on this page.

What is the address of Golden Oasis Senior Living II?

Golden Oasis Senior Living II is located at 6384, Elkridge, MD 21075.

What is the phone number of Golden Oasis Senior Living II?

(410) 379-1322 will put you in contact with the team at Golden Oasis Senior Living II.

Is Golden Oasis Senior Living II Medicare or Medicaid certified?

Yes — Golden Oasis Senior Living II is a CMS-certified provider of Medicare and Medicaid.

Guides for Better Senior Living

Care Cost Calculator: See Prices in Your Area

Nursing Home Data Explorer

Don’t Wait Too Long: 7 Red Flag Signs Your Parent Needs Assisted Living Now

The True Cost of Assisted Living in 2025 – And How Families Are Paying For It

Understanding Senior Living Costs: Pricing Models, Discounts & Financial Assistance