Good Samaritan Home
Nursing Home, Assisted Living, Independent Living & Memory Care · Quincy, IL
CMS overall rating Info The Overall CMS Rating is scored from 1 to 5 stars and combines results from health inspections, staffing levels, and quality measures. Health inspections carry the most weight. Staffing and quality scores can increase or decrease the final rating based on performance compared to state and national standards.

Good Samaritan Home

Nursing Home, Assisted Living, Independent Living & Memory Care · Quincy, IL
CMS overall rating Info The Overall CMS Rating is scored from 1 to 5 stars and combines results from health inspections, staffing levels, and quality measures. Health inspections carry the most weight. Staffing and quality scores can increase or decrease the final rating based on performance compared to state and national standards.
Calculator: See prices in your area
Good Samaritan Home accepts Medicare, Medicaid, and private pay.

Overview of Good Samaritan Home

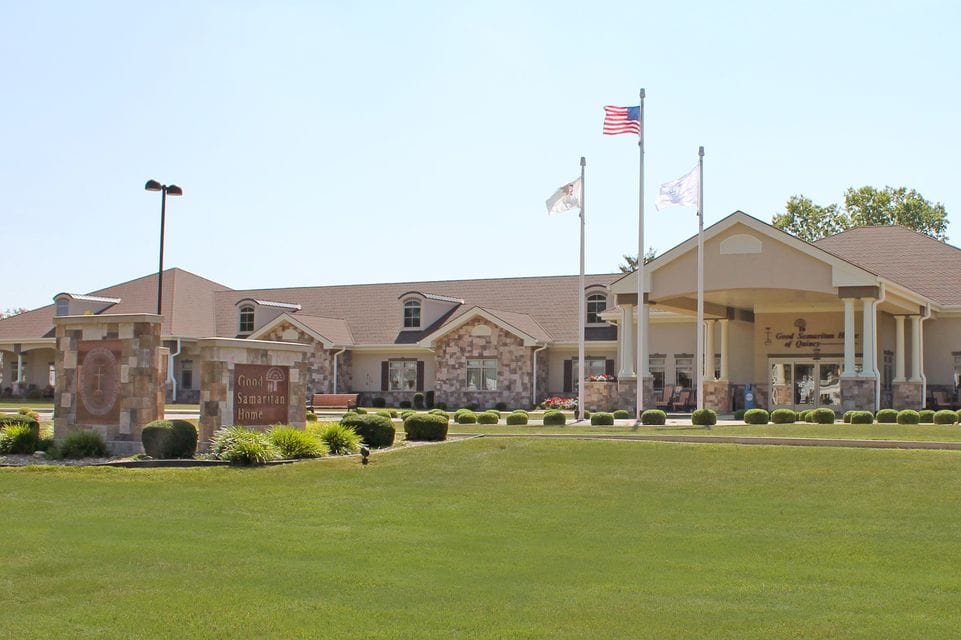
Good Samaritan Home is a nursing home in Quincy, IL, offering independent living, assisted living, memory care, rehabilitation, and skilled nursing. The community also ensures older adults feel at home in a compassionate and supportive environment. With 24-hour care, three well-balanced meals, housekeeping, and laundry, residents can maintain their independence with ease. Personalized care plans are also provided to meet residents’ unique needs and preferences, ensuring their recovery.

Cooking classes, outings, and entertainment programs provide residents with more opportunities to learn new hobbies and gain fun experiences. With an old-time general store and a beauty and barber shop, residents have more spaces for interactions and wellness. Set in the quiet neighborhood of Quincy, near bus stops, the community guarantees accessibility and a stress-free retirement. This nursing home is one of the trusted options for senior living in Illinois, especially with its comprehensive care options.

Quality ratings

Measured by Centers for Medicare & Medicaid Services (CMS)

Overall rating Info The Overall CMS Rating combines results from health inspections, staffing levels and quality measures. Health inspections carry the most weight. Staffing and quality scores can increase or decrease the final rating based on performance compared to state and national standards.
▲ 98.4% Above IL avg.
Health Inspection Info Based on the results of the facility's three most recent standard inspections and any complaint investigations. CMS reviews the number, scope, and severity of deficiencies, with more recent findings weighted more heavily.
▲ 44.1% Above IL avg.
Staffing Info Measures average nursing staff hours per resident per day, including Registered Nurses (RNs) and total nursing staff. Ratings are adjusted based on the level of care residents require and are compared to state and national benchmarks.
▲ 133.9% Above IL avg.
Quality Measures Info Based on clinical and physical health indicators reported to CMS, such as hospital readmissions, falls, pressure ulcers, and improvements in mobility. These measures reflect how well residents' health needs are being managed.
▼ 29.0% Below IL avg.

Staffing hours breakdown

Info Daily nursing hours per resident by staff type, reported to CMS. Higher is generally better — compare this facility to state and national averages to see where staffing stands.

Hours per resident per day — compared to Illinois state averages

Total nursing care / resident Info This home is ranked 10th out of 129 homes in Illinois.

Total adjusted nursing hours per resident per day, combining RN, LPN, and aide time. CMS adjusts this for case-mix so facilities can be fairly compared.
5h 20m per day
Rank #10 / 129Nurse hours — state benchmarkedThis home is ranked 10th out of 129 homes in Illinois.Shows adjusted nurse hours per resident per day benchmarked to the Illinois average, with a ranking across 129 Illinois SNFs. More hours mean more direct care. The national average is about 3.5 hrs; below 3.0 is a red flag.
This facility Illinois avg (3h 6m per day)
vs Illinois avg
+72%
Staff typeHours / dayvs state avg
Total Nursing (Weekend) Info Combined nursing hours (RN + LPN + Nurse Aide) per resident per day on weekends. Staffing often drops on weekends — this figure reveals whether the facility maintains adequate coverage outside of weekday hours. 4h 16m per day

Capacity and availability

This home usually has availability

Occupancy lower than 85% suggests more openings may be available.

Lower occupancy than the Illinois average: 69.3%
Occupancy rate 46.8% Rank #117 / 129Occupancy rate — state benchmarkedThis home is ranked 117th out of 129 homes in Illinois.Shows this facility's occupancy rate versus the Illinois average, with its statewide rank out of 129. Higher occupancy signals strong local demand and financial stability.
Avg. Length of Stay 41 days
Occupancy rate
46.8% Rank #117 / 129Occupancy rate — state benchmarkedThis home is ranked 117th out of 129 homes in Illinois.Shows this facility's occupancy rate versus the Illinois average, with its statewide rank out of 129. Higher occupancy signals strong local demand and financial stability.
Avg. Length of Stay
41 days

Who this home usually serves

TYPE OF STAY

Mix of rehab and long-term care

This home supports both short-term rehab and long-term care, with residents staying for a wide range of durations.

Breakdown by payment type

Medicare

39% of new residents, usually for short-term rehab.

Typical stay 28 days

Private pay

55% of new residents, often for short stays.

Typical stay 8 months

Medicaid

6% of new residents, often for long-term daily care.

Typical stay 4 years

Finances and operations

Voluntary non-profit community
Operated by a church.
Home revenue
$18.6M
Operating deficit
-$2.3M
Voluntary non-profit community Operated by a church.
Home revenue
$18.6M Rank #82 / 127Revenue — state benchmarkedThis home is ranked 82nd out of 127 homes in Illinois.Shows this facility's annual revenue compared to the Illinois SNF average. Higher revenue generally means more resources for staffing and capital — read alongside Payroll %.
Operating deficit
-$2.3M
Payroll costs Info The portion of the home's budget spent on staff, including nurses, caregivers, and other employees who support care and operations. Rank #14 / 127Payroll — state benchmarkedThis home is ranked 14th out of 127 homes in Illinois.Shows total annual staff payroll benchmarked to the Illinois average. Higher payroll investment relative to peers often signals better staffing and less reliance on cheaper contract labor.
$13.7M
73.6% of revenue Rank #7 / 127Payroll % — state benchmarkedThis home is ranked 7th out of 127 homes in Illinois.Shows payroll as a percentage of revenue versus the Illinois average. Well-run SNFs often land around 55–65%. Below 25% may signal understaffing or heavy agency use — read with Staffing ratings.
Other operating costs Info All remaining costs needed to run the home, such as food, utilities, building maintenance, supplies and administrative expenses.
$7.2M
Total costs $20.9M
Walk Score
Walk Score: 16 / 100 Rank #118 / 130Walk Score — state benchmarkedThis home is ranked 118th out of 130 homes in Illinois.Shows how walkable this facility's neighborhood is compared to the average Walk Score across Illinois SNFs. Higher scores benefit residents, families, and staff.
Car-dependent. Most errands require a car, with limited nearby walkable options.

What does this home offer?

Building type icon
Building type icon

Building Type: Single-story

On-site medical care and health services icon

On-site Medical Care and Health Services

Rehabilitative support icon

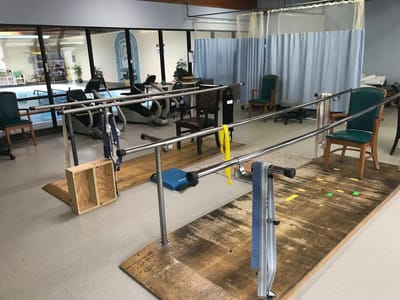
Rehabilitative Support

Beauty services icon

Beauty Services

Dining services icon

Dining Services

Exercise program icon

Exercise Programs

Housekeeping icon
Housekeeping icon

Housekeeping Services

Social and recreational activities icon

Social and Recreational Activities
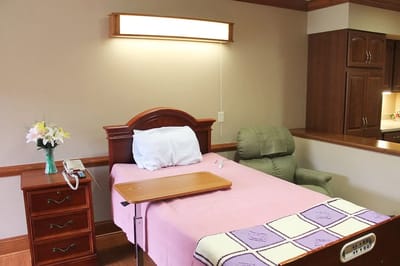
Types of Care at Good Samaritan Home

Nursing Home Assisted Living Independent Living Memory Care

Contact Good Samaritan Home

Health Inspection History

Inspections
Total health inspections 7

Illinois average 10.4


Last Health inspection on Sep 2025

Total health citations
16 Rank #21 / 128Health citations — state benchmarkedThis home is ranked 21st out of 128 homes in Illinois.Shows this facility's total health deficiency citations benchmarked to the Illinois state average, with a ranking across all 128 IL SNFs. Lower citation counts earn a better rank.

Illinois average 36.8

Citations per inspection
2.29 Rank #11 / 128Citations per inspection — state benchmarkedThis home is ranked 11th out of 128 homes in Illinois.Shows average deficiency citations per CMS inspection for this facility versus the Illinois mean across 128 SNFs with citation data. Lower is better.

Illinois average 3.68


Health citations are formal notices following inspections when they fail to comply with safety and care standards.

10 of 16 citations resulted from standard inspections; and 6 of 16 resulted from complaint investigations.

Breakdown of citation severity (last 4 years)
Critical Health citations More info
2
186% worse than Illinois average

Illinois average: 0.7


Serious Health citations More info 1
72% better than Illinois average

Illinois average: 3.6

2 critical citations More info Illinois average: 0.7

1 serious citation More info Illinois average: 3.6

13 moderate citations More info Illinois average: 32

0 minor citations More info Illinois average: 0.5
Citations history (last 4 years)
Resident Rights serious citation Info Issues related to resident's rights, including dignity, privacy, and the ability to make decisions about their care. Sep 19, 2025
Corrected

Infection Control moderate citation Info Issues related to preventing and controlling infections, including hygiene practices and safety protocols. Jul 17, 2025
Corrected

Resident Rights moderate citation Info Issues related to resident's rights, including dignity, privacy, and the ability to make decisions about their care. Oct 27, 2024
Corrected

Resident Rights moderate citation Info Issues related to resident's rights, including dignity, privacy, and the ability to make decisions about their care. Oct 27, 2024
Corrected

Financial Assistance for
Nursing Home in Illinois

Good Samaritan Home is located in Quincy, Illinois.
Here are the financial assistance programs available to residents in Illinois.

Get Financial aid guidance

Community Care Program

Illinois CCP

Age 60+
General Illinois resident, at risk of nursing home placement.
Income Limits (2025) ~$1,215/month individual
Asset Limits $17,500 individual, excludes home, car
IL

High demand in urban areas; waitlists possible.

Benefits
In-home care (3-5 hours/day) Adult day services ($65/day) Emergency home response systems ($30/month)

Illinois Respite Program

IL Respite (via NFCSP)

Age Caregiver of someone 60+ (or with dementia)
General Illinois resident.
Income Limits No strict limit; prioritizes low-income.
Asset Limits Not applicable.
IL

Limited slots; urban/rural balance.

Benefits
In-home respite (4-6 hours/day) Adult day care (~$65/day) Short-term facility care (up to 5 days)

Supportive Living Program (SLP)

Illinois Medicaid Supportive Living Program

Age 65+ or 22-64 with disability
General Illinois resident, Medicaid-eligible, needs moderate assistance (not nursing home-level).
Income Limits (2025) ~$2,829/month (300% FBR, individual); QIT allowed.
Asset Limits $2,000 (individual), $3,000 (couple) (excludes home, car).
IL

~200 SLP sites statewide; room/board not covered.

Benefits
Personal care (5-7 hours/day, e.g., bathing, mobility) Meals Housekeeping Medication management Respite (~240 hours/year)

Persons Who Are Elderly Waiver

Illinois Medicaid Elderly Waiver

Age 65+
General Illinois resident, Medicaid-eligible, nursing home-level care need.
Income Limits (2025) ~$2,829/month 300% FBR, individual
Asset Limits $2,000 (individual), $3,000 (couple).
IL

Part of HealthChoice Illinois; consumer-directed options available.

Benefits
Personal care (5-7 hours/day, e.g., dressing, eating) Homemaker Adult day care (~$60/day) Respite (240 hours/year) Home mods ($1,000 avg.)

Medicare Savings Program (MSP)

Illinois Medicare Savings Program

Age 65+ or disabled
General Illinois resident, Medicare Part A/B.
Income Limits (2025) ~$2,510/month (QMB), ~$3,380/month (SLMB), ~$3,598/month (QI)—individual.
Asset Limits $9,430 (individual), $14,130 (couple).
IL

Three tiers; no waitlist.

Benefits
Covers Part B premiums ($174.70/month) Deductibles ($240/year) Copays (~20%)

Optional State Supplementation (OSS)

Illinois Optional State Supplementation

Age 65+ or disabled
General Illinois resident, in approved facility, SSI recipient or low-income.
Income Limits (2025) ~$1,004/month including SSI
Asset Limits $2,000 (individual), $3,000 (couple).
IL

~$50-$500/month based on facility type.

Benefits
Cash (~$50-$500/month) for room/board in personal care homes or SLFs

VA Aid and Attendance (A&A) and Housebound Benefits

Illinois VA Aid and Attendance/Housebound

Age 65+ or disabled veteran/spouse
General Illinois resident, wartime service, need for ADL help (A&A) or homebound.
Income Limits (2025) Net income < ~$1,984/month (veteran with dependent, A&A); pension offsets income.
Asset Limits ~$155,356 net worth limit
IL

High veteran demand in urban/rural areas.

Benefits
Cash (~$1,433-$2,642/month veteran, ~$951-$1,318 spouse) for care costs (e.g., in-home, assisted living)

Places of interest near Good Samaritan Home

Address 3.2 miles from city center Info Estimated distance in miles from Quincy's city center to Good Samaritan Home's address, calculated via Google Maps.

Calculate Travel Distance to Good Samaritan Home

Add your location

Address

Staffing Data (Q2 2025)

This data corresponds to Q2 2025 and is based on CMS Payroll-Based Journal.

Total staff 191
Employees 160
Contractors 31
Staff to resident ratio 1.89:1
0% compared with Illinois average

Illinois average ratio: 1.90:1

Avg staff/day 75
Average shift 7.8 hours
0% compared with Illinois average

Illinois average: 7.6 hours

Total staff hours (quarter) 53,426

Nursing staff breakdown

Registered Nurse

Manages medical care and health needs.

Total count 25
Average shift length Info Average shift length. Calculated as total hours divided by days worked and average staff per day. 7.9 hours

No contractors work on this role.

Licensed Practical Nurse

Assists with medical care and medications.

Total count 32
Average shift length Info Average shift length. Calculated as total hours divided by days worked and average staff per day. 7.9 hours

This role is partially covered by contractors.

Certified Nursing Assistant

Helps with daily care and mobility.

Total count 93
Average shift length Info Average shift length. Calculated as total hours divided by days worked and average staff per day. 8.3 hours

This role is partially covered by contractors.

Contractor staffing

Total hours from contractors

10.3%

5,487 contractor hours this quarter

Licensed Practical Nurse: 18 Respiratory Therapy Technician: 3 Physical Therapy Assistant: 3 Physical Therapy Aide: 2 Qualified Social Worker: 2 Certified Nursing Assistant: 1 Occupational Therapy Aide: 1 Speech Language Pathologist: 1

Staff by category

Certified Nursing Assistant9219327,25491100%8.3
Licensed Practical Nurse1418326,76191100%7.9
Registered Nurse250255,12891100%7.9
Clinical Nurse Specialist8083,4076673%8
Other Dietary Services Staff9093,14491100%6.9
Dental Services Staff6062,7229099%8
Administrator2029806470%8
Physical Therapy Aide0228636571%7.1
Nurse Practitioner1015046470%7.9
Speech Language Pathologist0115016875%7.4
Mental Health Service Worker1014886167%8
Dietitian1014725965%8
RN Director of Nursing1014696066%7.8
Respiratory Therapy Technician0333566875%4.2
Physical Therapy Assistant0331705662%2.5
Occupational Therapy Aide0111182527%4.7
Qualified Social Worker022895459%1.6
93 Certified Nursing Assistant
% of Days 100%
32 Licensed Practical Nurse
% of Days 100%
25 Registered Nurse
% of Days 100%
8 Clinical Nurse Specialist
% of Days 73%
9 Other Dietary Services Staff
% of Days 100%
6 Dental Services Staff
% of Days 99%
2 Administrator
% of Days 70%
2 Physical Therapy Aide
% of Days 71%
1 Nurse Practitioner
% of Days 70%
1 Speech Language Pathologist
% of Days 75%
1 Mental Health Service Worker
% of Days 67%
1 Dietitian
% of Days 65%
1 RN Director of Nursing
% of Days 66%
3 Respiratory Therapy Technician
% of Days 75%
3 Physical Therapy Assistant
% of Days 62%
1 Occupational Therapy Aide
% of Days 27%
2 Qualified Social Worker
% of Days 59%

Facility Characteristics

Source: CMS Long-Term Care Facility Characteristics (Data as of Jan 2026)

Total residents 101
Medicare
10
9.9% of residents
Medicaid
36
35.6% of residents
Private pay or other
55
54.5% of residents
Programs & Services
Residents Group

Residents meet regularly to discuss policies, care quality, and activities

CCRC

Part of a Continuing Care Retirement Community offering multiple care levels

Active Resident Council

Organized group of residents that meets regularly to discuss facility policies, quality of life, and activities.

Quality of care over time

These measures show how residents usually do over time at this home, based on health outcomes and preventive care.

High-risk clinical events score Info A composite score based on pressure ulcers, falls with injury, weight loss, walking ability decline, and activities of daily living decline. 11.9
23% worse than Illinois average

Illinois average: 9.7

Functional decline score Info A composite score based on activities of daily living decline, walking ability decline, and incontinence. 24.8
33% worse than Illinois average

Illinois average: 18.6

Long-stay resident measures
Need for Help with Daily Activities Increased Info Percent of long-stay residents whose need for help with daily activities has increased 28.4%
84% worse than Illinois average

Illinois average: 15.5%

Walking Ability Worsened Info Percent of long-stay residents whose ability to move independently worsened 19.1%
In line with Illinois average

Illinois average: 18.4%

Low Risk Residents with Bowel/Bladder Incontinence Info Percent of low risk long-stay residents who lose control of their bowels or bladder 26.9%
24% worse than Illinois average

Illinois average: 21.6%

Falls with Major Injury Info Percent of long-stay residents experiencing one or more falls with major injury 3.4%
In line with Illinois average

Illinois average: 3.4%

High Risk Residents with Pressure Ulcers Info Percent of long-stay high risk residents with pressure ulcers 3.1%
41% better than Illinois average

Illinois average: 5.3%

Urinary Tract Infection Info Percent of long-stay residents with a urinary tract infection 10.8%
499% worse than Illinois average

Illinois average: 1.8%

Lost Too Much Weight Info Percent of long-stay residents who lose too much weight 5.7%
13% better than Illinois average

Illinois average: 6.5%

Depressive Symptoms Info Percent of long-stay residents who have depressive symptoms 3.4%
93% better than Illinois average

Illinois average: 48.1%

Antipsychotic Use Info Percent of long-stay residents who received an antipsychotic medication 10.1%
50% better than Illinois average

Illinois average: 20.2%

Pneumococcal Vaccine Info Percent of long-stay residents assessed and appropriately given the pneumococcal vaccine 99.7%
12% better than Illinois average

Illinois average: 89.2%

Influenza Vaccine Info Percent of long-stay residents assessed and appropriately given the seasonal influenza vaccine 100.0%
9% better than Illinois average

Illinois average: 91.6%

Short-stay resident measures
Pneumococcal Vaccine Info Percent of short-stay residents assessed and appropriately given the pneumococcal vaccine 99.1%
45% better than Illinois average

Illinois average: 68.3%

Antipsychotic medication increase Info Percent of short-stay residents who newly received an antipsychotic medication 0.0%
100% better than Illinois average

Illinois average: 2.3%

Influenza Vaccine Info Percent of short-stay residents assessed and appropriately given the seasonal influenza vaccine 98.2%
56% better than Illinois average

Illinois average: 63.0%

Penalties and fines

Federal penalties imposed by CMS for regulatory violations, including civil money penalties (fines) and denials of payment for new Medicare/Medicaid admissions.

Source: CMS Penalties Database (Data as of Jan 2026)

Total fines amount $27K
81% lower than Illinois average

Illinois average: $143K

Number of fines 1
66% fewer fines than Illinois average

Illinois average: 3.0

Payment Denials Info Serious action where Medicare and/or Medicaid temporarily stops payments for new residents until issues are fixed. 0
100% fewer payment denials than Illinois average

Illinois average: 1.1

Fines amount comparison
This facility $27K
Illinois average $143K
Penalty History

Penalties are imposed by CMS for violations of federal nursing home regulations.

1 penalty in the past 3 years

Aug 19, 2023 · $27K

Civil Money Penalty Info Fines imposed for noncompliance, which can be assessed per day or per instance of violation. Aug 19, 2023
$27K

Last updated: Jan 2026

Compare Nursing Home around Quincy

The information below is reported by the Illinois Department of Public Health, Office of Health Care Regulation.

3 facilities compared · CMS & IL Dept. of Health data · Updated May 2026

Filter by care type
Good Samaritan Home
NH

Nursing Home Licensed facility providing 24/7 skilled nursing care for residents with complex, ongoing medical needs. Staffed by RNs, LPNs, and CNAs. Inspected and star-rated annually by CMS. Accepts Medicare (short-term rehab) and Medicaid (long-term care).

AL

Assisted Living A licensed, long-term care setting for seniors or individuals with disabilities who need help with daily activities — like bathing, dressing, and medication management — but not 24-hour skilled nursing. Offers housing, meals, and around-the-clock support while aiming to maximize resident independence.

IL

Independent Living Lifestyle-focused communities for older adults offering dining, activities, and transportation with minimal personal care. Best for active, independent seniors who want community without medical support.

MC

Memory Care Secured, specialized care for people living with Alzheimer's or dementia. Staff trained in cognitive impairment, with higher staff-to-resident ratios and an environment designed to reduce confusion and wandering risk.

Quincy231 46.8% -32%5.33 -7%+72%1162.33100 16 Emma Mcleod$18.6M$10.6M56.9%145773
Quincy Healthcare and Senior Living
NH

Nursing Home Licensed facility providing 24/7 skilled nursing care for residents with complex, ongoing medical needs. Staffed by RNs, LPNs, and CNAs. Inspected and star-rated annually by CMS. Accepts Medicare (short-term rehab) and Medicaid (long-term care).

AL

Assisted Living A licensed, long-term care setting for seniors or individuals with disabilities who need help with daily activities — like bathing, dressing, and medication management — but not 24-hour skilled nursing. Offers housing, meals, and around-the-clock support while aiming to maximize resident independence.

RC

Respite Care Short-term temporary care — days to weeks — to give family caregivers a break. Full care provided during the stay. Often used after hospitalization or to trial a facility before a permanent placement decision.

Quincy90 87.3% +26%3.37 -23%+9%2383.5471 45 S&C Holdings Illinois LLC$8.3M$3.3M39.5%145457
Sunset Home
NH

Nursing Home Licensed facility providing 24/7 skilled nursing care for residents with complex, ongoing medical needs. Staffed by RNs, LPNs, and CNAs. Inspected and star-rated annually by CMS. Accepts Medicare (short-term rehab) and Medicaid (long-term care).

Quincy132 77.8% +12%4.37 +10%+41%4644.61196 59 Jerry Neal$11.6M$7.3M63.2%145800

Guides for Better Senior Living

Care Cost Calculator: See Prices in Your Area

Nursing Home Data Explorer

Don’t Wait Too Long: 7 Red Flag Signs Your Parent Needs Assisted Living Now

The True Cost of Assisted Living in 2025 – And How Families Are Paying For It

Understanding Senior Living Costs: Pricing Models, Discounts & Financial Assistance

Frequently Asked Questions about Good Samaritan Home

Is Good Samaritan Home in a walkable area?

Good Samaritan Home has a walk score of 16. Car-dependent. Most errands require a car, with limited nearby walkable options.

What is the occupancy rate at Good Samaritan Home?

Good Samaritan Home's occupancy is 46.8%.

What is the best email address for Good Samaritan Home?

The team at Good Samaritan Home can be reached at [email protected].

What is the address of Good Samaritan Home?

Good Samaritan Home is located at 2130 Harrison St, Quincy, IL 62301.

What is the phone number of Good Samaritan Home?

(217) 223-8717 will put you in contact with the team at Good Samaritan Home.

Is Good Samaritan Home Medicare or Medicaid certified?

Yes — Good Samaritan Home is a CMS-certified provider of Medicare and Medicaid.

Explore Open Rooms
1 Contact details
2 What type of senior care service are you looking for?
3 What budget do you have in mind for senior care?
4 How soon do you need to find care?
5 Additional details

Thank you for your interest!

Our team will be in touch shortly to help with next steps.