Sunset Home
Nursing Home, Assisted Living, Hospice Care, Memory Care, Nursing Care, Palliative Care & Respite Care · Quincy, IL
CMS overall rating Info CMS (the Centers for Medicare & Medicaid Services) is the federal agency that rates nursing home quality. Its Overall Rating runs from 1 to 5 stars, combining health inspections, staffing, and quality measures, with inspections weighted most heavily.

Sunset Home

Nursing Home, Assisted Living, Hospice Care, Memory Care, Nursing Care, Palliative Care & Respite Care · Quincy, IL
CMS overall rating Info CMS (the Centers for Medicare & Medicaid Services) is the federal agency that rates nursing home quality. Its Overall Rating runs from 1 to 5 stars, combining health inspections, staffing, and quality measures, with inspections weighted most heavily.
Calculator: See prices in your area
Sunset Home accepts Medicare, Medicaid, and private pay.

Overview of Sunset Home

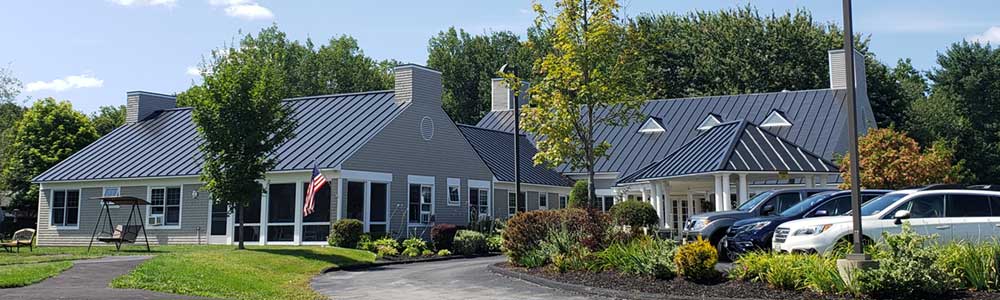
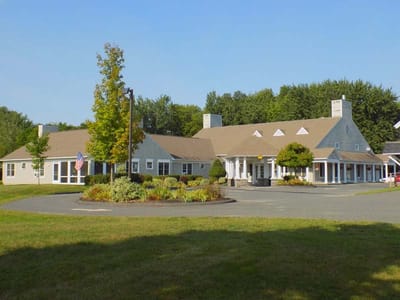
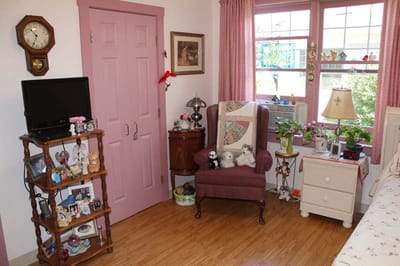
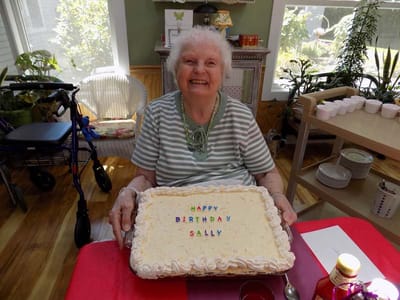
Sunset Home is a nursing home in Quincy, IL, offering comprehensive care options, including independent living, assisted living, rehabilitation, and skilled nursing. Fostering comfort and healing, the community has thoughtfully furnished amenities set in a home-like environment. Three nutritious meals, social services, housekeeping, and laundry are just some of the exceptional services dedicated to enriching residents’ living experiences. Through personalized care plans, residents also receive the utmost attention and care tailored to their ever-changing needs and preferences.

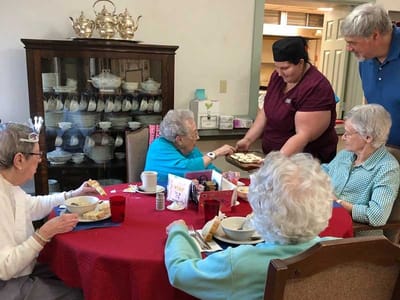
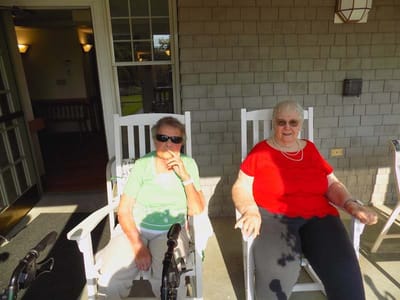
Therapeutic activities, outings, and social events encourage residents to maintain holistic wellness and explore new interests. With spacious outdoors and lively communal spaces, residents can freely interact with friends and rest comfortably. Situated near the Mississippi River in the quiet residential area of Quincy, the community guarantees a laid-back lifestyle. This nursing home is a good option for senior living in Illinois, especially with its exceptional standards of care.

Quality ratings

Measured by Centers for Medicare & Medicaid Services (CMS)

Overall rating Info The Overall CMS Rating combines results from health inspections, staffing levels and quality measures. Health inspections carry the most weight. Staffing and quality scores can increase or decrease the final rating based on performance compared to state and national standards.
▼ 60.3% Below IL avg. ▼ 60.3% Below IL avg.IL average: 2.5Click the badge to see the full State ranking.Click here to see the full State ranking.
Health Inspection Info Based on the results of the facility's three most recent standard inspections and any complaint investigations. CMS reviews the number, scope, and severity of deficiencies, with more recent findings weighted more heavily.
▼ 64.0% Below IL avg. ▼ 64.0% Below IL avg.IL average: 2.8Click the badge to see the full State ranking.Click here to see the full State ranking.
Staffing Info Measures average nursing staff hours per resident per day, including Registered Nurses (RNs) and total nursing staff. Ratings are adjusted based on the level of care residents require and are compared to state and national benchmarks.
▲ 40.4% Above IL avg. ▲ 40.4% Above IL avg.IL average: 2.1Click the badge to see the full State ranking.Click here to see the full State ranking.
Quality Measures Info Based on clinical and physical health indicators reported to CMS, such as hospital readmissions, falls, pressure ulcers, and improvements in mobility. These measures reflect how well residents' health needs are being managed.
▼ 29.0% Below IL avg. ▼ 29.0% Below IL avg.IL average: 2.8Click the badge to see the full State ranking.Click here to see the full State ranking.

Staffing hours breakdown

Info Daily nursing hours per resident by staff type, reported to CMS. Higher is generally better — compare this facility to state and national averages to see where staffing stands.

Hours per resident per day — compared to Illinois state averages

Total nursing care / resident Info This home is ranked 35th out of 172 homes in Illinois for nurse hours. Total adjusted nursing hours per resident per day, combining RN, LPN, and aide time. CMS adjusts this for case-mix so facilities can be fairly compared.
4h 22m per day
Rank #35 / 172Nurse hours — State benchmarkedThis home is ranked 35th out of 172 homes in Illinois. Shows adjusted nurse hours per resident per day benchmarked to the Illinois average, with a ranking across 172 Illinois facilities. More hours mean more direct care. The national average is about 3.5 hrs; below 3.0 is a red flag.Rankings are based only on facilities in Illinois that report data for that category. Facilities without available data are excluded from the ranking.Click the rank badge to see the full State ranking.Click here to see the full State ranking.
This facility Illinois avg (3h 6m per day)
vs Illinois avg
+41%

3 of 6 metrics below state avg

Standout metric LPN / LVN is +28% above state avg
Staff typeHours / Day / Residentvs state avg
Registered Nurse (RN) Info RNs hold the highest nursing license and can assess residents, interpret test results, and direct care plans. More RN hours per day often signals stronger clinical oversight and faster response to health changes. 37m per day ▼ 13% State avg: 43m per day · National avg: 41m per day
LPN / LVN Info Licensed Practical Nurses (LPNs) or Licensed Vocational Nurses (LVNs) deliver routine hands-on care — medication administration, wound dressing, and monitoring vital signs. They work under RN supervision and make up a large share of daily bedside care. 50m per day ▲ 28% State avg: 39m per day · National avg: 52m per day
Nurse Aide Info Certified Nurse Aides (CNAs) provide the most direct day-to-day assistance: bathing, dressing, feeding, and mobility. Nurse aide hours are typically the largest staffing category and directly affect residents' quality of life. 2h 12m per day ▲ 4% State avg: 2h 7m per day · National avg: 2h 20m per day
Weekend Total Nursing Info Combined nursing hours (RN + LPN + Nurse Aide) per resident per day on weekends. Staffing often drops on weekends — this figure reveals whether the facility maintains adequate coverage outside of weekday hours. 3h 26m per day ▲ 11% State avg: 3h 6m per day · National avg: 3h 27m per day
Physical Therapist Info Hours per resident per day provided by licensed Physical Therapists (PTs) or PT Assistants. PT services help residents recover mobility after injury or illness and are especially important for post-acute (short-stay) rehabilitation. 1m per day ▼ 58% State avg: 3m per day · National avg: 4m per day
Weekend RN Info Registered nurse hours specifically on weekends. Facilities sometimes reduce RN presence on Saturdays and Sundays — a low weekend RN figure compared to weekday hours can indicate reduced clinical oversight when most administrative staff are absent. 31m per day ▼ 6% State avg: 33m per day · National avg: 29m per day

Capacity and availability

This home usually has availability

Higher occupancy than the Illinois average: 69.3%
Occupancy rate
77.8% Rank #90 / 204Occupancy rate — State benchmarkedThis home is ranked 90th out of 204 homes in Illinois. Shows this facility's occupancy rate versus the Illinois average, with its Statewide rank out of 204. Higher occupancy signals strong local demand and financial stability.Rankings are based only on facilities in Illinois that report data for that category. Facilities without available data are excluded from the ranking.Click the rank badge to see the full State ranking.Click here to see the full State ranking.
Avg. Length of Stay
127 days
Bed community size
132-bed community Rank #68 / 426Bed count — State benchmarkedThis home is ranked 68th out of 426 homes in Illinois. Shows this facility's certified or reported bed count compared to other Illinois facilities. Larger communities may offer more amenities, programs, and on-site services for residents and families.Rankings are based only on facilities in Illinois that report data for that category. Facilities without available data are excluded from the ranking.Click the rank badge to see the full State ranking.Click here to see the full State ranking.
A larger shared setting that may offer more common spaces and organized community services.
Walk Score
Walk Score: 59 / 100 Rank #247 / 648Walk Score — State benchmarkedThis home is ranked 247th out of 648 homes in Illinois. Shows how walkable this facility's neighborhood is compared to the average Walk Score across Illinois facilities. Higher scores benefit residents, families, and staff.Rankings are based only on facilities in Illinois that report data for that category. Facilities without available data are excluded from the ranking.Click the rank badge to see the full State ranking.Click here to see the full State ranking.
Moderately walkable. Some errands can be accomplished on foot, with a mix of nearby amenities.

About this community

License Details

CertificationsMusic and Memory Certified

Therapy & Rehabilitation

3 services
Rehabilitation Services
Respite Care
Short-Term Rehab

Staffing & Medical

2 services
Doctor on Staff
24-Hour Staffing

Additional Services

1 service
Home Care

Additional Policies & Features

Visitor PolicyVisitors must be screened when entering the building.
Admission CriteriaAdmission documents must be completed at the nursing home prior to admission or day of admission.
Minimum Age65+

Amenities & Lifestyle

Activity Calendar
Activities
Branded ProgramsMusic and Memory Certified
Specific Programsreligious services, coffee circles, music hours, pet visits, beauty salon trips
Religious Services
Volunteer Program

Dining & Nutrition

Food DescriptionSunset Home provides family-style dining, allowing residents to enjoy meals together in a communal setting.

Contact Sunset Home

Staffing Data

Reporting period: October 1 – December 31, 2025 (Q4 2025). Source: CMS Payroll-Based Journal report.

Total staff 150
Employees 104
Contractors 46
Staff to resident ratio 1.72 : 1
0% compared with Illinois average
Illinois average ratio: 1.80 : 1 Illinois average ratio: 1.80 : 1See full Illinois ranking
Avg staff/day 50
Average shift 8 hours
5% better than Illinois average
Illinois average: 7.6 hours Illinois average shift: 7.6 hoursSee full Illinois ranking
Total staff hours (quarter) 36,905

Nursing staff breakdown

Q4 2025 · Oct 1 – Dec 31 More info This data comes from the CMS Payroll-Based Journal report covering October 1 – December 31, 2025.
Registered Nurse

Manages medical care and health needs.

RN Staff Info All 14 RN Staff are full-time employees. No contractors work on this role. 14
Average shift length Info Average shift length. Calculated as total hours divided by days worked and average staff per day. 8.1 hours
Licensed Practical Nurse

Assists with medical care and medications.

LPN Staff Info All 18 LPN Staff are full-time employees. No contractors work on this role. 18
Average shift length Info Average shift length. Calculated as total hours divided by days worked and average staff per day. 9.2 hours
Certified Nursing Assistant

Helps with daily care and mobility.

CNA Staff Info 93 total: 49 full-time employees and 44 contractors. 93
Average shift length Info Average shift length. Calculated as total hours divided by days worked and average staff per day. 8.2 hours

Contractor staffing

Q4 2025 · Oct 1 – Dec 31 More info This data comes from the CMS Payroll-Based Journal report covering October 1 – December 31, 2025.

Total hours from contractors

5.8%

2,155 contractor hours this quarter

Certified Nursing Assistant: 44 Occupational Therapy Aide: 1 Occupational Therapy Assistant: 1

Staff by category

Q4 2025 · Oct 1 – Dec 31 More info This data comes from the CMS Payroll-Based Journal report covering October 1 – December 31, 2025.
Certified Nursing Assistant49449318,60692100%8.2
Licensed Practical Nurse180186,99392100%9.2
Registered Nurse140144,38192100%8.1
Other Dietary Services Staff3031,2999199%7
Dental Services Staff3031,1797177%6.9
Speech Language Pathologist4048706571%7
Physical Therapy Aide2027097076%6.8
Administrator1014966267%8
Nurse Practitioner1014926267%7.9
Dietitian1014766065%7.9
Qualified Social Worker2024486368%6.9
Clinical Nurse Specialist2024165863%7.2
Physical Therapy Assistant2022845964%4.5
Respiratory Therapy Technician2021834751%3.9
Occupational Therapy Aide011451314%3.4
Occupational Therapy Assistant0112944%7.3
93 Certified Nursing Assistant
% of Days 100%
18 Licensed Practical Nurse
% of Days 100%
14 Registered Nurse
% of Days 100%
3 Other Dietary Services Staff
% of Days 99%
3 Dental Services Staff
% of Days 77%
4 Speech Language Pathologist
% of Days 71%
2 Physical Therapy Aide
% of Days 76%
1 Administrator
% of Days 67%
1 Nurse Practitioner
% of Days 67%
1 Dietitian
% of Days 65%
2 Qualified Social Worker
% of Days 68%
2 Clinical Nurse Specialist
% of Days 63%
2 Physical Therapy Assistant
% of Days 64%
2 Respiratory Therapy Technician
% of Days 51%
1 Occupational Therapy Aide
% of Days 14%
1 Occupational Therapy Assistant
% of Days 4%

Penalties and fines

Includes penalties issued in 2023-2025

Federal penalties imposed by CMS for regulatory violations, including civil money penalties (fines) and denials of payment for new Medicare/Medicaid admissions.

Source: CMS Penalties Database (Data as of Jan 2026)

Total fines amount $243K Rank #151 / 173Federal fines — State benchmarkedThis home is ranked 151st out of 173 homes in Illinois. Shows this facility's cumulative CMS federal fine dollars versus the Illinois average among facilities with fines, and where it ranks among 173 facilities in the pool. Lower total dollars mean a better rank.Rankings are based only on facilities in Illinois that report data for that category. Facilities without available data are excluded from the ranking.Click the rank badge to see the full State ranking.Click here to see the full State ranking.
70% higher than Illinois average

Illinois average: $143K

Number of fines 4
35% more fines than Illinois average

Illinois average: 3.0

Payment Denials Info Serious action where Medicare and/or Medicaid temporarily stops payments for new residents until issues are fixed. 0
100% fewer payment denials than Illinois average

Illinois average: 1.1

Fines amount comparison
This facility $243K
Illinois average $143K
Penalty History

Penalties are imposed by CMS for violations of federal nursing home regulations.

3 penalties in the past 3 years

Multiple penalties were reported in the last 3 years.

Civil Money Penalty Info Fines imposed for noncompliance, which can be assessed per day or per instance of violation. Mar 19, 2025
$39K
Civil Money Penalty Info Fines imposed for noncompliance, which can be assessed per day or per instance of violation. Apr 3, 2024
$40K
Civil Money Penalty Info Fines imposed for noncompliance, which can be assessed per day or per instance of violation. Jul 10, 2023
$135K

Last updated: Jan 2026

Quality of care over time

These measures show how residents usually do over time at this home, based on health outcomes and preventive care.

High-risk clinical events score Info A composite score based on pressure ulcers, falls with injury, weight loss, walking ability decline, and activities of daily living decline. 16.4
69% worse than Illinois average

Illinois average: 9.7

Functional decline score Info A composite score based on activities of daily living decline, walking ability decline, and incontinence. 30.2
63% worse than Illinois average

Illinois average: 18.6

Long-stay resident measures
Need for Help with Daily Activities Increased Info Percent of long-stay residents whose need for help with daily activities has increased 28.9%
86% worse than Illinois average

Illinois average: 15.5%

Walking Ability Worsened Info Percent of long-stay residents whose ability to move independently worsened 33.9%
84% worse than Illinois average

Illinois average: 18.4%

Low Risk Residents with Bowel/Bladder Incontinence Info Percent of low risk long-stay residents who lose control of their bowels or bladder 28.0%
29% worse than Illinois average

Illinois average: 21.6%

Falls with Major Injury Info Percent of long-stay residents experiencing one or more falls with major injury 9.2%
173% worse than Illinois average

Illinois average: 3.4%

High Risk Residents with Pressure Ulcers Info Percent of long-stay high risk residents with pressure ulcers 4.0%
25% better than Illinois average

Illinois average: 5.3%

Urinary Tract Infection Info Percent of long-stay residents with a urinary tract infection 1.0%
47% better than Illinois average

Illinois average: 1.8%

Lost Too Much Weight Info Percent of long-stay residents who lose too much weight 6.3%
In line with Illinois average

Illinois average: 6.5%

Depressive Symptoms Info Percent of long-stay residents who have depressive symptoms 0.3%
99% better than Illinois average

Illinois average: 48.1%

Antipsychotic Use Info Percent of long-stay residents who received an antipsychotic medication 15.6%
23% better than Illinois average

Illinois average: 20.2%

Pneumococcal Vaccine Info Percent of long-stay residents assessed and appropriately given the pneumococcal vaccine 91.8%
In line with Illinois average

Illinois average: 89.2%

Influenza Vaccine Info Percent of long-stay residents assessed and appropriately given the seasonal influenza vaccine 98.8%
8% better than Illinois average

Illinois average: 91.6%

Short-stay resident measures
Pneumococcal Vaccine Info Percent of short-stay residents assessed and appropriately given the pneumococcal vaccine 42.1%
38% worse than Illinois average

Illinois average: 68.3%

Antipsychotic medication increase Info Percent of short-stay residents who newly received an antipsychotic medication 0.0%
100% better than Illinois average

Illinois average: 2.3%

Influenza Vaccine Info Percent of short-stay residents assessed and appropriately given the seasonal influenza vaccine 53.5%
15% worse than Illinois average

Illinois average: 63.0%

Breakdown by payment type

Medicare

76% of new residents, usually for short-term rehab.

Typical stay 17 days

Private pay

14% of new residents, often for short stays.

Typical stay 8 - 9 months

Medicaid

11% of new residents, often for long-term daily care.

Typical stay 1 - 2 years

Facility Characteristics

Source: CMS Long-Term Care Facility Characteristics (Data as of Jan 2026)

Total residents 87
Medicare
9
10.3% of residents
Medicaid
49
56.3% of residents
Private pay or other
29
33.3% of residents
Programs & Services
Residents Group

Residents meet regularly to discuss policies, care quality, and activities

Active Resident Council

Organized group of residents that meets regularly to discuss facility policies, quality of life, and activities.

Finances and operations

Based on CMS SNF Cost Report for fiscal year ending in 09/2023.

Nonprofit
Nonprofit Corporation
Net patient revenue Info Net patient revenue — what the home actually collects for resident care, after contractual allowances, bad debt and discounts are subtracted from its gross charges (CMS cost report, Worksheet G-3). It covers resident care only; money the home earns from other sources is shown separately as "Other income."
$9.9M
Net patient income Info Net patient income: net patient revenue minus the home's total operating expenses. A positive figure means it earns more from resident care than it spends to deliver it; a negative figure means the opposite. It excludes non-operating "other income."
-$4.5M
Nonprofit Nonprofit Corporation
Net patient revenue Info Net patient revenue — what the home actually collects for resident care, after contractual allowances, bad debt and discounts are subtracted from its gross charges (CMS cost report, Worksheet G-3). It covers resident care only; money the home earns from other sources is shown separately as "Other income."
$9.9M Rank #114 / 171Revenue — State benchmarkedThis home is ranked 114th out of 171 homes in Illinois. Shows this facility's annual revenue compared to the Illinois average. Higher revenue generally means more resources for staffing and capital — read alongside Payroll %.Rankings are based only on facilities in Illinois that report data for that category. Facilities without available data are excluded from the ranking.Click the rank badge to see the full State ranking.Click here to see the full State ranking.
Net patient income Info Net patient income: net patient revenue minus the home's total operating expenses. A positive figure means it earns more from resident care than it spends to deliver it; a negative figure means the opposite. It excludes non-operating "other income."
-$4.5M
Other income Info Money the home earns outside of resident care — such as investments, grants, rentals and other non-operating sources (CMS cost report, Worksheet G-3). It is tracked separately from net patient revenue: it is not part of that figure, and it is not included in net patient income.
$3.8M
Payroll costs Info Staff salaries plus wage-related costs — benefits such as payroll taxes, health insurance and retirement — from the home's own accounting records (CMS cost report, Worksheet A). Contract or agency labor is counted separately, under other operating costs. Rank #54 / 171Payroll — State benchmarkedThis home is ranked 54th out of 171 homes in Illinois. Shows total annual staff payroll benchmarked to the Illinois average. Higher payroll investment relative to peers often signals better staffing and less reliance on cheaper contract labor.Rankings are based only on facilities in Illinois that report data for that category. Facilities without available data are excluded from the ranking.Click the rank badge to see the full State ranking.Click here to see the full State ranking.
$8.6M 86.7% of net patient revenue Info Payroll as a share of revenue: staff salaries and wage-related benefits divided by net patient revenue. A higher figure means more of each revenue dollar goes to staff pay. Rank #3 / 171Payroll % — State benchmarkedThis home is ranked 3rd out of 171 homes in Illinois. Shows payroll as a percentage of revenue versus the Illinois average. Well-run Illinois facilities typically land around 54–67% — the top third Statewide. Below 25% may signal understaffing or heavy agency use — read with Staffing ratings.Rankings are based only on facilities in Illinois that report data for that category. Facilities without available data are excluded from the ranking.Click the rank badge to see the full State ranking.Click here to see the full State ranking.
Other operating costs Info Everything it costs to run the home apart from payroll — food, utilities, supplies, maintenance, contract labor and administration. Calculated as total operating expense minus payroll (staff salaries and wage-related benefits).
$5.8M
Total costs Info The home's total operating expense for the year — all the costs of running it, salaries included (CMS cost report, Worksheet G-3).
$14.4M

What does this home offer?

Building type icon
Building type icon

Building Type: 3-story

On-site medical care and health services icon

On-site Medical Care and Health Services

Beauty services icon

Beauty Services

Rehabilitative support icon

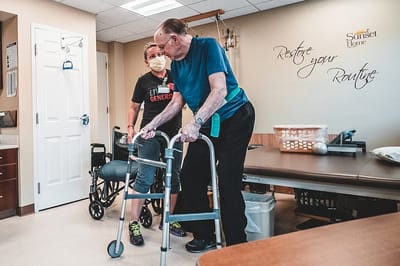
Rehabilitative Support

Housekeeping icon
Housekeeping icon

Housekeeping Services

Social and recreational activities icon

Social and Recreational Activities

Transportation services icon

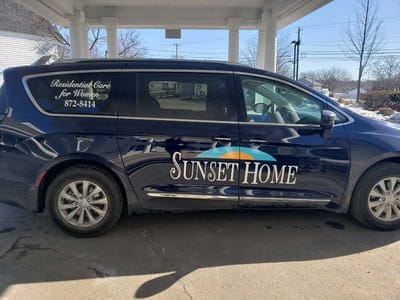
Transportation Services

Who this home usually serves

TYPE OF STAY

Mostly short-term rehab stays

Most residents typically stay for a few weeks or months before returning home or moving on.

Most new residents arrive under Medicare (76% of admissions), and a typical Medicare stay runs around 17 days.

Admissions
323 total

Coverage residents most often arrive under.

Medicare 76%
Private pay 14%
Medicaid 11%
Discharges
296 total

Coverage residents most often leave under.

Medicare 40%
Private pay 28%
Medicaid 32%

Places of interest near Sunset Home

Address 1.1 miles from city center Info Estimated distance in miles from Quincy's city center to Sunset Home's address, calculated via Google Maps.

Calculate Travel Distance to Sunset Home

Add your location

Address

Compare Nursing Homes around Quincy

The information below is reported by the Illinois Department of Public Health, Office of Health Care Regulation.

3 facilities compared · CMS & IL Dept. of Health data

Good Samaritan Home
NH
AL
IL
MC
Quincy
26
Facility 26
IL AVG 86
Rank #397 / 426
46.8%
Facility 46.8%
IL AVG 69.3%
Rank #182 / 204
-32%
5.33
Facility 5.33
IL AVG 3.10
Rank #10 / 172
+10%+72%
$26.6k
Facility $26.6k
IL AVG $151.3k
Rank #96 / 173
16
Facility 16
IL AVG 36.8
Rank #24 / 172
2.3
Facility 2.3
IL AVG 3.7
Rank #15 / 172
3102-
16
Facility 16
IL AVG 51
Rank #570 / 648
Emma Mcleod
$11.1M
Facility $11.1M
IL AVG $12.2M
Rank #62 / 171
$13.4M
Facility $13.4M
IL AVG $4.8M
Rank #16 / 171
120.8%
Facility 120.8%
IL AVG 44.3%
Rank #8 / 171
145773
Quincy Healthcare and Senior Living
NH
AL
HC
IL
RC
Quincy
89
Facility 89
IL AVG 86
Rank #154 / 426
87.3%
Facility 87.3%
IL AVG 69.3%
Rank #44 / 204
+26%
3.37
Facility 3.37
IL AVG 3.10
Rank #57 / 172
+8%+9%
$35.8k
Facility $35.8k
IL AVG $151.3k
Rank #102 / 173
38
Facility 38
IL AVG 36.8
Rank #107 / 172
3.5
Facility 3.5
IL AVG 3.7
Rank #82 / 172
476-
45
Facility 45
IL AVG 51
Rank #380 / 648
S&C Holdings Illinois LLC
$8.1M
Facility $8.1M
IL AVG $12.2M
Rank #146 / 171
$3.8M
Facility $3.8M
IL AVG $4.8M
Rank #151 / 171
46.9%
Facility 46.9%
IL AVG 44.3%
Rank #66 / 171
145457
Sunset Home
NH
AL
HC
MC
NC
PC
RC
Quincy
132
Facility 132
IL AVG 86
Rank #68 / 426
77.8%
Facility 77.8%
IL AVG 69.3%
Rank #90 / 204
+12%
4.37
Facility 4.37
IL AVG 3.10
Rank #35 / 172
-34%+41%
$200.6k
Facility $200.6k
IL AVG $151.3k
Rank #151 / 173
64
Facility 64
IL AVG 36.8
Rank #151 / 172
4.6
Facility 4.6
IL AVG 3.7
Rank #140 / 172
1192-
59
Facility 59
IL AVG 51
Rank #247 / 648
Jerry Neal
$9.9M
Facility $9.9M
IL AVG $12.2M
Rank #114 / 171
$8.6M
Facility $8.6M
IL AVG $4.8M
Rank #54 / 171
86.7%
Facility 86.7%
IL AVG 44.3%
Rank #3 / 171
145800

Financial Assistance for
Nursing Home in Illinois

Sunset Home is located in Quincy, Illinois.
Here are the financial assistance programs available to residents in Illinois.

Get Financial aid guidance

Community Care Program

Illinois CCP

Age 60+
General Illinois resident, at risk of nursing home placement.
Income Limits (2025) ~$1,215/month individual
Asset Limits $17,500 individual, excludes home, car
IL

High demand in urban areas; waitlists possible.

Benefits
In-home care (3-5 hours/day) Adult day services ($65/day) Emergency home response systems ($30/month)

Illinois Respite Program

IL Respite (via NFCSP)

Age Caregiver of someone 60+ (or with dementia)
General Illinois resident.
Income Limits No strict limit; prioritizes low-income.
Asset Limits Not applicable.
IL

Limited slots; urban/rural balance.

Benefits
In-home respite (4-6 hours/day) Adult day care (~$65/day) Short-term facility care (up to 5 days)

Supportive Living Program (SLP)

Illinois Medicaid Supportive Living Program

Age 65+ or 22-64 with disability
General Illinois resident, Medicaid-eligible, needs moderate assistance (not nursing home-level).
Income Limits (2025) ~$2,829/month (300% FBR, individual); QIT allowed.
Asset Limits $2,000 (individual), $3,000 (couple) (excludes home, car).
IL

~200 SLP sites statewide; room/board not covered.

Benefits
Personal care (5-7 hours/day, e.g., bathing, mobility) Meals Housekeeping Medication management Respite (~240 hours/year)

Persons Who Are Elderly Waiver

Illinois Medicaid Elderly Waiver

Age 65+
General Illinois resident, Medicaid-eligible, nursing home-level care need.
Income Limits (2025) ~$2,829/month 300% FBR, individual
Asset Limits $2,000 (individual), $3,000 (couple).
IL

Part of HealthChoice Illinois; consumer-directed options available.

Benefits
Personal care (5-7 hours/day, e.g., dressing, eating) Homemaker Adult day care (~$60/day) Respite (240 hours/year) Home mods ($1,000 avg.)

Medicare Savings Program (MSP)

Illinois Medicare Savings Program

Age 65+ or disabled
General Illinois resident, Medicare Part A/B.
Income Limits (2025) ~$2,510/month (QMB), ~$3,380/month (SLMB), ~$3,598/month (QI)—individual.
Asset Limits $9,430 (individual), $14,130 (couple).
IL

Three tiers; no waitlist.

Benefits
Covers Part B premiums ($174.70/month) Deductibles ($240/year) Copays (~20%)

Optional State Supplementation (OSS)

Illinois Optional State Supplementation

Age 65+ or disabled
General Illinois resident, in approved facility, SSI recipient or low-income.
Income Limits (2025) ~$1,004/month including SSI
Asset Limits $2,000 (individual), $3,000 (couple).
IL

~$50-$500/month based on facility type.

Benefits
Cash (~$50-$500/month) for room/board in personal care homes or SLFs

VA Aid and Attendance (A&A) and Housebound Benefits

Illinois VA Aid and Attendance/Housebound

Age 65+ or disabled veteran/spouse
General Illinois resident, wartime service, need for ADL help (A&A) or homebound.
Income Limits (2025) Net income < ~$1,984/month (veteran with dependent, A&A); pension offsets income.
Asset Limits ~$155,356 net worth limit
IL

High veteran demand in urban/rural areas.

Benefits
Cash (~$1,433-$2,642/month veteran, ~$951-$1,318 spouse) for care costs (e.g., in-home, assisted living)

Frequently Asked Questions about Sunset Home

Is Sunset Home in a walkable area?

Sunset Home has a walk score of 59. Moderately walkable. Some errands can be accomplished on foot, with a mix of nearby amenities.

What is the occupancy rate at Sunset Home?

Sunset Home's occupancy is 77.8%.

Does Sunset Home operate as a for-profit or non-profit?

Sunset Home is registered as a non-profit.

Are there photos of Sunset Home?

Yes — there are 26 photos of Sunset Home in the photo gallery on this page.

What is the address of Sunset Home?

Sunset Home is located at 418 Washington St, Quincy, IL 62301.

What is the phone number of Sunset Home?

(217) 223-2636 will put you in contact with the team at Sunset Home.

Is Sunset Home Medicare or Medicaid certified?

Yes — Sunset Home is a CMS-certified provider of Medicare and Medicaid.

Guides for Better Senior Living

Care Cost Calculator: See Prices in Your Area

Nursing Home Data Explorer

Don’t Wait Too Long: 7 Red Flag Signs Your Parent Needs Assisted Living Now

The True Cost of Assisted Living in 2025 – And How Families Are Paying For It

Understanding Senior Living Costs: Pricing Models, Discounts & Financial Assistance