Occupancy rate
50%
Mississippi average: 72%

We arrange tours, appointments, and even moving support so you don’t have to
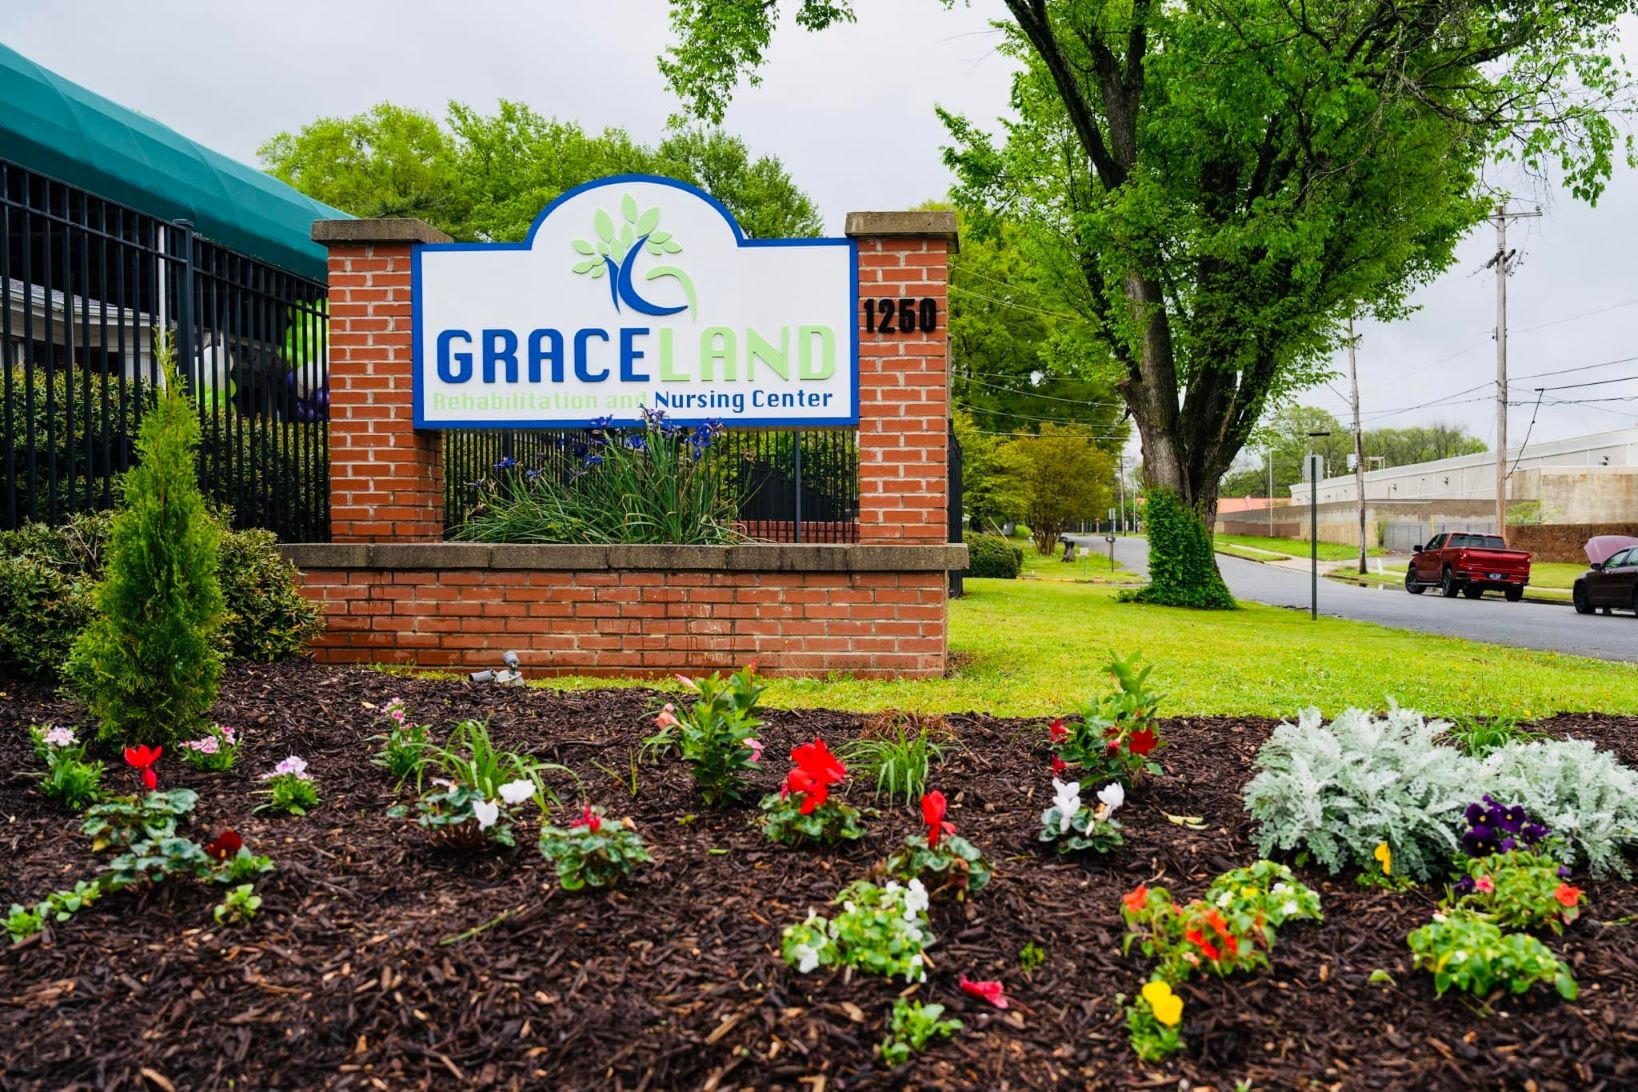


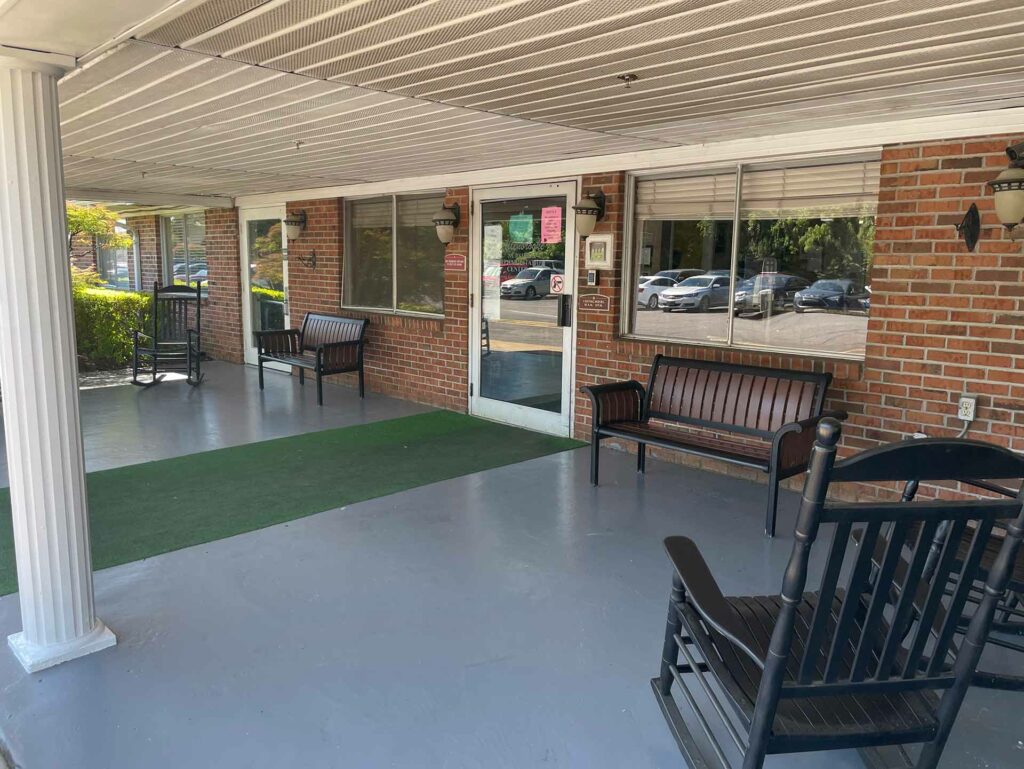
Set amidst the blissful neighborhood of Memphis, TN Graceland Rehabilitation and Nursing Center is a respected senior care provider offering comprehensive rehabilitation and nursing care services. The community features a team of highly-skilled and knowledgeable nurses led by a well-respected medical director, giving residents peace of mind knowing that they are in great and capable hands. The team carefully curates individualized care plans for each resident, which may include speech, physical, and occupational therapy, or 24/7 respiratory therapy.
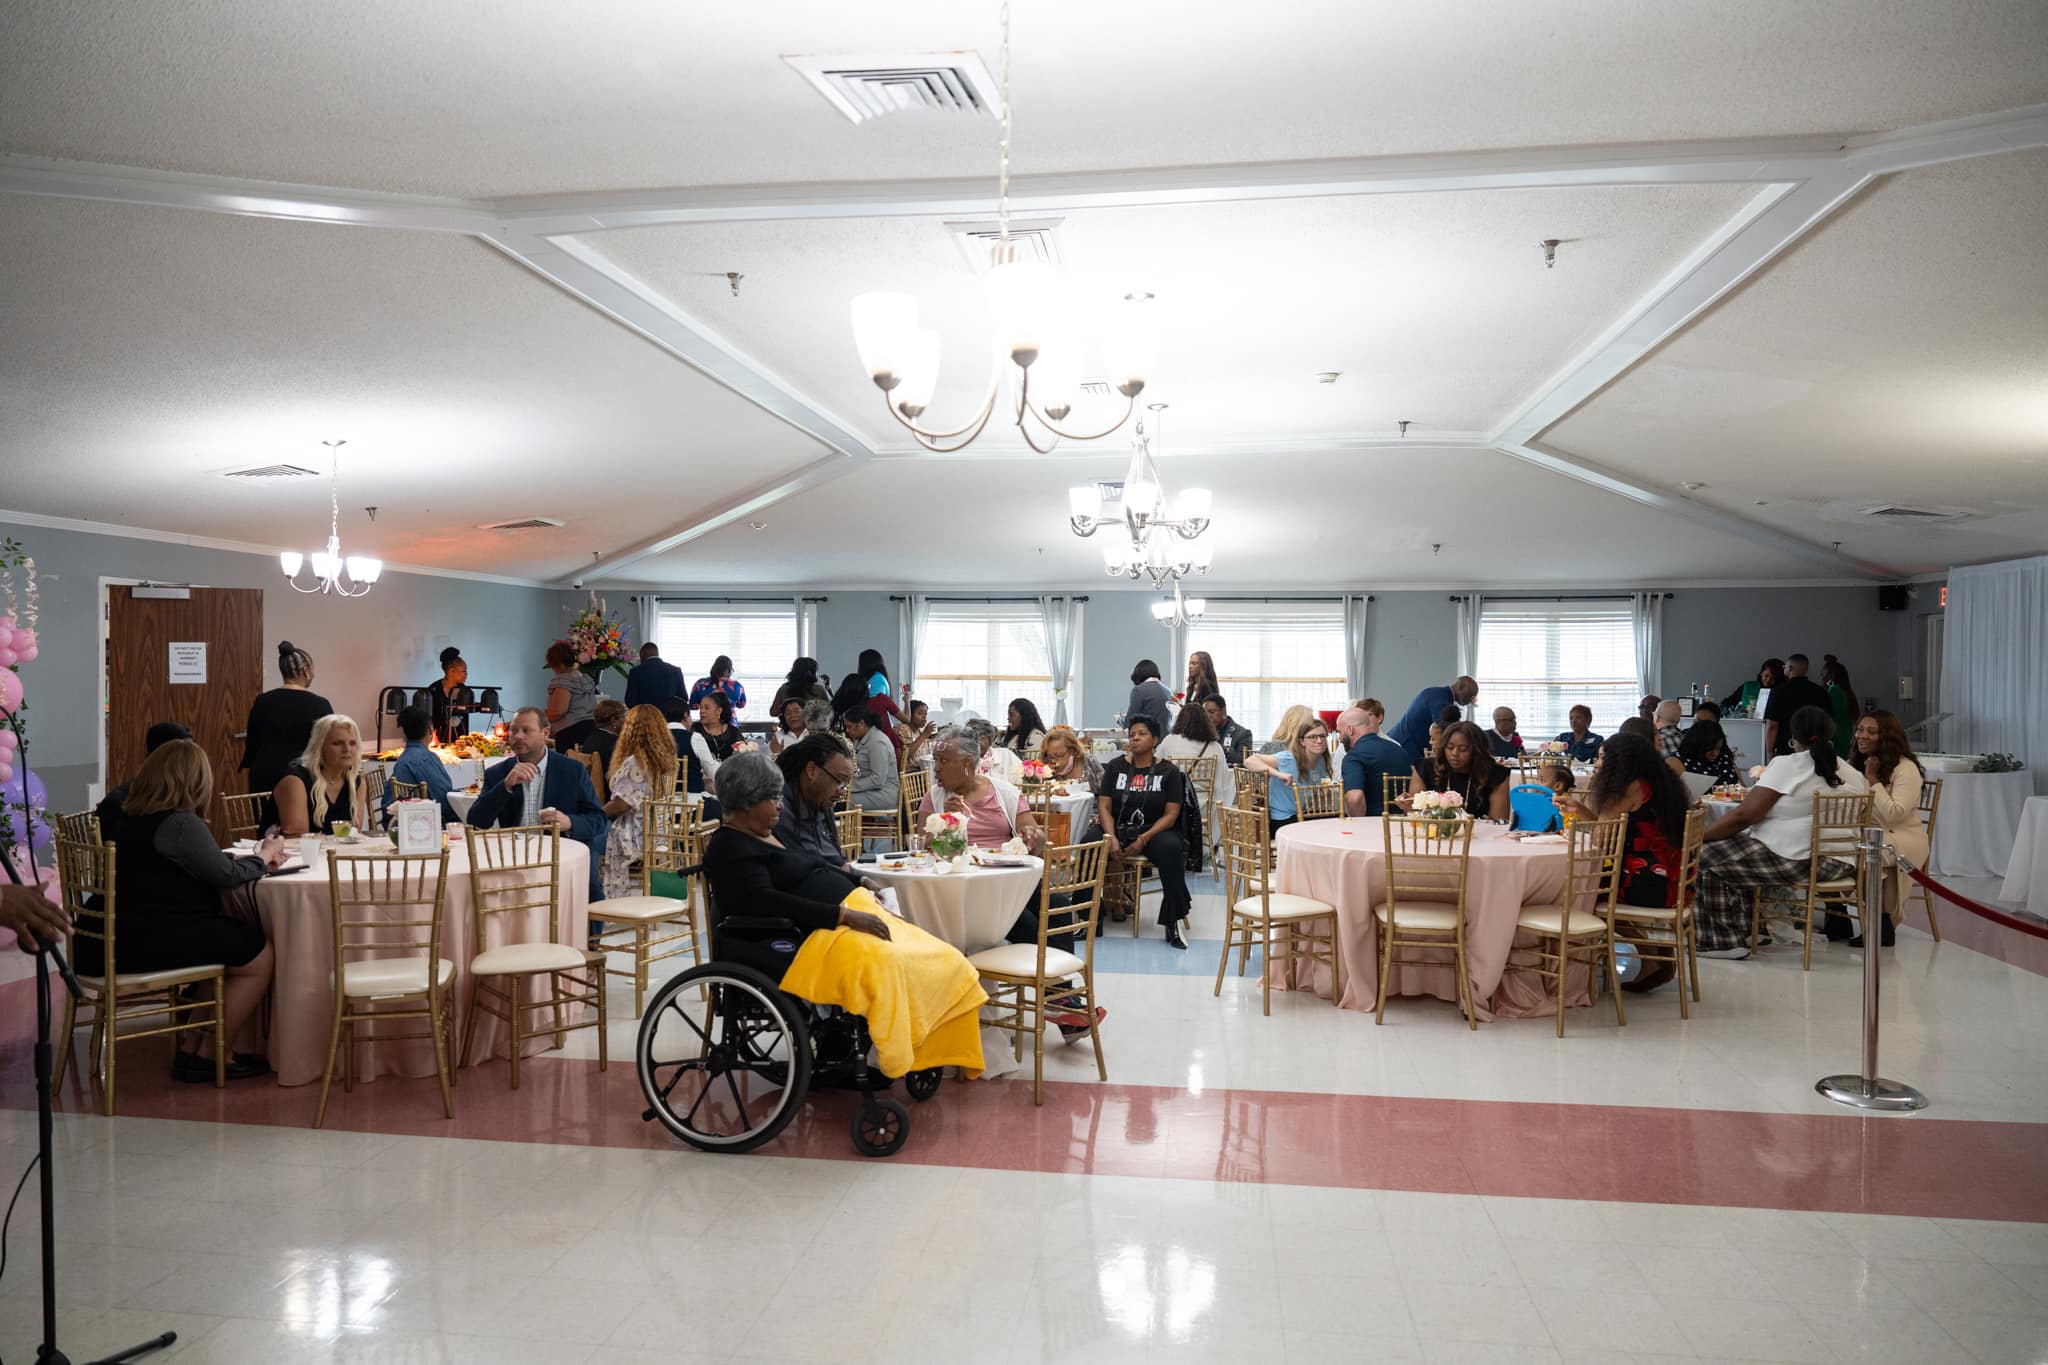
The community closely works with their team, residents, and families to ensure that their wishes and needs are aligned with the services provided by the team for a successful outcome. Utilizing a holistic approach to care, the community also offers an array of activities to nurture its residents’ social and recreational needs for a whole-person enrichment. Here, residents have access to all the support and care they need to thrive and recover successfully.
 Official CMS rating based on health inspections, staffing and quality measures.
Official CMS rating based on deficiencies found during state health inspections.
Official CMS rating based on nurse staffing hours per resident per day.
Official CMS rating based on clinical outcomes for residents.
Average daily nursing hours per resident (adjusted for acuity). Higher values indicate more nursing time per resident.
Hours of care per resident per day, broken down by staff type. Data from CMS Medicare.
Registered nurse hours per resident per day.
Official CMS rating based on health inspections, staffing and quality measures.
Official CMS rating based on deficiencies found during state health inspections.
Official CMS rating based on nurse staffing hours per resident per day.
Official CMS rating based on clinical outcomes for residents.
Average daily nursing hours per resident (adjusted for acuity). Higher values indicate more nursing time per resident.
Hours of care per resident per day, broken down by staff type. Data from CMS Medicare.
Registered nurse hours per resident per day.
May offer a more intimate, personalized care environment.
Lower occupancy suggests more openings may be available.
Most residents stay for extended periods and receive ongoing daily care.
17% of new residents, usually for short-term rehab.
31% of new residents, often for short stays.
52% of new residents, often for long-term daily care.
The portion of the home's budget spent on staff, including nurses, caregivers, and other employees who support care and operations.
All remaining costs needed to run the home, such as food, utilities, building maintenance, supplies and administrative expenses.
Mississippi average: 72%
Graceland Rehabilitation and Nursing Center is legally operated by Graceland Nursing Operator, LLC, and administrated by Machelle Ann Calaway.
Key information about the people who lead and staff this community.
Accept Medicaid: Yes
Total Residents: 240
Building Type: Single-story
In Mississippi, the Department of Health, Division of Health Care Facilities performs unannounced inspections and investigations to ensure facilities provide high-quality resident care.
Violations indicate regulatory issues. A higher number implies the facility had several areas requiring improvement.
Mississippi average: 2 violations
Mississippi average 4.4
Last Health inspection on May 2025
Health citations are formal notices following inspections when they fail to comply with safety and care standards.
11 of 43 citations resulted from standard inspections; 29 of 43 resulted from complaint investigations; and 3 of 43 came from combined inspections (standard and complaint).
Mississippi average: 1
Mississippi average: 1.1
Data sourced from CMS Health Deficiencies reports. Citation severity codes range from A (least serious) to L (most serious). Immediate Jeopardy (J-L) citations indicate situations where the facility's noncompliance has placed residents at risk of death or serious harm.
Assisted Living For seniors needing help with daily tasks but not full-time nursing.
Independent Living For self-sufficient seniors seeking community and minimal assistance.
Memory Care Specialized care for those with Memory Loss, Alzheimer's, or dementia, ensuring safety and support.
Nursing Homes 24/7 care needed
Nursing Home 24/7 care needed
Assisted Living For seniors needing help with daily tasks but not full-time nursing.
Nursing Home 24/7 care needed
Assisted Living For seniors needing help with daily tasks but not full-time nursing.
Assisted Living For seniors needing help with daily tasks but not full-time nursing.
Independent Living For self-sufficient seniors seeking community and minimal assistance.
Memory Care Specialized care for those with Memory Loss, Alzheimer's, or dementia, ensuring safety and support.
Nursing Homes 24/7 care needed
Nursing Home 24/7 care needed
Assisted Living For seniors needing help with daily tasks but not full-time nursing.
 Allenbrooke Nursing & Rehab Center
 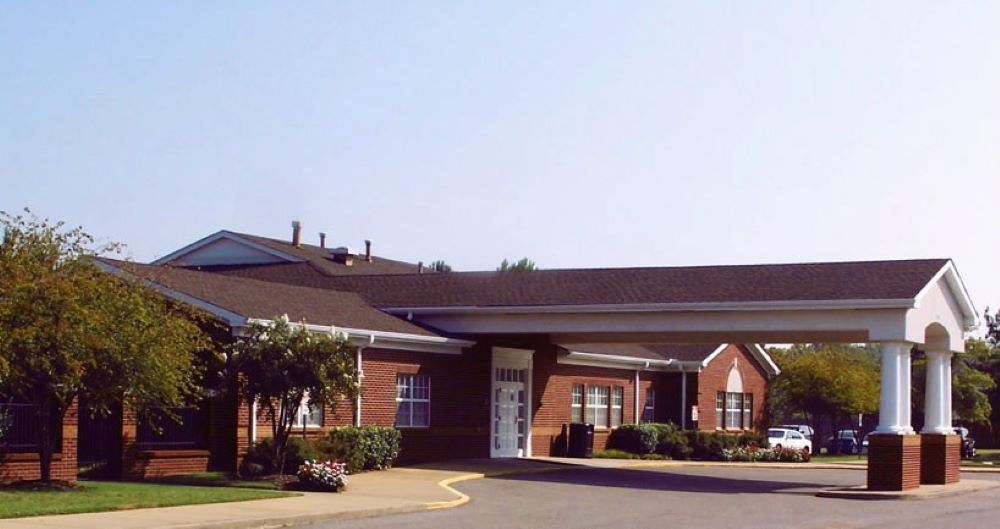 DeSoto Healthcare Center
  Diversicare of Safe Haven
 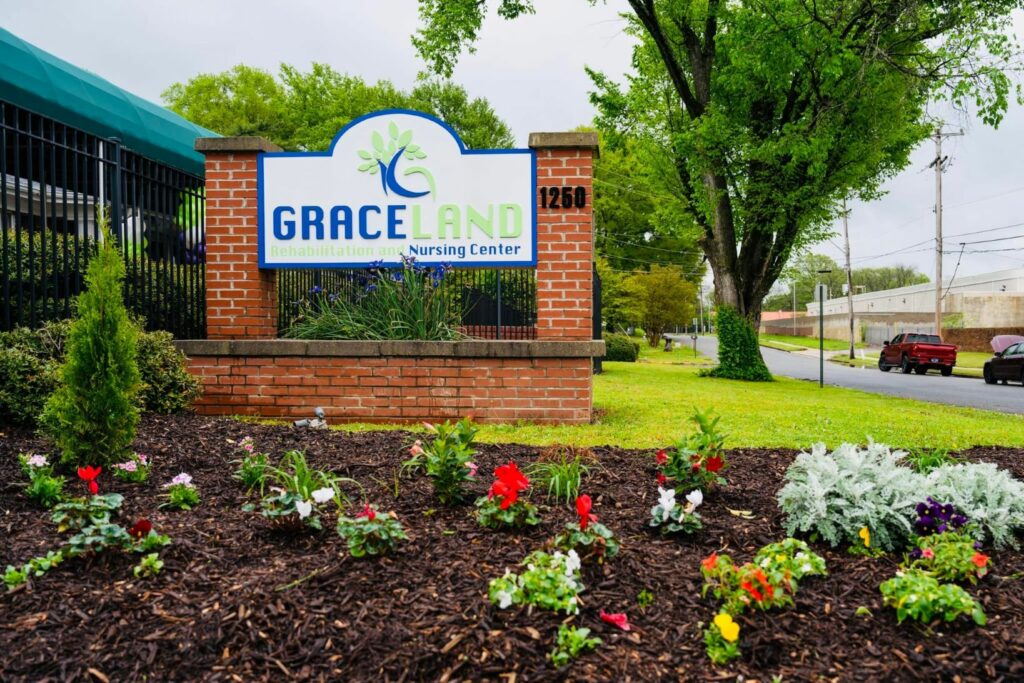 Graceland Rehabilitation and Nursing Center
![]() 4.1 miles from city center — 4.79 miles to nearest hospital (Baptist Memorial Hospital-DeSoto)
4.1 miles from city center — 4.79 miles to nearest hospital (Baptist Memorial Hospital-DeSoto)
![]() 1250 Farrow Rd, Memphis, TN 38116
1250 Farrow Rd, Memphis, TN 38116
Add your location
Source: CMS Payroll-Based Journal (Q2 2025)
| Role ⓘ | Count ⓘ | Avg Shift (hrs) ⓘ | Uses Contractors? ⓘ |
|---|---|---|---|
| Registered Nurse | 7 | 7 | No |
| Licensed Practical Nurse | 97 | 8.3 | Yes |
| Certified Nursing Assistant | 123 | 7.6 | Yes |
| Role ⓘ | Employees ⓘ | Contractors ⓘ | Total Staff ⓘ | Total Hours ⓘ | Days Worked ⓘ | % of Days ⓘ | Avg Shift (hrs) ⓘ |
|---|---|---|---|---|---|---|---|
| Certified Nursing Assistant | 97 | 26 | 123 | 25,890 | 91 | 100% | 7.6 |
| Licensed Practical Nurse | 48 | 49 | 97 | 14,361 | 91 | 100% | 8.3 |
| Qualified Activities Professional | 28 | 0 | 28 | 6,682 | 91 | 100% | 8.6 |
| Clinical Nurse Specialist | 10 | 1 | 11 | 3,851 | 88 | 97% | 7.9 |
| Speech Language Pathologist | 12 | 0 | 12 | 2,470 | 91 | 100% | 6.7 |
| Physical Therapy Aide | 8 | 0 | 8 | 1,899 | 91 | 100% | 6.2 |
| Registered Nurse | 7 | 0 | 7 | 1,322 | 91 | 100% | 7 |
| Respiratory Therapy Technician | 5 | 0 | 5 | 1,054 | 72 | 79% | 6.1 |
| Feeding Assistant | 0 | 4 | 4 | 828 | 73 | 80% | 7.9 |
| RN Director of Nursing | 2 | 0 | 2 | 786 | 62 | 68% | 7.9 |
| Physical Therapy Assistant | 3 | 0 | 3 | 672 | 76 | 84% | 5.6 |
| Qualified Social Worker | 2 | 0 | 2 | 651 | 89 | 98% | 5.2 |
| Administrator | 1 | 0 | 1 | 488 | 61 | 67% | 8 |
| Mental Health Service Worker | 1 | 0 | 1 | 488 | 61 | 67% | 8 |
| Other Dietary Services Staff | 1 | 0 | 1 | 476 | 61 | 67% | 7.8 |
| Nurse Practitioner | 1 | 0 | 1 | 472 | 59 | 65% | 8 |
| Dietitian | 1 | 0 | 1 | 464 | 58 | 64% | 8 |
| Dental Services Staff | 1 | 0 | 1 | 376 | 50 | 55% | 7.5 |
| Diagnostic X-ray Services Staff | 0 | 2 | 2 | 124 | 37 | 41% | 3.1 |
| Other Physician | 0 | 5 | 5 | 111 | 28 | 31% | 3.8 |
| Medical Director | 0 | 1 | 1 | 26 | 13 | 14% | 2 |
Source: CMS Long-Term Care Facility Characteristics (Data as of Jan 2026)
Residents meet regularly to discuss policies, care quality, and activities
Family members meet regularly to discuss policies, care quality, and activities
Organized group of family members that meets regularly to discuss facility policies, resident care, and activities.
Organized group of residents that meets regularly to discuss facility policies, quality of life, and activities.
Data sourced from CMS Long-Term Care Facility Characteristics quarterly report. Payer mix reflects the current resident census by primary payment source.
These measures show how residents usually do over time at this home, based on health outcomes and preventive care.
Mississippi average: 10.5
Mississippi average: 19.5
Mississippi average: 16.0%
Mississippi average: 21.7%
Mississippi average: 20.7%
Mississippi average: 3.7%
Mississippi average: 5.4%
Mississippi average: 2.1%
Mississippi average: 6.3%
Mississippi average: 11.0%
Mississippi average: 16.5%
Mississippi average: 89.9%
Mississippi average: 94.5%
Mississippi average: 1.58
Mississippi average: 1.57
Mississippi average: 79.7%
Mississippi average: 1.7%
Mississippi average: 79.8%
Mississippi average: 22.2%
Mississippi average: 11.2%
Mississippi average: 0.8%
Mississippi average: 53.7%
Mississippi average: 50.6%
Quality measures are calculated from Minimum Data Set (MDS) assessments. For most measures, lower percentages indicate better care quality.
Federal penalties imposed by CMS for regulatory violations, including civil money penalties (fines) and denials of payment for new Medicare/Medicaid admissions.
Source: CMS Penalties Database (Data as of Jan 2026)
Mississippi average: $86K
Mississippi average: 1.7
Mississippi average: 0.5
Penalties are imposed by CMS for violations of federal nursing home regulations.
Last updated: Jan 2026
Historical financial and operational data for Graceland Rehabilitation and Nursing Center based on CMS SNF Cost Reports.
Loading trend charts...
Care Cost Calculator: See Prices in Your Area
Nursing Home Data Explorer
Don’t Wait Too Long: 7 Red Flag Signs Your Parent Needs Assisted Living Now
The True Cost of Assisted Living in 2025 – And How Families Are Paying For It
Understanding Senior Living Costs: Pricing Models, Discounts & Financial Assistance

Touring a community? Use this expert-backed checklist to stay organized, ask the right questions, and find the perfect fit.
We'll send you a PDF version of the touring checklist.