Total health inspections
5
Texas average 7.4
Last Health inspection on Nov 2024

We arrange tours, appointments, and even moving support so you don’t have to
Thank you for your interest!
Our team will be in touch shortly to help with next steps.

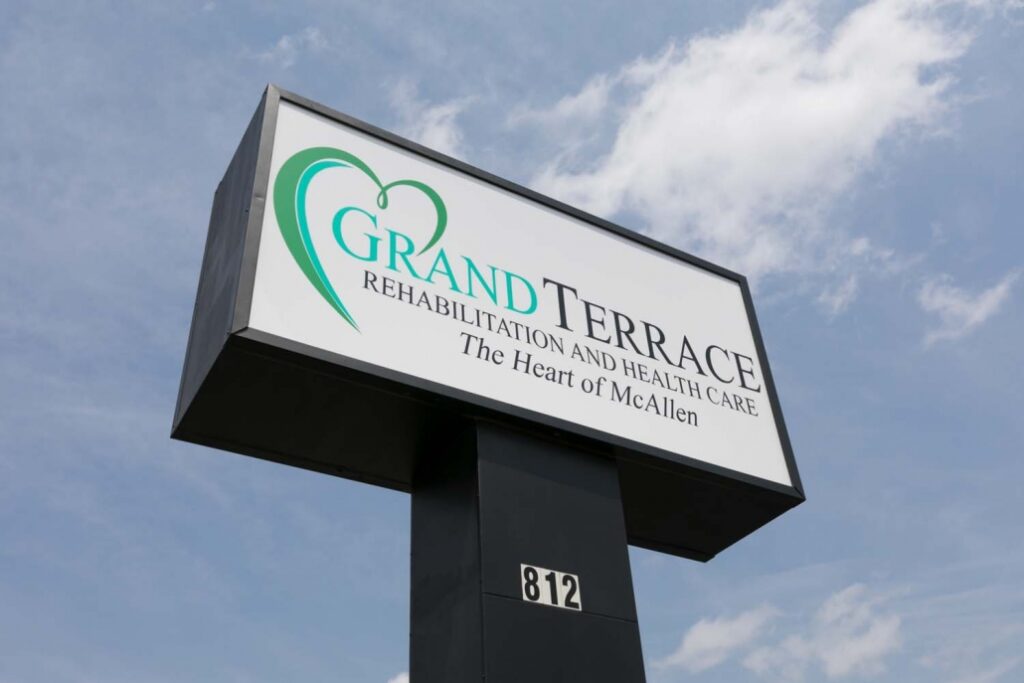
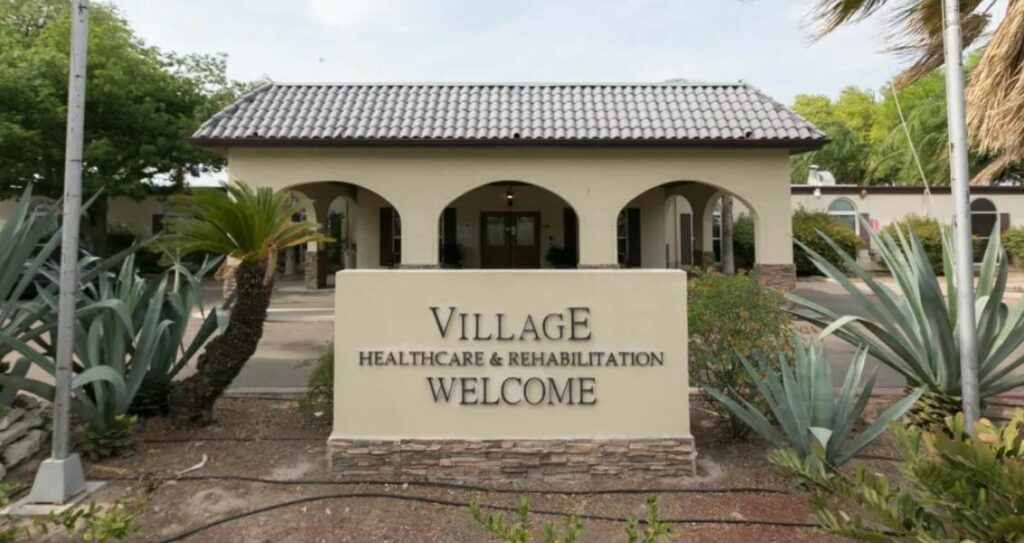
Enticing seniors with a relaxing environment, Grand Terrace Rehabilitation and Healthcare is an outstanding senior living community located in the serene neighborhood of West Houston Avenue, McAllen, TX, that offers skilled nursing and in-house therapy. With its dedication to seniors’ well-being, the community strives to provide the highest quality of care and support around the clock. Grand Terrace Rehabilitation and Healthcare ensures the utmost comfort and healing of residents with a team of compassionate and highly trained professionals.
Pursue the lifestyle of your dreams while receiving the right assistance for your ever-changing needs. With a wide array of care options offered in the community, residents can ease their minds and do the things they love. Grand Terrace Rehabilitation and Healthcare promotes a lively and inviting environment for seniors to easily adapt into the community and have a smooth healing journey.
May offer a more intimate, personalized care environment.
Lower occupancy suggests more openings may be available.
This home supports both short-term rehab and long-term care, with residents staying for a wide range of durations.
22% of new residents, usually for short-term rehab.
51% of new residents, often for short stays.
27% of new residents, often for long-term daily care.
Grand Terrace Rehabilitation and Healthcare is administrated by Nefi Guzman.
Key information about the people who lead and staff this community.
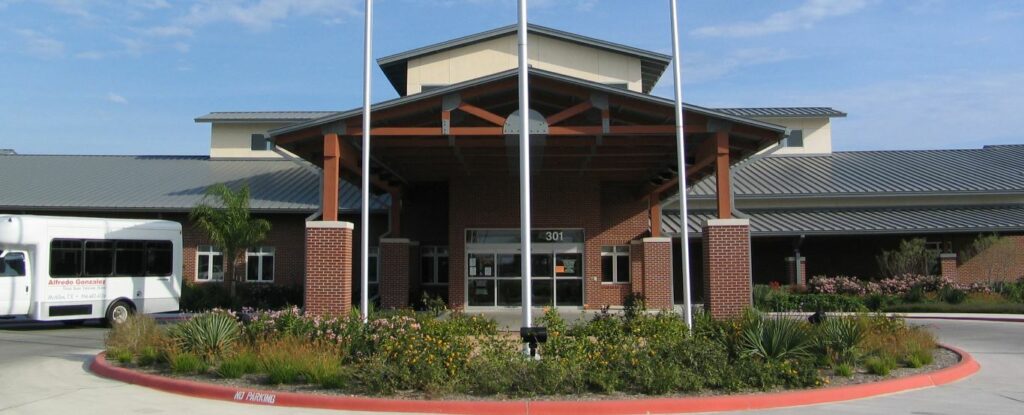
Building Type: Single-story
Transportation Services
Fitness and Recreation
In Texas, the Health and Human Services Commission (HHSC) is the primary regulatory body that conducts unannounced inspections and publishes quality reports for all long-term care homes.
4 visits/inspections triggered by complaints
1 routine inspections
7 with issues
0 without issues
Deficiencies indicate regulatory issues. A higher number implies the facility had several areas requiring improvement.
Texas average: 32 deficiencies
Texas average 7.4
Last Health inspection on Nov 2024
Texas average 25.9
Texas average 3.67
Health citations are formal notices following inspections when they fail to comply with safety and care standards.
6 of 9 citations resulted from standard inspections; 2 of 9 resulted from complaint investigations; and 1 of 9 came from combined inspections (standard and complaint).
Texas average: 2
Texas average: 0.4
Data sourced from CMS Health Deficiencies reports. Citation severity codes range from A (least serious) to L (most serious). Immediate Jeopardy (J-L) citations indicate situations where the facility's noncompliance has placed residents at risk of death or serious harm.
Nursing Home Licensed facility providing 24/7 skilled nursing care for residents with complex, ongoing medical needs. Staffed by RNs, LPNs, and CNAs. Inspected and star-rated annually by CMS. Accepts Medicare (short-term rehab) and Medicaid (long-term care).
Respite Care Short-term temporary care — days to weeks — to give family caregivers a break. Full care provided during the stay. Often used after hospitalization or to trial a facility before a permanent placement decision.
Nursing Home Licensed facility providing 24/7 skilled nursing care for residents with complex, ongoing medical needs. Staffed by RNs, LPNs, and CNAs. Inspected and star-rated annually by CMS. Accepts Medicare (short-term rehab) and Medicaid (long-term care).
Memory Care Secured, specialized care for people living with Alzheimer's or dementia. Staff trained in cognitive impairment, with higher staff-to-resident ratios and an environment designed to reduce confusion and wandering risk.
Nursing Home Licensed facility providing 24/7 skilled nursing care for residents with complex, ongoing medical needs. Staffed by RNs, LPNs, and CNAs. Inspected and star-rated annually by CMS. Accepts Medicare (short-term rehab) and Medicaid (long-term care).
Respite Care Short-term temporary care — days to weeks — to give family caregivers a break. Full care provided during the stay. Often used after hospitalization or to trial a facility before a permanent placement decision.
Nursing Home Licensed facility providing 24/7 skilled nursing care for residents with complex, ongoing medical needs. Staffed by RNs, LPNs, and CNAs. Inspected and star-rated annually by CMS. Accepts Medicare (short-term rehab) and Medicaid (long-term care).
Home Care Professional care delivered in the person's own home — from companionship and errands to skilled nursing and therapy. Allows seniors to age in place. Medicare covers skilled home health when medically necessary.
Nursing Home Licensed facility providing 24/7 skilled nursing care for residents with complex, ongoing medical needs. Staffed by RNs, LPNs, and CNAs. Inspected and star-rated annually by CMS. Accepts Medicare (short-term rehab) and Medicaid (long-term care).
Respite Care Short-term temporary care — days to weeks — to give family caregivers a break. Full care provided during the stay. Often used after hospitalization or to trial a facility before a permanent placement decision.
Nursing Home Licensed facility providing 24/7 skilled nursing care for residents with complex, ongoing medical needs. Staffed by RNs, LPNs, and CNAs. Inspected and star-rated annually by CMS. Accepts Medicare (short-term rehab) and Medicaid (long-term care).
Nursing Home Licensed facility providing 24/7 skilled nursing care for residents with complex, ongoing medical needs. Staffed by RNs, LPNs, and CNAs. Inspected and star-rated annually by CMS. Accepts Medicare (short-term rehab) and Medicaid (long-term care).
Respite Care Short-term temporary care — days to weeks — to give family caregivers a break. Full care provided during the stay. Often used after hospitalization or to trial a facility before a permanent placement decision.
Nursing Home Licensed facility providing 24/7 skilled nursing care for residents with complex, ongoing medical needs. Staffed by RNs, LPNs, and CNAs. Inspected and star-rated annually by CMS. Accepts Medicare (short-term rehab) and Medicaid (long-term care).
![]() 27.0 miles from city center
27.0 miles from city center
Add your location
This data corresponds to Q2 2025 and is based on CMS Payroll-Based Journal.
Texas average ratio: 1.51:1
Texas average: 8.1 hours
Manages medical care and health needs.
No contractors work on this role.
Assists with medical care and medications.
No contractors work on this role.
Helps with daily care and mobility.
No contractors work on this role.
Total hours from contractors
45 contractor hours this quarter
| Certified Nursing Assistant | 36 | 0 | 36 | 11,645 | 91 | 100% | 7.3 |
| Licensed Practical Nurse | 13 | 0 | 13 | 3,551 | 91 | 100% | 8.7 |
| Registered Nurse | 12 | 0 | 12 | 3,455 | 91 | 100% | 8.1 |
| Medication Aide/Technician | 7 | 0 | 7 | 2,474 | 91 | 100% | 7.7 |
| Qualified Activities Professional | 7 | 0 | 7 | 2,281 | 91 | 100% | 9.3 |
| Speech Language Pathologist | 8 | 0 | 8 | 2,039 | 65 | 71% | 7.6 |
| Physical Therapy Aide | 7 | 0 | 7 | 1,677 | 65 | 71% | 6.7 |
| RN Director of Nursing | 5 | 0 | 5 | 1,517 | 65 | 71% | 8.9 |
| Qualified Social Worker | 7 | 0 | 7 | 1,323 | 65 | 71% | 6.9 |
| Dental Services Staff | 3 | 0 | 3 | 1,007 | 64 | 70% | 8 |
| Physical Therapy Assistant | 2 | 0 | 2 | 769 | 65 | 71% | 6.8 |
| Nurse Practitioner | 1 | 0 | 1 | 560 | 63 | 69% | 8.9 |
| Dietitian | 1 | 0 | 1 | 516 | 60 | 66% | 8.6 |
| Respiratory Therapy Technician | 3 | 0 | 3 | 497 | 64 | 70% | 5.9 |
| Therapeutic Recreation Specialist | 1 | 0 | 1 | 459 | 60 | 66% | 7.6 |
| Other Dietary Services Staff | 3 | 0 | 3 | 452 | 58 | 64% | 7.6 |
| Administrator | 1 | 0 | 1 | 432 | 54 | 59% | 8 |
| Nurse Aide in Training | 1 | 0 | 1 | 425 | 59 | 65% | 7.2 |
| Clinical Nurse Specialist | 6 | 0 | 6 | 391 | 46 | 51% | 7.4 |
| Medical Director | 0 | 1 | 1 | 45 | 33 | 36% | 1.4 |
Source: CMS Long-Term Care Facility Characteristics (Data as of Jan 2026)
Residents meet regularly to discuss policies, care quality, and activities
Organized group of residents that meets regularly to discuss facility policies, quality of life, and activities.
Data sourced from CMS Long-Term Care Facility Characteristics quarterly report. Payer mix reflects the current resident census by primary payment source.
These measures show how residents usually do over time at this home, based on health outcomes and preventive care.
Texas average: 8.6
Texas average: 16.0
Texas average: 16.2%
Texas average: 16.2%
Texas average: 15.7%
Texas average: 3.2%
Texas average: 4.4%
Texas average: 0.8%
Texas average: 3.5%
Texas average: 2.9%
Texas average: 7.9%
Texas average: 97.3%
Texas average: 97.9%
Texas average: 2.13
Texas average: 2.07
Texas average: 90.4%
Texas average: 1.4%
Texas average: 88.0%
Texas average: 25.9%
Texas average: 12.0%
Texas average: 0.8%
Texas average: 53.7%
Texas average: 50.6%
Quality measures are calculated from Minimum Data Set (MDS) assessments. For most measures, lower percentages indicate better care quality.
Historical financial and operational data for Grand Terrace Rehabilitation and Healthcare based on CMS SNF Cost Reports.
Loading trend charts...
Care Cost Calculator: See Prices in Your Area
Nursing Home Data Explorer
Don’t Wait Too Long: 7 Red Flag Signs Your Parent Needs Assisted Living Now
The True Cost of Assisted Living in 2025 – And How Families Are Paying For It
Understanding Senior Living Costs: Pricing Models, Discounts & Financial Assistance

Touring a community? Use this expert-backed checklist to stay organized, ask the right questions, and find the perfect fit.
We'll send you a PDF version of the touring checklist.