Granite Creek Health and Rehabilitation
CMS overall rating Info CMS (the Centers for Medicare & Medicaid Services) is the federal agency that rates nursing home quality. Its Overall Rating runs from 1 to 5 stars, combining health inspections, staffing, and quality measures, with inspections weighted most heavily.

Granite Creek Health and Rehabilitation

CMS overall rating Info CMS (the Centers for Medicare & Medicaid Services) is the federal agency that rates nursing home quality. Its Overall Rating runs from 1 to 5 stars, combining health inspections, staffing, and quality measures, with inspections weighted most heavily.
Calculator: See prices in your area
Granite Creek Health and Rehabilitation accepts Medicare, Medicaid, and private pay.

Overview of Granite Creek Health and Rehabilitation

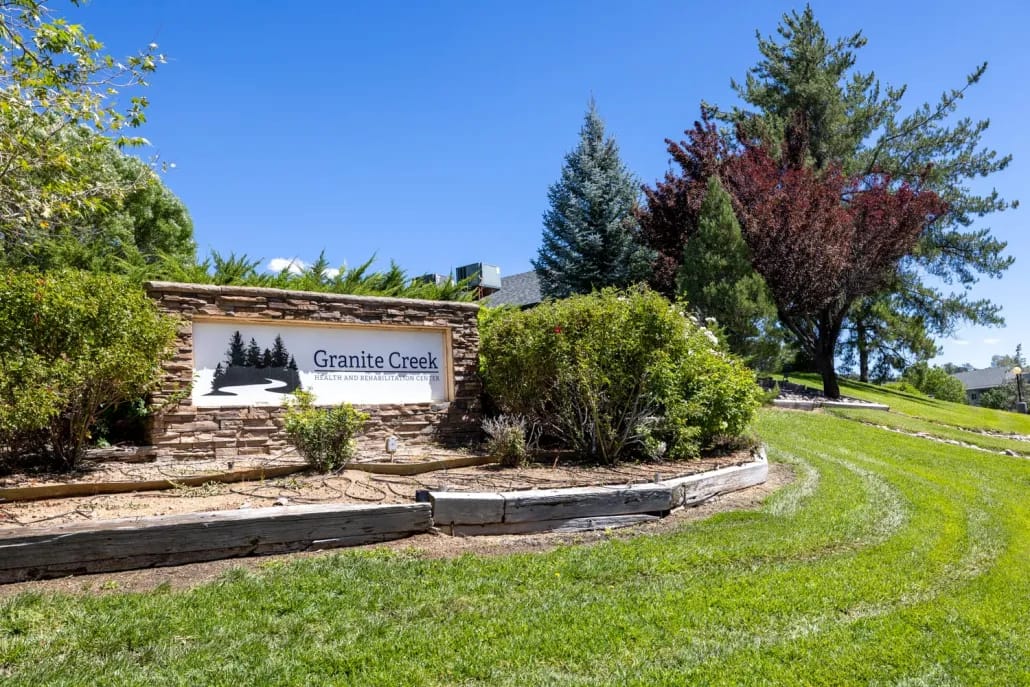
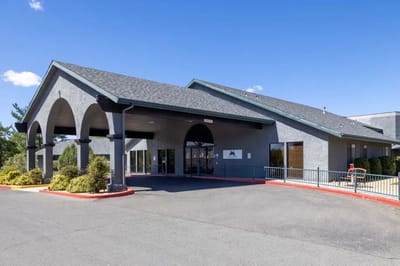
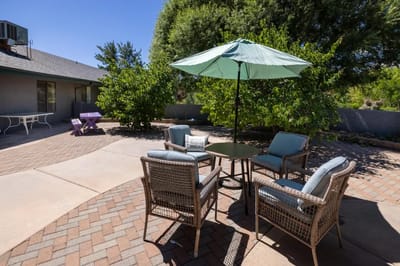
Granite Creek Health and Rehabilitation in Prescott, AZ, is a nursing home that offers rehabilitation and skilled nursing. Here, older adults can ease their worries with a compassionate and nurturing environment. Residents experience a maintenance-free living, as 24-hour care, therapy services, and well-balanced meals are also provided. Through a holistic approach to care, the community ensures older adults receive high-quality care for their needs and preferences.

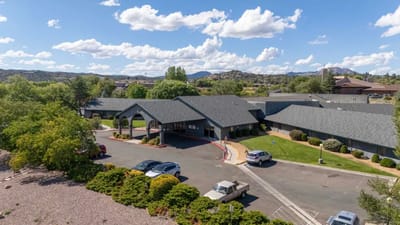
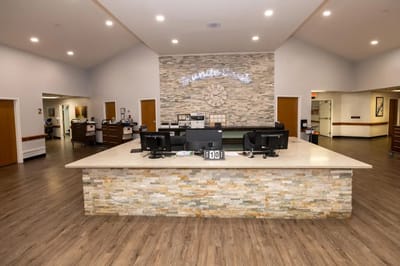
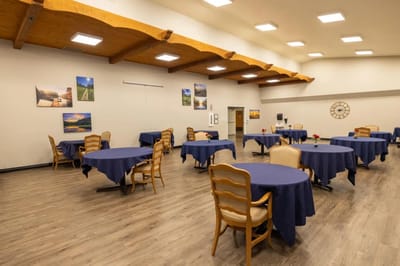
Excursions, arts and crafts classes, and lecture series ensure residents can continue learning and have fun. State-of-the-art rehabilitation equipment and cozy communal spaces are dedicated to residents’ leisure and recovery. Situated near healthcare providers and other local amenities in Prescott, the community ensures residents have easy access to their necessities. This nursing home continuously provides excellent services for older adults’ welfare, making it one of the best choices for senior living in Arizona.

Quality ratings

Measured by Centers for Medicare & Medicaid Services (CMS)

Overall rating Info The Overall CMS Rating combines results from health inspections, staffing levels and quality measures. Health inspections carry the most weight. Staffing and quality scores can increase or decrease the final rating based on performance compared to state and national standards.
▼ 39.7% Below AZ avg. ▼ 39.7% Below AZ avg.AZ average: 3.3Click the badge to see the full State ranking.Click here to see the full State ranking.
Health Inspection Info Based on the results of the facility's three most recent standard inspections and any complaint investigations. CMS reviews the number, scope, and severity of deficiencies, with more recent findings weighted more heavily.
▼ 27.8% Below AZ avg. ▼ 27.8% Below AZ avg.AZ average: 2.8Click the badge to see the full State ranking.Click here to see the full State ranking.
Staffing Info Measures average nursing staff hours per resident per day, including Registered Nurses (RNs) and total nursing staff. Ratings are adjusted based on the level of care residents require and are compared to state and national benchmarks.
▼ 67.1% Below AZ avg. ▼ 67.1% Below AZ avg.AZ average: 3.0Click the badge to see the full State ranking.Click here to see the full State ranking.
Quality Measures Info Based on clinical and physical health indicators reported to CMS, such as hospital readmissions, falls, pressure ulcers, and improvements in mobility. These measures reflect how well residents' health needs are being managed.
▲ 10.8% Above AZ avg. ▲ 10.8% Above AZ avg.AZ average: 4.5Click the badge to see the full State ranking.Click here to see the full State ranking.

Staffing hours breakdown

Info Daily nursing hours per resident by staff type, reported to CMS. Higher is generally better — compare this facility to state and national averages to see where staffing stands.

Hours per resident per day — compared to Arizona state averages

Total nursing care / resident Info This home is ranked 63rd out of 71 homes in Arizona for nurse hours. Total adjusted nursing hours per resident per day, combining RN, LPN, and aide time. CMS adjusts this for case-mix so facilities can be fairly compared.
3h 10m per day
Rank #63 / 71Nurse hours — State benchmarkedThis home is ranked 63rd out of 71 homes in Arizona. Shows adjusted nurse hours per resident per day benchmarked to the Arizona average, with a ranking across 71 Arizona facilities. More hours mean more direct care. The national average is about 3.5 hrs; below 3.0 is a red flag.Rankings are based only on facilities in Arizona that report data for that category. Facilities without available data are excluded from the ranking.Click the rank badge to see the full State ranking.Click here to see the full State ranking.
This facility Arizona avg (4h 4m per day)
vs Arizona avg
-22%

6 of 6 metrics below state avg

Staff typeHours / Day / Residentvs state avg
Registered Nurse (RN) Info RNs hold the highest nursing license and can assess residents, interpret test results, and direct care plans. More RN hours per day often signals stronger clinical oversight and faster response to health changes. 21m per day ▼ 51% State avg: 43m per day · National avg: 41m per day
LPN / LVN Info Licensed Practical Nurses (LPNs) or Licensed Vocational Nurses (LVNs) deliver routine hands-on care — medication administration, wound dressing, and monitoring vital signs. They work under RN supervision and make up a large share of daily bedside care. 1h 1m per day ▼ 3% State avg: 1h 3m per day · National avg: 52m per day
Nurse Aide Info Certified Nurse Aides (CNAs) provide the most direct day-to-day assistance: bathing, dressing, feeding, and mobility. Nurse aide hours are typically the largest staffing category and directly affect residents' quality of life. 1h 40m per day ▼ 30% State avg: 2h 22m per day · National avg: 2h 21m per day
Weekend Total Nursing Info Combined nursing hours (RN + LPN + Nurse Aide) per resident per day on weekends. Staffing often drops on weekends — this figure reveals whether the facility maintains adequate coverage outside of weekday hours. 2h 45m per day ▼ 24% State avg: 3h 38m per day · National avg: 3h 26m per day
Physical Therapist Info Hours per resident per day provided by licensed Physical Therapists (PTs) or PT Assistants. PT services help residents recover mobility after injury or illness and are especially important for post-acute (short-stay) rehabilitation. 3m per day ▼ 50% State avg: 6m per day · National avg: 4m per day
Weekend RN Info Registered nurse hours specifically on weekends. Facilities sometimes reduce RN presence on Saturdays and Sundays — a low weekend RN figure compared to weekday hours can indicate reduced clinical oversight when most administrative staff are absent. 19m per day ▼ 39% State avg: 31m per day · National avg: 29m per day

Capacity and availability

This home usually has availability

Lower occupancy than the Arizona average: 72.7%
Occupancy rate
70.1% Rank #39 / 76Occupancy rate — State benchmarkedThis home is ranked 39th out of 76 homes in Arizona. Shows this facility's occupancy rate versus the Arizona average, with its Statewide rank out of 76. Higher occupancy signals strong local demand and financial stability.Rankings are based only on facilities in Arizona that report data for that category. Facilities without available data are excluded from the ranking.Click the rank badge to see the full State ranking.Click here to see the full State ranking.
Avg. Length of Stay
37 days
Bed community size
128-bed community
A larger shared setting that may offer more common spaces and organized community services.
Walk Score
Walk Score: 32 / 100
Somewhat walkable. A few nearby services may be reachable on foot, but most trips require transportation.

Contact Granite Creek Health and Rehabilitation

Staffing Data

Reporting period: July 1 – September 30, 2025 (Q3 2025). Source: CMS Payroll-Based Journal report.

Total staff 173
Employees 130
Contractors 43
Staff to resident ratio 1.99 : 1
10% more staff per resident than Arizona average
Arizona average ratio: 1.80 : 1 Arizona average ratio: 1.80 : 1See full Arizona ranking
Avg staff/day 41
Average shift 8.6 hours
0% compared with Arizona average
Arizona average: 8.5 hours Arizona average shift: 8.5 hoursSee full Arizona ranking
Total staff hours (quarter) 32,545

Nursing staff breakdown

Q3 2025 · Jul 1 – Sep 30 More info This data comes from the CMS Payroll-Based Journal report covering July 1 – September 30, 2025.
Registered Nurse

Manages medical care and health needs.

RN Staff Info 12 total: 10 full-time employees and 2 contractors. 12
Average shift length Info Average shift length. Calculated as total hours divided by days worked and average staff per day. 9.7 hours
Licensed Practical Nurse

Assists with medical care and medications.

LPN Staff Info 52 total: 29 full-time employees and 23 contractors. 52
Average shift length Info Average shift length. Calculated as total hours divided by days worked and average staff per day. 9.3 hours
Certified Nursing Assistant

Helps with daily care and mobility.

CNA Staff Info 69 total: 51 full-time employees and 18 contractors. 69
Average shift length Info Average shift length. Calculated as total hours divided by days worked and average staff per day. 9.5 hours

Contractor staffing

Q3 2025 · Jul 1 – Sep 30 More info This data comes from the CMS Payroll-Based Journal report covering July 1 – September 30, 2025.

Total hours from contractors

4.5%

1,463 contractor hours this quarter

Licensed Practical Nurse: 23 Certified Nursing Assistant: 18 Registered Nurse: 2

Staff by category

Q3 2025 · Jul 1 – Sep 30 More info This data comes from the CMS Payroll-Based Journal report covering July 1 – September 30, 2025.
Certified Nursing Assistant51186913,46092100%9.5
Licensed Practical Nurse2923527,62392100%9.3
Dental Services Staff9092,8839098%7.6
Registered Nurse102121,4427885%9.7
Speech Language Pathologist4041,1777784%6.3
Physical Therapy Assistant4049636773%7.4
Other Dietary Services Staff3037638795%6.6
Clinical Nurse Specialist5057186773%8
Nurse Practitioner1016708693%7.8
RN Director of Nursing2026237076%8.2
Physical Therapy Aide3035976470%7.6
Qualified Social Worker4045366470%7.3
Administrator1015286672%8
Respiratory Therapy Technician2023854448%7.4
Dietitian1011361718%8
Nurse Aide in Training1014255%8.5
69 Certified Nursing Assistant
% of Days 100%
52 Licensed Practical Nurse
% of Days 100%
9 Dental Services Staff
% of Days 98%
12 Registered Nurse
% of Days 85%
4 Speech Language Pathologist
% of Days 84%
4 Physical Therapy Assistant
% of Days 73%
3 Other Dietary Services Staff
% of Days 95%
5 Clinical Nurse Specialist
% of Days 73%
1 Nurse Practitioner
% of Days 93%
2 RN Director of Nursing
% of Days 76%
3 Physical Therapy Aide
% of Days 70%
4 Qualified Social Worker
% of Days 70%
1 Administrator
% of Days 72%
2 Respiratory Therapy Technician
% of Days 48%
1 Dietitian
% of Days 18%
1 Nurse Aide in Training
% of Days 5%

Penalties and fines

Federal penalties imposed by CMS for regulatory violations, including civil money penalties (fines) and denials of payment for new Medicare/Medicaid admissions.

Source: CMS Penalties Database

No penalties in the past 3 years

No civil money penalties or payment denials were reported in the last 3 years.

Quality of care over time

These measures show how residents usually do over time at this home, based on health outcomes and preventive care.

High-risk clinical events score Info A composite score based on pressure ulcers, falls with injury, weight loss, walking ability decline, and activities of daily living decline. 8.3
9% worse than Arizona average

Arizona average: 7.6

Functional decline score Info A composite score based on activities of daily living decline, walking ability decline, and incontinence. 13.5
16% better than Arizona average

Arizona average: 16.1

Long-stay resident measures
Significantly above average Info CMS star rating based on long-stay quality measure performance. 5 stars = significantly above average, 1 star = significantly below average.
Need for Help with Daily Activities Increased Info Percent of long-stay residents whose need for help with daily activities has increased 11.4%
In line with Arizona average

Arizona average: 11.2%

Walking Ability Worsened Info Percent of long-stay residents whose ability to move independently worsened 12.2%
23% better than Arizona average

Arizona average: 15.8%

Low Risk Residents with Bowel/Bladder Incontinence Info Percent of low risk long-stay residents who lose control of their bowels or bladder 16.8%
19% better than Arizona average

Arizona average: 20.8%

Falls with Major Injury Info Percent of long-stay residents experiencing one or more falls with major injury 3.7%
76% worse than Arizona average

Arizona average: 2.1%

High Risk Residents with Pressure Ulcers Info Percent of long-stay high risk residents with pressure ulcers 3.8%
26% better than Arizona average

Arizona average: 5.1%

Urinary Tract Infection Info Percent of long-stay residents with a urinary tract infection 0.5%
65% better than Arizona average

Arizona average: 1.3%

Lost Too Much Weight Info Percent of long-stay residents who lose too much weight 10.4%
91% worse than Arizona average

Arizona average: 5.4%

Depressive Symptoms Info Percent of long-stay residents who have depressive symptoms 13.7%
205% worse than Arizona average

Arizona average: 4.5%

Antipsychotic Use Info Percent of long-stay residents who received an antipsychotic medication 11.7%
14% worse than Arizona average

Arizona average: 10.3%

Pneumococcal Vaccine Info Percent of long-stay residents assessed and appropriately given the pneumococcal vaccine 97.2%
In line with Arizona average

Arizona average: 97.2%

Influenza Vaccine Info Percent of long-stay residents assessed and appropriately given the seasonal influenza vaccine 95.0%
In line with Arizona average

Arizona average: 94.6%

Short-stay resident measures
Average Info CMS star rating based on short-stay quality measure performance. 5 stars = much above average, 1 star = much below average.
Pneumococcal Vaccine Info Percent of short-stay residents assessed and appropriately given the pneumococcal vaccine 82.7%
10% worse than Arizona average

Arizona average: 91.5%

Antipsychotic medication increase Info Percent of short-stay residents who newly received an antipsychotic medication 1.1%
10% worse than Arizona average

Arizona average: 1.0%

Influenza Vaccine Info Percent of short-stay residents assessed and appropriately given the seasonal influenza vaccine 73.5%
16% worse than Arizona average

Arizona average: 87.3%

Re-hospitalized after SNF stay Info Percentage of short-stay residents who were re-hospitalized after their nursing home admission. 33.6%
37% worse than Arizona average

Arizona average: 24.6%

Emergency department visits Info Percentage of short-stay residents who had an outpatient emergency department visit. 13.0%
21% worse than Arizona average

Arizona average: 10.7%

Falls with major injury Info Percentage of SNF residents who experience falls with major injury during their stay. 0.0%
100% better than Arizona average

Arizona average: 0.8%

Ability to care for self at discharge Info Percentage of residents at or above expected ability to care for themselves at discharge. 66.4%
24% better than Arizona average

Arizona average: 53.7%

Successful return to home or community Info Rate of successful return to home or community from a skilled nursing facility. 54.3%
7% better than Arizona average

Arizona average: 50.6%

Breakdown by payment type

Medicare

35% of new residents, usually for short-term rehab.

Typical stay 15 days

Private pay

57% of new residents, often for short stays.

Typical stay 17 days

Medicaid

9% of new residents, often for long-term daily care.

Typical stay 7 - 8 months

Facility Characteristics

Source: CMS Long-Term Care Facility Characteristics (Data as of Jan 2026)

Total residents 87
Medicare
25
28.7% of residents
Medicaid
57
65.5% of residents
Private pay or other
5
5.7% of residents
Programs & Services
Residents Group

Residents meet regularly to discuss policies, care quality, and activities

Active Resident Council

Organized group of residents that meets regularly to discuss facility policies, quality of life, and activities.

Finances and operations

Based on CMS SNF Cost Report for fiscal year ending in 12/2023.

For-profit
Operated by a business corporation.
Net patient revenue Info Net patient revenue — what the home actually collects for resident care, after contractual allowances, bad debt and discounts are subtracted from its gross charges (CMS cost report, Worksheet G-3). It covers resident care only; money the home earns from other sources is shown separately as "Other income."
$13.1M
Net patient income Info Net patient income: net patient revenue minus the home's total operating expenses. A positive figure means it earns more from resident care than it spends to deliver it; a negative figure means the opposite. It excludes non-operating "other income."
$668.2K
For-profit Operated by a business corporation.
Net patient revenue Info Net patient revenue — what the home actually collects for resident care, after contractual allowances, bad debt and discounts are subtracted from its gross charges (CMS cost report, Worksheet G-3). It covers resident care only; money the home earns from other sources is shown separately as "Other income."
$13.1M Rank #50 / 79Revenue — State benchmarkedThis home is ranked 50th out of 79 homes in Arizona. Shows this facility's annual revenue compared to the Arizona average. Higher revenue generally means more resources for staffing and capital — read alongside Payroll %.Rankings are based only on facilities in Arizona that report data for that category. Facilities without available data are excluded from the ranking.Click the rank badge to see the full State ranking.Click here to see the full State ranking.
Net patient income Info Net patient income: net patient revenue minus the home's total operating expenses. A positive figure means it earns more from resident care than it spends to deliver it; a negative figure means the opposite. It excludes non-operating "other income."
$668.2K
Other income Info Money the home earns outside of resident care — such as investments, grants, rentals and other non-operating sources (CMS cost report, Worksheet G-3). It is tracked separately from net patient revenue: it is not part of that figure, and it is not included in net patient income.
$4.1K
Payroll costs Info Staff salaries plus wage-related costs — benefits such as payroll taxes, health insurance and retirement — from the home's own accounting records (CMS cost report, Worksheet A). Contract or agency labor is counted separately, under other operating costs. Rank #32 / 79Payroll — State benchmarkedThis home is ranked 32nd out of 79 homes in Arizona. Shows total annual staff payroll benchmarked to the Arizona average. Higher payroll investment relative to peers often signals better staffing and less reliance on cheaper contract labor.Rankings are based only on facilities in Arizona that report data for that category. Facilities without available data are excluded from the ranking.Click the rank badge to see the full State ranking.Click here to see the full State ranking.
$6.5M 49.2% of net patient revenue Info Payroll as a share of revenue: staff salaries and wage-related benefits divided by net patient revenue. A higher figure means more of each revenue dollar goes to staff pay. Rank #9 / 79Payroll % — State benchmarkedThis home is ranked 9th out of 79 homes in Arizona. Shows payroll as a percentage of revenue versus the Arizona average. Well-run Arizona facilities typically land around 58–71% — the top third Statewide. Below 25% may signal understaffing or heavy agency use — read with Staffing ratings.Rankings are based only on facilities in Arizona that report data for that category. Facilities without available data are excluded from the ranking.Click the rank badge to see the full State ranking.Click here to see the full State ranking.
Other operating costs Info Everything it costs to run the home apart from payroll — food, utilities, supplies, maintenance, contract labor and administration. Calculated as total operating expense minus payroll (staff salaries and wage-related benefits).
$6.0M
Total costs Info The home's total operating expense for the year — all the costs of running it, salaries included (CMS cost report, Worksheet G-3).
$12.5M

What does this home offer?

Housing options icon

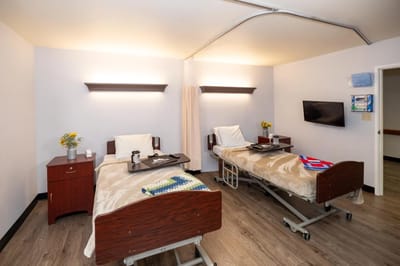
Housing Options: Private / Semi-Private Rooms

Building type icon
Building type icon

Building Type: Single-story

On-site medical care and health services icon

On-site Medical Care and Health Services

Rehabilitative support icon

Rehabilitative Support

Social and recreational activities icon

Social and Recreational Activities

Who this home usually serves

TYPE OF STAY

Mix of rehab and long-term care

This home supports both short-term rehab and long-term care, with residents staying for a wide range of durations.

Most new residents arrive under private pay (57% of admissions), and a typical private pay stay runs around 17 days.

Admissions
910 total

Coverage residents most often arrive under.

Medicare 35%
Private pay 57%
Medicaid 9%
Discharges
892 total

Coverage residents most often leave under.

Medicare 31%
Private pay 59%
Medicaid 10%

Places of interest near Granite Creek Health and Rehabilitation

Address 2.1 miles from city center Info Estimated distance in miles from Prescott's city center to Granite Creek Health and Rehabilitation's address, calculated via Google Maps.

Calculate Travel Distance to Granite Creek Health and Rehabilitation

Add your location

Address

Compare Nursing Homes around Prescott

The information below is reported by the Arizona Department of Health Services, Bureau of Long Term Care Licensing.

2 facilities compared · CMS & AZ Dept. of Health data

Granite Creek Health and Rehabilitation
NH
Prescott128
70.1%
Facility 70.1%
AZ AVG 72.7%
Rank #39 / 76
-4%
3.17
Facility 3.17
AZ AVG 4.06
Rank #63 / 71
-31%-22%
$0
Facility $0
AZ AVG $31.7k
Rank #1 / 75
-
38
Facility 38
AZ AVG 23.2
Rank #63 / 75
3.5
Facility 3.5
AZ AVG 3.8
Rank #35 / 75
-99- 32 Tamara Sturdevant
$13.1M
Facility $13.1M
AZ AVG $14.7M
Rank #50 / 79
$6.5M
Facility $6.5M
AZ AVG $6.4M
Rank #32 / 79
49.2%
Facility 49.2%
AZ AVG 48.1%
Rank #9 / 79
35131
Mountain View Manor
NH
RC
Prescott116
54.2%
Facility 54.2%
AZ AVG 72.7%
Rank #59 / 76
-25%- -51%-
$0
Facility $0
AZ AVG $31.7k
Rank #1 / 75
-
46
Facility 46
AZ AVG 23.2
Rank #69 / 75
7.7
Facility 7.7
AZ AVG 3.8
Rank #71 / 75
149- 52 The Circle B Trust
$6.1M
Facility $6.1M
AZ AVG $14.7M
Rank #64 / 79
$3.5M
Facility $3.5M
AZ AVG $6.4M
Rank #74 / 79
57.7%
Facility 57.7%
AZ AVG 48.1%
Rank #64 / 79
35114

Financial Assistance for
Nursing Home in Arizona

Granite Creek Health and Rehabilitation is located in Prescott, Arizona.
Here are the financial assistance programs available to residents in Arizona.

Get Financial aid guidance

Arizona Long Term Care System

ALTCS

Age 65+ or disabled
General Arizona resident, Medicaid-eligible, nursing home-level care need.
Income Limits (2025) ~$2,829/month 300% FBR, individual
Asset Limits $2,000 (individual), $3,000 (couple).
AZ

Covers tribal members; rural outreach.

Benefits
In-home care (6-8 hours/day) Assisted living Nursing home care Medical services Transportation (10 trips/month)

Non-Medical Home and Community Based Services

AZ DES Non-Medical HCBS

Age 60+
General Arizona resident, at risk of institutionalization.
Income Limits ~$2,000/month individual, varies
Asset Limits $10,000 individual
AZ

Limited funding; waitlists common.

Benefits
Homemaker services (3-5 hours/week) Respite care (up to 10 days/year) Adult day care (~$60/day)

Weatherization Assistance Program (WAP)

AZ WAP

Age 60+ priority
General Arizona resident, own/rent home, low-income.
Income Limits (2025) ~$2,510/month 200% of poverty level, individual
Asset Limits Not applicable; income-focused.
AZ

High demand in rural desert areas; limited annual funds.

Benefits
Insulation Weather stripping HVAC repairs (avg. $500-$1,000/year savings)

Section 202 Supportive Housing for the Elderly

AZ Section 202

Age 62+
General Arizona resident, very low income, able to live independently with support.
Income Limits (2025) ~$1,645/month 50% of area median income, individual, varies by county
Asset Limits $10,000 individual, excludes home if owned
AZ

Limited units; high demand in metro areas like Phoenix.

Benefits
Subsidized rent (30% of income, e.g., $300-$500/month) On-site services (housekeeping, transportation, ~$200/month value)

Arizona CARES Program

AZ CARES

Age
General Caregivers of Arizona residents 60+ needing help with 3+ daily activities; no caregiver age limit.
Income Limits No strict limit; cost-sharing above ~$2,500/month threshold.
Asset Limits Not applicable; need-based.
AZ

Focus on rural access; complements ALTCS respite.

Benefits
Respite care (up to 10 days/year) Counseling (4-6 sessions/year) Training (2-3 workshops/year) Supplies (~$200/year)

AZ DES Non-Medical Home and Community Based Services (HCBS)

AZ DES Non-Medical HCBS

Age 60+ or disabled
General Arizona resident, need assistance with daily activities, not eligible for Medicaid/ALTCS.
Income Limits Above Medicaid threshold but low-income ~$1,500-$2,500/month, varies by region
Asset Limits Not specified; income-driven eligibility.
AZ

Targets those ineligible for ALTCS; prioritizes rural and tribal areas.

Benefits
Homemaker services (3-5 hours/week) Personal care (limited hours) Respite care (up to 10 days/year) Transportation (~5 trips/month)

Frequently Asked Questions about Granite Creek Health and Rehabilitation

Is Granite Creek Health and Rehabilitation in a walkable area?

Granite Creek Health and Rehabilitation has a walk score of 32. Somewhat walkable. A few nearby services may be reachable on foot, but most trips require transportation.

What is the occupancy rate at Granite Creek Health and Rehabilitation?

Granite Creek Health and Rehabilitation's occupancy is 70.1%.

What is the best email address for Granite Creek Health and Rehabilitation?

The team at Granite Creek Health and Rehabilitation can be reached at contact-GraniteCreek@ensignservices.net.

Does Granite Creek Health and Rehabilitation operate as a for-profit or non-profit?

Granite Creek Health and Rehabilitation is registered as a for-profit.

Are there photos of Granite Creek Health and Rehabilitation?

Yes — there are 7 photos of Granite Creek Health and Rehabilitation in the photo gallery on this page.

What is the address of Granite Creek Health and Rehabilitation?

Granite Creek Health and Rehabilitation is located at 1045 Scott Dr, Prescott, AZ 86301.

What is the phone number of Granite Creek Health and Rehabilitation?

(928) 778-9603 will put you in contact with the team at Granite Creek Health and Rehabilitation.

Guides for Better Senior Living

Care Cost Calculator: See Prices in Your Area

Nursing Home Data Explorer

Don’t Wait Too Long: 7 Red Flag Signs Your Parent Needs Assisted Living Now

The True Cost of Assisted Living in 2025 – And How Families Are Paying For It

Understanding Senior Living Costs: Pricing Models, Discounts & Financial Assistance