Total health inspections
4
Florida average 4.3
Last Health inspection on Jul 2025

We arrange tours, appointments, and even moving support so you don’t have to
Thank you for your interest!
Our team will be in touch shortly to help with next steps.

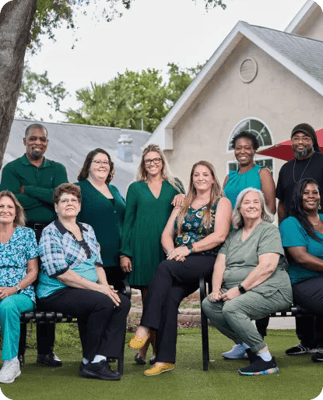
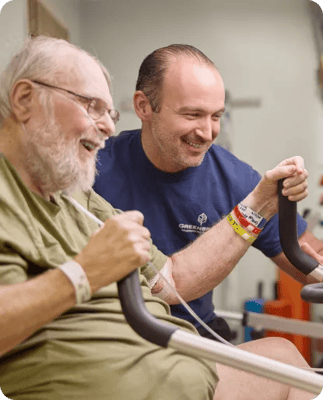
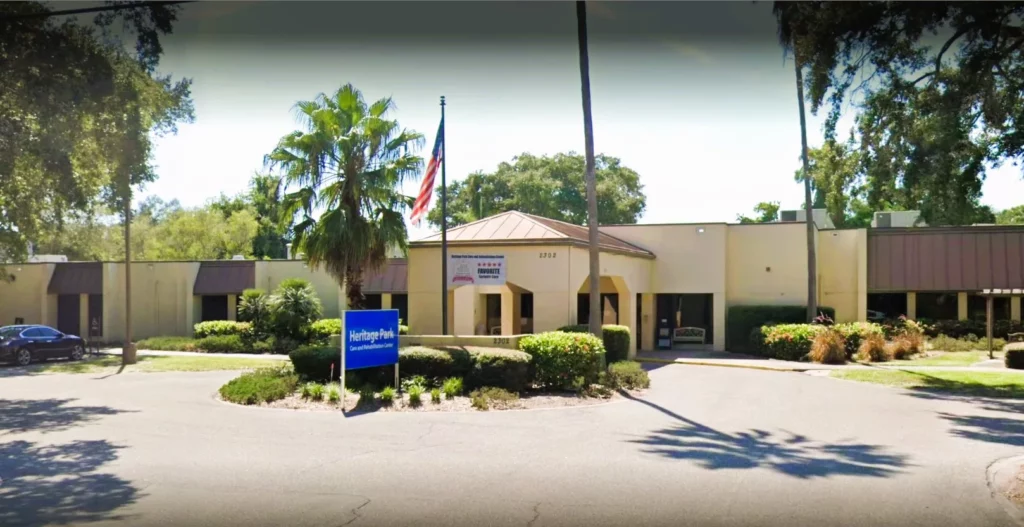
Greenbriar Rehabilitation and Nursing Center offers reliable nursing home care in Bradenton, Florida. Offering a comprehensive range of services, from skilled nursing to rehabilitation therapies, Greenbriar ensures seniors receive top-notch care. Their commitment to seniors’ well-being extends beyond medical care, encompassing personal counseling, case management, and engaging activity programs. Residents benefit from physical, occupational, orthopedic, and neurological therapies, empowering them to thrive. Greenbriar’s diverse specialties and credible care create a sense of security for both seniors and their families.
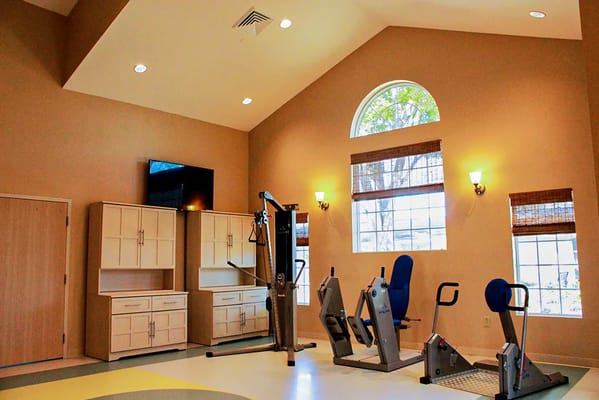
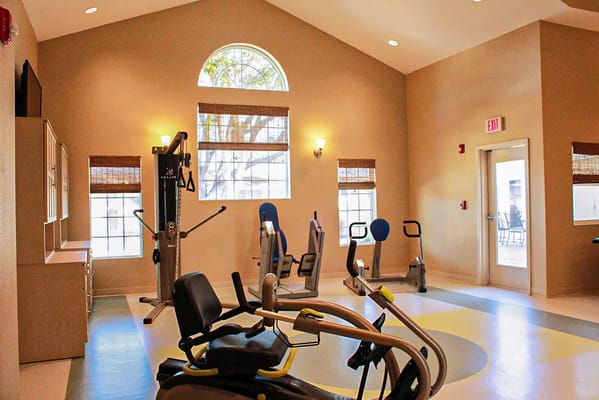
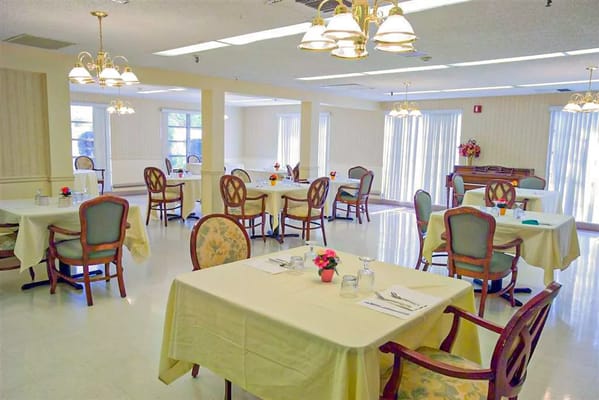
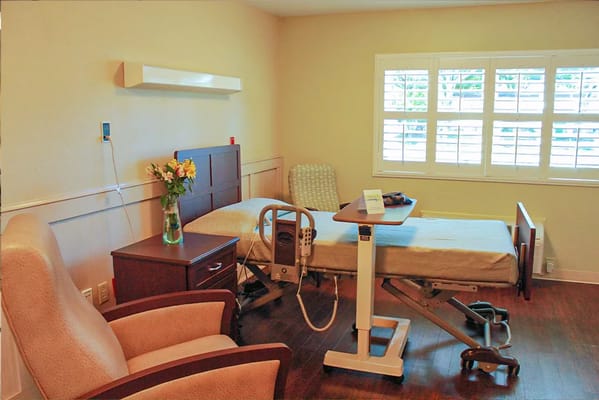
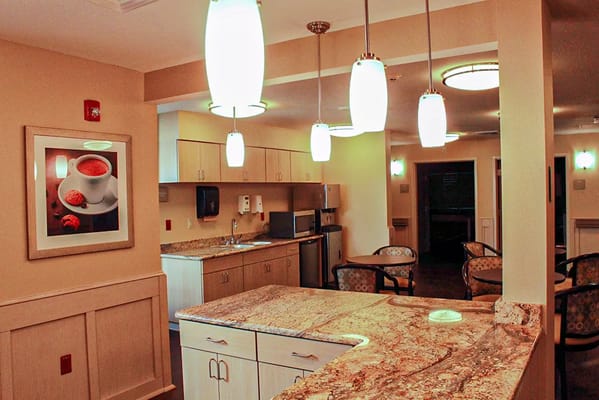
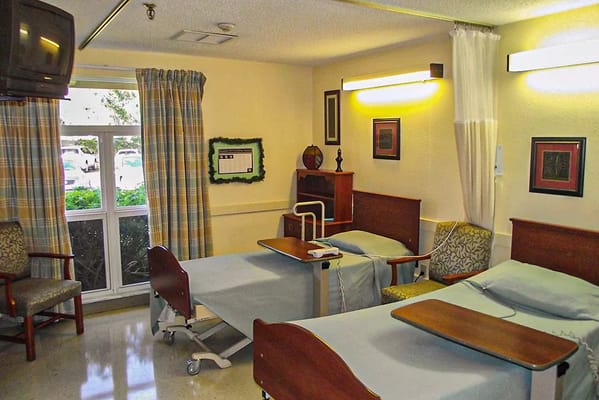
In terms of amenities, Greenbriar excels, offering private and semi-private rooms, serene courtyard spaces, and a variety of menu choices. The convenience continues with on-site transportation, beauty and barber services, bedside and restroom emergency call systems, Wi-Fi, in-room TVs and phones, and engaging social activities like games, trivia, and arts and crafts. They go the extra mile with telehealth consultations, family conferencing, and video chats, ensuring residents stay connected and cared for in every way.
Sydney Morrow is the Licensed Nursing Home Administrator at Greenbriar Rehabilitation and Nursing Center. With over 4 years of experience in long-term care and skilled nursing facilities nationwide, Sydney is passionate about delivering quality care inspired by personal family experience. Sydney is dedicated to ensuring excellent care and positive outcomes for all residents.
May offer a more intimate, personalized care environment.
Occupancy is moderate, suggesting balanced demand.
Residents typically stay for brief periods, with frequent admissions and discharges throughout the year.
28% of new residents, usually for short-term rehab.
64% of new residents, often for short stays.
7% of new residents, often for long-term daily care.
Florida average 4.3
Last Health inspection on Jul 2025
Florida average 19.7
Florida average 4.48
Health citations are formal notices following inspections when they fail to comply with safety and care standards.
16 of 20 citations resulted from standard inspections; 3 of 20 resulted from complaint investigations; and 1 of 20 came from combined inspections (standard and complaint).
Florida average: 0.8
Florida average: 0.4
Data sourced from CMS Health Deficiencies reports. Citation severity codes range from A (least serious) to L (most serious). Immediate Jeopardy (J-L) citations indicate situations where the facility's noncompliance has placed residents at risk of death or serious harm.
Nursing Home Licensed facility providing 24/7 skilled nursing care for residents with complex, ongoing medical needs. Staffed by RNs, LPNs, and CNAs. Inspected and star-rated annually by CMS. Accepts Medicare (short-term rehab) and Medicaid (long-term care).
Assisted Living A licensed, long-term care setting for seniors or individuals with disabilities who need help with daily activities — like bathing, dressing, and medication management — but not 24-hour skilled nursing. Offers housing, meals, and around-the-clock support while aiming to maximize resident independence.
![]() 1.3 miles from city center — 1.17 miles to nearest hospital (Manatee Memorial Hospital)
1.3 miles from city center — 1.17 miles to nearest hospital (Manatee Memorial Hospital)
Add your location
This data corresponds to Q2 2025 and is based on CMS Payroll-Based Journal.
Florida average ratio: 1.52:1
Florida average: 7.9 hours
Manages medical care and health needs.
This role is partially covered by contractors.
Assists with medical care and medications.
This role is partially covered by contractors.
Helps with daily care and mobility.
This role is partially covered by contractors.
Total hours from contractors
160 contractor hours this quarter
| Certified Nursing Assistant | 46 | 2 | 48 | 16,731 | 91 | 100% | 9.6 |
| Licensed Practical Nurse | 21 | 6 | 27 | 5,037 | 91 | 100% | 9.9 |
| Registered Nurse | 16 | 2 | 18 | 2,581 | 90 | 99% | 9 |
| Respiratory Therapy Technician | 4 | 0 | 4 | 936 | 72 | 79% | 7.3 |
| RN Director of Nursing | 2 | 0 | 2 | 915 | 85 | 93% | 9.3 |
| Physical Therapy Aide | 2 | 0 | 2 | 669 | 77 | 85% | 7.1 |
| Speech Language Pathologist | 2 | 0 | 2 | 649 | 65 | 71% | 6.4 |
| Clinical Nurse Specialist | 2 | 0 | 2 | 614 | 62 | 68% | 9 |
| Nurse Practitioner | 1 | 0 | 1 | 520 | 66 | 73% | 7.9 |
| Administrator | 1 | 0 | 1 | 512 | 64 | 70% | 8 |
| Dietitian | 1 | 0 | 1 | 504 | 63 | 69% | 8 |
| Physical Therapy Assistant | 1 | 0 | 1 | 498 | 63 | 69% | 7.9 |
| Qualified Social Worker | 1 | 0 | 1 | 469 | 62 | 68% | 7.6 |
| Mental Health Service Worker | 1 | 0 | 1 | 458 | 61 | 67% | 7.5 |
| Medical Director | 0 | 2 | 2 | 45 | 28 | 31% | 1.5 |
| Dental Services Staff | 1 | 0 | 1 | 24 | 3 | 3% | 8 |
Source: CMS Long-Term Care Facility Characteristics (Data as of Jan 2026)
Residents meet regularly to discuss policies, care quality, and activities
Organized group of residents that meets regularly to discuss facility policies, quality of life, and activities.
Data sourced from CMS Long-Term Care Facility Characteristics quarterly report. Payer mix reflects the current resident census by primary payment source.
These measures show how residents usually do over time at this home, based on health outcomes and preventive care.
Florida average: 7.4
Florida average: 12.4
Florida average: 10.5%
Florida average: 12.9%
Florida average: 13.5%
Florida average: 2.6%
Florida average: 5.4%
Florida average: 0.9%
Florida average: 6.0%
Florida average: 3.3%
Florida average: 8.0%
Florida average: 97.7%
Florida average: 99.2%
Florida average: 2.10
Florida average: 1.18
Florida average: 94.0%
Florida average: 1.5%
Florida average: 94.7%
Florida average: 26.2%
Florida average: 9.3%
Florida average: 0.8%
Florida average: 53.7%
Florida average: 50.6%
Quality measures are calculated from Minimum Data Set (MDS) assessments. For most measures, lower percentages indicate better care quality.
Federal penalties imposed by CMS for regulatory violations, including civil money penalties (fines) and denials of payment for new Medicare/Medicaid admissions.
Source: CMS Penalties Database (Data as of Jan 2026)
Florida average: $72K
Florida average: 2.6
Florida average: 0.1
Penalties are imposed by CMS for violations of federal nursing home regulations.
Last updated: Jan 2026
Historical financial and operational data for Greenbriar Rehabilitation and Nursing Center based on CMS SNF Cost Reports.
Loading trend charts...
Care Cost Calculator: See Prices in Your Area
Nursing Home Data Explorer
Don’t Wait Too Long: 7 Red Flag Signs Your Parent Needs Assisted Living Now
The True Cost of Assisted Living in 2025 – And How Families Are Paying For It
Understanding Senior Living Costs: Pricing Models, Discounts & Financial Assistance

Touring a community? Use this expert-backed checklist to stay organized, ask the right questions, and find the perfect fit.
We'll send you a PDF version of the touring checklist.