Greenbriar Rehabilitation and Nursing Center
Nursing Home & Respite Care · Bradenton, FL
CMS overall rating Info CMS (the Centers for Medicare & Medicaid Services) is the federal agency that rates nursing home quality. Its Overall Rating runs from 1 to 5 stars, combining health inspections, staffing, and quality measures, with inspections weighted most heavily.

Greenbriar Rehabilitation and Nursing Center

Nursing Home & Respite Care · Bradenton, FL
CMS overall rating Info CMS (the Centers for Medicare & Medicaid Services) is the federal agency that rates nursing home quality. Its Overall Rating runs from 1 to 5 stars, combining health inspections, staffing, and quality measures, with inspections weighted most heavily.
Calculator: See prices in your area
Greenbriar Rehabilitation and Nursing Center accepts Medicare, Medicaid, and private pay.

Overview of Greenbriar Rehabilitation and Nursing Center

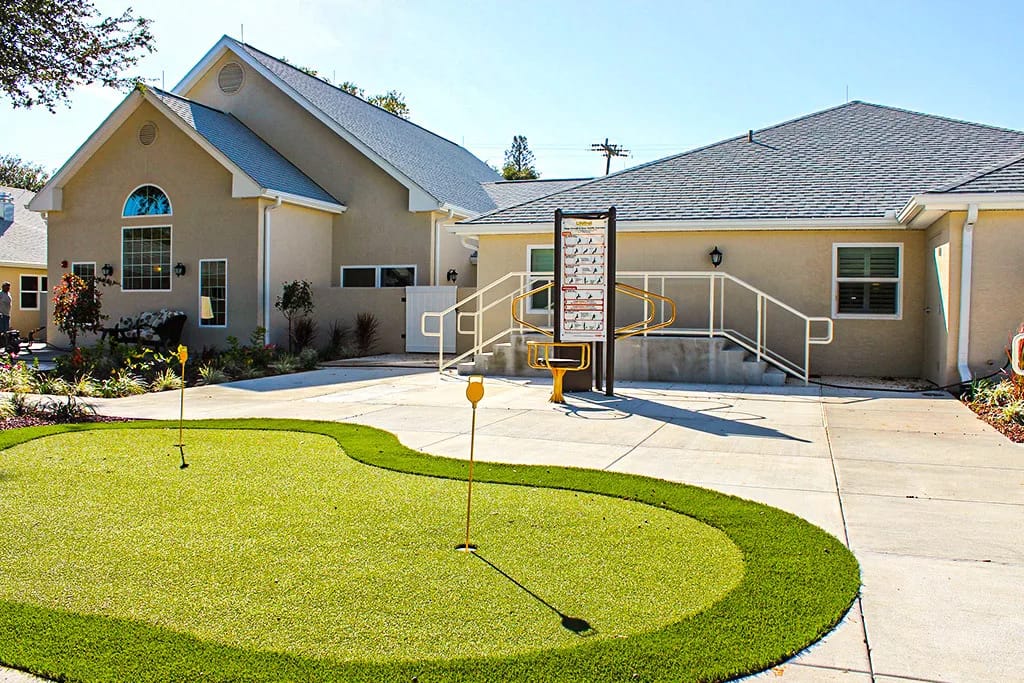
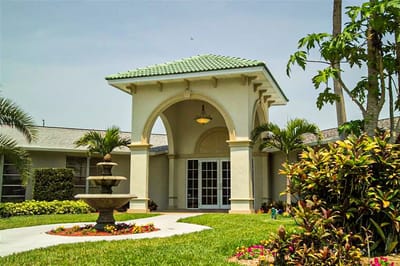
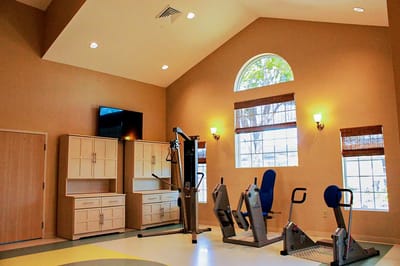
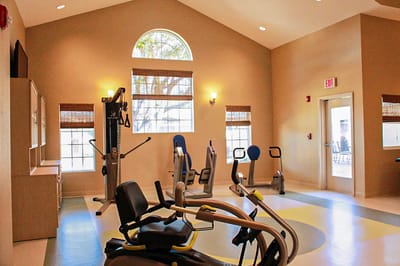
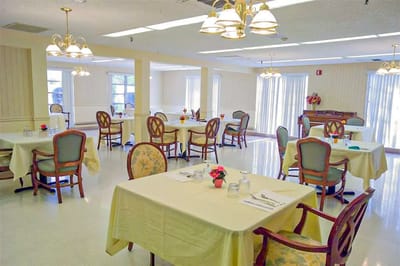
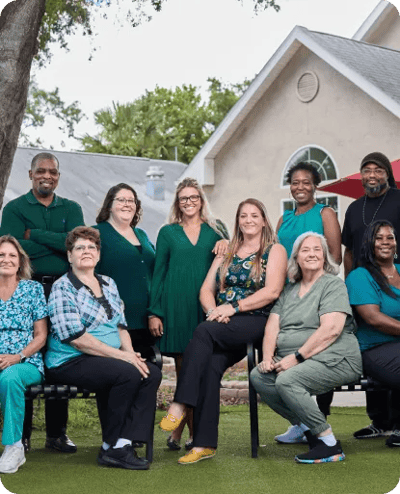
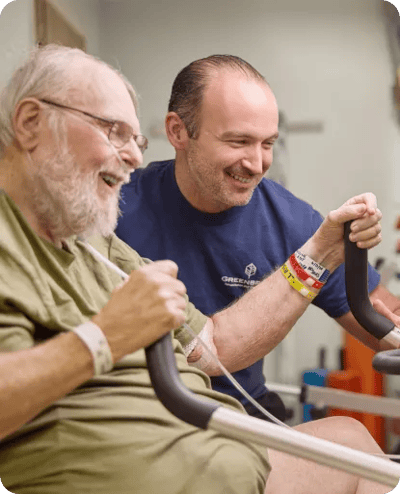
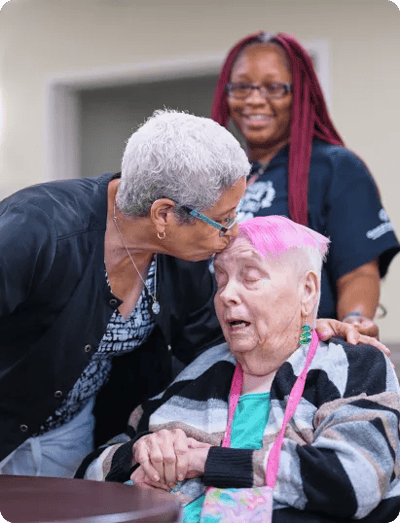
Greenbriar Rehabilitation and Nursing Center offers reliable nursing home care in Bradenton, Florida. Offering a comprehensive range of services, from skilled nursing to rehabilitation therapies, Greenbriar ensures seniors receive top-notch care. Their commitment to seniors’ well-being extends beyond medical care, encompassing personal counseling, case management, and engaging activity programs. Residents benefit from physical, occupational, orthopedic, and neurological therapies, empowering them to thrive. Greenbriar’s diverse specialties and credible care create a sense of security for both seniors and their families.
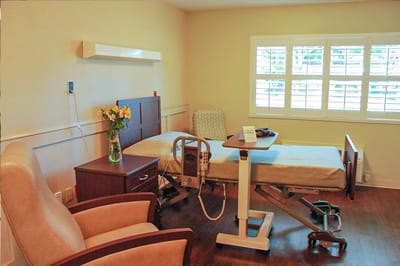
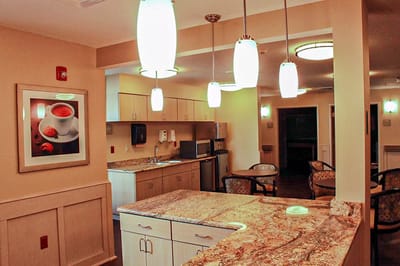
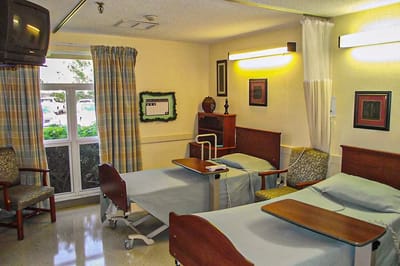
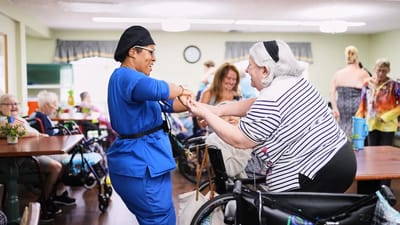
In terms of amenities, Greenbriar excels, offering private and semi-private rooms, serene courtyard spaces, and a variety of menu choices. The convenience continues with on-site transportation, beauty and barber services, bedside and restroom emergency call systems, Wi-Fi, in-room TVs and phones, and engaging social activities like games, trivia, and arts and crafts. They go the extra mile with telehealth consultations, family conferencing, and video chats, ensuring residents stay connected and cared for in every way.

Quality ratings

Measured by Centers for Medicare & Medicaid Services (CMS)

Overall rating Info The Overall CMS Rating combines results from health inspections, staffing levels and quality measures. Health inspections carry the most weight. Staffing and quality scores can increase or decrease the final rating based on performance compared to state and national standards.
▼ 5.5% Below FL avg. ▼ 5.5% Below FL avg.FL average: 3.2Click the badge to see the full State ranking.Click here to see the full State ranking.
Health Inspection Info Based on the results of the facility's three most recent standard inspections and any complaint investigations. CMS reviews the number, scope, and severity of deficiencies, with more recent findings weighted more heavily.
▲ 6.7% Above FL avg. ▲ 6.7% Above FL avg.FL average: 2.8Click the badge to see the full State ranking.Click here to see the full State ranking.
Staffing Info Measures average nursing staff hours per resident per day, including Registered Nurses (RNs) and total nursing staff. Ratings are adjusted based on the level of care residents require and are compared to state and national benchmarks.
▼ 11.3% Below FL avg. ▼ 11.3% Below FL avg.FL average: 3.4Click the badge to see the full State ranking.Click here to see the full State ranking.
Quality Measures Info Based on clinical and physical health indicators reported to CMS, such as hospital readmissions, falls, pressure ulcers, and improvements in mobility. These measures reflect how well residents' health needs are being managed.
▼ 1.4% Below FL avg. ▼ 1.4% Below FL avg.FL average: 4.1Click the badge to see the full State ranking.Click here to see the full State ranking.

Staffing hours breakdown

Info Daily nursing hours per resident by staff type, reported to CMS. Higher is generally better — compare this facility to state and national averages to see where staffing stands.

Hours per resident per day — compared to Florida state averages

Total nursing care / resident Info This home is ranked 145th out of 253 homes in Florida for nurse hours. Total adjusted nursing hours per resident per day, combining RN, LPN, and aide time. CMS adjusts this for case-mix so facilities can be fairly compared.
3h 50m per day
Rank #145 / 253Nurse hours — State benchmarkedThis home is ranked 145th out of 253 homes in Florida. Shows adjusted nurse hours per resident per day benchmarked to the Florida average, with a ranking across 253 Florida facilities. More hours mean more direct care. The national average is about 3.5 hrs; below 3.0 is a red flag.Rankings are based only on facilities in Florida that report data for that category. Facilities without available data are excluded from the ranking.Click the rank badge to see the full State ranking.Click here to see the full State ranking.
This facility Florida avg (4h 2m per day)
vs Florida avg
-5%

2 of 6 metrics below state avg

Standout metric Physical Therapist is +84% above state avg
Staff type Hours / Day / Resident vs state avg
Registered Nurse (RN) Info RNs hold the highest nursing license and can assess residents, interpret test results, and direct care plans. More RN hours per day often signals stronger clinical oversight and faster response to health changes. 37m per day ▼ 17% State avg: 44m per day · National avg: 41m per day
LPN / LVN Info Licensed Practical Nurses (LPNs) or Licensed Vocational Nurses (LVNs) deliver routine hands-on care — medication administration, wound dressing, and monitoring vital signs. They work under RN supervision and make up a large share of daily bedside care. 55m per day ▲ 18% State avg: 47m per day · National avg: 52m per day
Nurse Aide Info Certified Nurse Aides (CNAs) provide the most direct day-to-day assistance: bathing, dressing, feeding, and mobility. Nurse aide hours are typically the largest staffing category and directly affect residents' quality of life. 2h 23m per day ■ Avg State avg: 2h 20m per day · National avg: 2h 21m per day
Weekend Total Nursing Info Combined nursing hours (RN + LPN + Nurse Aide) per resident per day on weekends. Staffing often drops on weekends — this figure reveals whether the facility maintains adequate coverage outside of weekday hours. 3h 33m per day ■ Avg State avg: 3h 31m per day · National avg: 3h 26m per day
Physical Therapist Info Hours per resident per day provided by licensed Physical Therapists (PTs) or PT Assistants. PT services help residents recover mobility after injury or illness and are especially important for post-acute (short-stay) rehabilitation. 9m per day ▲ 84% State avg: 5m per day · National avg: 4m per day
Weekend RN Info Registered nurse hours specifically on weekends. Facilities sometimes reduce RN presence on Saturdays and Sundays — a low weekend RN figure compared to weekday hours can indicate reduced clinical oversight when most administrative staff are absent. 24m per day ▼ 25% State avg: 32m per day · National avg: 29m per day

Capacity and availability

This home usually has limited availability

Higher occupancy than the Florida average: 84.3%
Occupancy rate
94.1% Rank #43 / 258Occupancy rate — State benchmarkedThis home is ranked 43rd out of 258 homes in Florida. Shows this facility's occupancy rate versus the Florida average, with its Statewide rank out of 258. Higher occupancy signals strong local demand and financial stability.Rankings are based only on facilities in Florida that report data for that category. Facilities without available data are excluded from the ranking.Click the rank badge to see the full State ranking.Click here to see the full State ranking.
Avg. Length of Stay
72 days
Bed community size
79-bed community Rank #600 / 1074Bed count — State benchmarkedThis home is ranked 600th out of 1074 homes in Florida. Shows this facility's certified or reported bed count compared to other Florida facilities. Larger communities may offer more amenities, programs, and on-site services for residents and families.Rankings are based only on facilities in Florida that report data for that category. Facilities without available data are excluded from the ranking.Click the rank badge to see the full State ranking.Click here to see the full State ranking.
A larger shared setting that may offer more common spaces and organized community services.
Walk Score
Walk Score: 50 / 100 Rank #524 / 1486Walk Score — State benchmarkedThis home is ranked 524th out of 1486 homes in Florida. Shows how walkable this facility's neighborhood is compared to the average Walk Score across Florida facilities. Higher scores benefit residents, families, and staff.Rankings are based only on facilities in Florida that report data for that category. Facilities without available data are excluded from the ranking.Click the rank badge to see the full State ranking.Click here to see the full State ranking.
Moderately walkable. Some errands can be accomplished on foot, with a mix of nearby amenities.

Therapy & Rehabilitation

2 services
Rehabilitation Services
Short-Term Rehab

Staffing & Medical

1 service
24-Hour Staffing

Amenities & Lifestyle

Beautiful Private And Semi-Private Rooms
Lush Courtyard And Serene Surroundings
Onsite Transportation And Community Outings
Engaging And Varied Social Activities
Specific Programs24/7 Nursing Care, Patient Education, Physical and Occupational Therapy, Long-term Rehabilitation, Restorative Programs, Medical Management

Contact Greenbriar Rehabilitation and Nursing Center

Staffing Data

Reporting period: October 1 – December 31, 2025 (Q4 2025). Source: CMS Payroll-Based Journal report.

Total staff 124
Employees 109
Contractors 15
Staff to resident ratio 1.65 : 1
12% more staff per resident than Florida average
Florida average ratio: 1.47 : 1 Florida average ratio: 1.47 : 1See full Florida ranking
Avg staff/day 37
Average shift 8.7 hours
10% better than Florida average
Florida average: 7.9 hours Florida average shift: 7.9 hoursSee full Florida ranking
Total staff hours (quarter) 29,733

Nursing staff breakdown

Q4 2025 · Oct 1 – Dec 31 More info This data comes from the CMS Payroll-Based Journal report covering October 1 – December 31, 2025.
Registered Nurse

Manages medical care and health needs.

RN Staff Info 16 total: 14 full-time employees and 2 contractors. 16
Average shift length Info Average shift length. Calculated as total hours divided by days worked and average staff per day. 9.1 hours
Licensed Practical Nurse

Assists with medical care and medications.

LPN Staff Info 31 total: 22 full-time employees and 9 contractors. 31
Average shift length Info Average shift length. Calculated as total hours divided by days worked and average staff per day. 9.6 hours
Certified Nursing Assistant

Helps with daily care and mobility.

CNA Staff Info 49 total: 48 full-time employees and 1 contractor. 49
Average shift length Info Average shift length. Calculated as total hours divided by days worked and average staff per day. 9.1 hours

Contractor staffing

Q4 2025 · Oct 1 – Dec 31 More info This data comes from the CMS Payroll-Based Journal report covering October 1 – December 31, 2025.

Total hours from contractors

1.8%

545 contractor hours this quarter

Licensed Practical Nurse: 9 Registered Nurse: 2 Medical Director: 2 Certified Nursing Assistant: 1 Qualified Social Worker: 1

Staff by category

Q4 2025 · Oct 1 – Dec 31 More info This data comes from the CMS Payroll-Based Journal report covering October 1 – December 31, 2025.
Certified Nursing Assistant 48 1 49 15,324 92 100% 9.1
Licensed Practical Nurse 22 9 31 5,078 92 100% 9.6
Registered Nurse 14 2 16 2,721 92 100% 9.1
Respiratory Therapy Technician 4 0 4 986 76 83% 7.2
RN Director of Nursing 2 0 2 833 79 86% 8.6
Physical Therapy Aide 2 0 2 719 76 83% 7.4
Clinical Nurse Specialist 3 0 3 671 61 66% 9.3
Speech Language Pathologist 2 0 2 654 66 72% 6.4
Administrator 1 0 1 528 66 72% 8
Nurse Practitioner 1 0 1 528 66 72% 8
Dietitian 1 0 1 484 62 67% 7.8
Physical Therapy Assistant 2 0 2 470 60 65% 7.5
Qualified Social Worker 3 1 4 435 63 68% 5.3
Mental Health Service Worker 4 0 4 266 35 38% 7.6
Medical Director 0 2 2 38 21 23% 1.8
49 Certified Nursing Assistant
% of Days 100%
31 Licensed Practical Nurse
% of Days 100%
16 Registered Nurse
% of Days 100%
4 Respiratory Therapy Technician
% of Days 83%
2 RN Director of Nursing
% of Days 86%
2 Physical Therapy Aide
% of Days 83%
3 Clinical Nurse Specialist
% of Days 66%
2 Speech Language Pathologist
% of Days 72%
1 Administrator
% of Days 72%
1 Nurse Practitioner
% of Days 72%
1 Dietitian
% of Days 67%
2 Physical Therapy Assistant
% of Days 65%
4 Qualified Social Worker
% of Days 68%
4 Mental Health Service Worker
% of Days 38%
2 Medical Director
% of Days 23%

Penalties and fines

Includes penalties issued in 2024

Federal penalties imposed by CMS for regulatory violations, including civil money penalties (fines) and denials of payment for new Medicare/Medicaid admissions.

Source: CMS Penalties Database (Data as of Jan 2026)

Total fines amount $31K Rank #171 / 258Federal fines — State benchmarkedThis home is ranked 171st out of 258 homes in Florida. Shows this facility's cumulative CMS federal fine dollars versus the Florida average among facilities with fines, and where it ranks among 258 facilities in the pool. Lower total dollars mean a better rank.Rankings are based only on facilities in Florida that report data for that category. Facilities without available data are excluded from the ranking.Click the rank badge to see the full State ranking.Click here to see the full State ranking.
58% lower than Florida average

Florida average: $72K

Number of fines 3
14% more fines than Florida average

Florida average: 2.6

Payment Denials Info Serious action where Medicare and/or Medicaid temporarily stops payments for new residents until issues are fixed. 0
100% fewer payment denials than Florida average

Florida average: 0.1

Fines amount comparison
This facility $31K
Florida average $72K
Penalty History

Penalties are imposed by CMS for violations of federal nursing home regulations.

1 penalty in the past 3 years

Aug 20, 2024 · $9K

Civil Money Penalty Info Fines imposed for noncompliance, which can be assessed per day or per instance of violation. Aug 20, 2024
$9K

Last updated: Jan 2026

Quality of care over time

These measures show how residents usually do over time at this home, based on health outcomes and preventive care.

High-risk clinical events score Info A composite score based on pressure ulcers, falls with injury, weight loss, walking ability decline, and activities of daily living decline. 3.8
49% better than Florida average

Florida average: 7.4

Functional decline score Info A composite score based on activities of daily living decline, walking ability decline, and incontinence. 3.8
70% better than Florida average

Florida average: 12.4

Long-stay resident measures
Significantly above average Florida avg: 4.5 Info CMS star rating based on long-stay quality measure performance. 5 stars = significantly above average, 1 star = significantly below average.
Need for Help with Daily Activities Increased Info Percent of long-stay residents whose need for help with daily activities has increased 3.0%
72% better than Florida average

Florida average: 10.5%

Walking Ability Worsened Info Percent of long-stay residents whose ability to move independently worsened 6.5%
50% better than Florida average

Florida average: 12.9%

Low Risk Residents with Bowel/Bladder Incontinence Info Percent of low risk long-stay residents who lose control of their bowels or bladder 1.8%
87% better than Florida average

Florida average: 13.5%

Falls with Major Injury Info Percent of long-stay residents experiencing one or more falls with major injury 4.9%
83% worse than Florida average

Florida average: 2.6%

High Risk Residents with Pressure Ulcers Info Percent of long-stay high risk residents with pressure ulcers 1.6%
70% better than Florida average

Florida average: 5.4%

Urinary Tract Infection Info Percent of long-stay residents with a urinary tract infection 0.0%
100% better than Florida average

Florida average: 0.9%

Lost Too Much Weight Info Percent of long-stay residents who lose too much weight 2.9%
51% better than Florida average

Florida average: 6.0%

Depressive Symptoms Info Percent of long-stay residents who have depressive symptoms 24.4%
630% worse than Florida average

Florida average: 3.3%

Antipsychotic Use Info Percent of long-stay residents who received an antipsychotic medication 7.2%
11% better than Florida average

Florida average: 8.0%

Pneumococcal Vaccine Info Percent of long-stay residents assessed and appropriately given the pneumococcal vaccine 100.0%
In line with Florida average

Florida average: 97.7%

Influenza Vaccine Info Percent of long-stay residents assessed and appropriately given the seasonal influenza vaccine 100.0%
In line with Florida average

Florida average: 99.2%

Hospitalizations per 1,000 days Info Number of hospitalizations per 1,000 long-stay resident days. 2.16
In line with Florida average

Florida average: 2.10

ED visits per 1,000 days Info Number of outpatient emergency department visits per 1,000 long-stay resident days. 1.84
56% worse than Florida average

Florida average: 1.18

Short-stay resident measures
Below average Florida avg: 3.1 Info CMS star rating based on short-stay quality measure performance. 5 stars = much above average, 1 star = much below average.
Pneumococcal Vaccine Info Percent of short-stay residents assessed and appropriately given the pneumococcal vaccine 98.8%
5% better than Florida average

Florida average: 94.0%

Antipsychotic medication increase Info Percent of short-stay residents who newly received an antipsychotic medication 0.0%
100% better than Florida average

Florida average: 1.5%

Influenza Vaccine Info Percent of short-stay residents assessed and appropriately given the seasonal influenza vaccine 99.2%
5% better than Florida average

Florida average: 94.7%

Re-hospitalized after SNF stay Info Percentage of short-stay residents who were re-hospitalized after their nursing home admission. 37.7%
44% worse than Florida average

Florida average: 26.2%

Emergency department visits Info Percentage of short-stay residents who had an outpatient emergency department visit. 17.0%
83% worse than Florida average

Florida average: 9.3%

Falls with major injury Info Percentage of SNF residents who experience falls with major injury during their stay. 0.8%
In line with Florida average

Florida average: 0.8%

Ability to care for self at discharge Info Percentage of residents at or above expected ability to care for themselves at discharge. 44.1%
18% worse than Florida average

Florida average: 53.7%

Successful return to home or community Info Rate of successful return to home or community from a skilled nursing facility. 46.9%
7% worse than Florida average

Florida average: 50.6%

Breakdown by payment type

Medicare

28% of new residents, usually for short-term rehab.

Typical stay 1 months

Private pay

64% of new residents, often for short stays.

Typical stay 1 - 2 months

Medicaid

7% of new residents, often for long-term daily care.

Typical stay 1 - 2 years

Facility Characteristics

Source: CMS Long-Term Care Facility Characteristics (Data as of Jan 2026)

Total residents 75
Medicare
13
17.3% of residents
Medicaid
39
52% of residents
Private pay or other
23
30.7% of residents
Programs & Services
Residents Group

Residents meet regularly to discuss policies, care quality, and activities

Active Resident Council

Organized group of residents that meets regularly to discuss facility policies, quality of life, and activities.

Finances and operations

Based on CMS SNF Cost Report for fiscal year ending in 12/2023.

For-profit
Corporation
Net patient revenue Info Net patient revenue — what the home actually collects for resident care, after contractual allowances, bad debt and discounts are subtracted from its gross charges (CMS cost report, Worksheet G-3). It covers resident care only; money the home earns from other sources is shown separately as "Other income."
$9.4M
Net patient income Info Net patient income: net patient revenue minus the home's total operating expenses. A positive figure means it earns more from resident care than it spends to deliver it; a negative figure means the opposite. It excludes non-operating "other income."
-$646.5K
For-profit Corporation
Net patient revenue Info Net patient revenue — what the home actually collects for resident care, after contractual allowances, bad debt and discounts are subtracted from its gross charges (CMS cost report, Worksheet G-3). It covers resident care only; money the home earns from other sources is shown separately as "Other income."
$9.4M Rank #205 / 257Revenue — State benchmarkedThis home is ranked 205th out of 257 homes in Florida. Shows this facility's annual revenue compared to the Florida average. Higher revenue generally means more resources for staffing and capital — read alongside Payroll %.Rankings are based only on facilities in Florida that report data for that category. Facilities without available data are excluded from the ranking.Click the rank badge to see the full State ranking.Click here to see the full State ranking.
Net patient income Info Net patient income: net patient revenue minus the home's total operating expenses. A positive figure means it earns more from resident care than it spends to deliver it; a negative figure means the opposite. It excludes non-operating "other income."
-$646.5K
Other income Info Money the home earns outside of resident care — such as investments, grants, rentals and other non-operating sources (CMS cost report, Worksheet G-3). It is tracked separately from net patient revenue: it is not part of that figure, and it is not included in net patient income.
$1.3K
Payroll costs Info Staff salaries plus wage-related costs — benefits such as payroll taxes, health insurance and retirement — from the home's own accounting records (CMS cost report, Worksheet A). Contract or agency labor is counted separately, under other operating costs. Rank #218 / 257Payroll — State benchmarkedThis home is ranked 218th out of 257 homes in Florida. Shows total annual staff payroll benchmarked to the Florida average. Higher payroll investment relative to peers often signals better staffing and less reliance on cheaper contract labor.Rankings are based only on facilities in Florida that report data for that category. Facilities without available data are excluded from the ranking.Click the rank badge to see the full State ranking.Click here to see the full State ranking.
$4.5M 47.6% of net patient revenue Info Payroll as a share of revenue: staff salaries and wage-related benefits divided by net patient revenue. A higher figure means more of each revenue dollar goes to staff pay. Rank #134 / 257Payroll % — State benchmarkedThis home is ranked 134th out of 257 homes in Florida. Shows payroll as a percentage of revenue versus the Florida average. Well-run Florida facilities typically land around 49–56% — the top third Statewide. Below 25% may signal understaffing or heavy agency use — read with Staffing ratings.Rankings are based only on facilities in Florida that report data for that category. Facilities without available data are excluded from the ranking.Click the rank badge to see the full State ranking.Click here to see the full State ranking.
Other operating costs Info Everything it costs to run the home apart from payroll — food, utilities, supplies, maintenance, contract labor and administration. Calculated as total operating expense minus payroll (staff salaries and wage-related benefits).
$5.6M
Total costs Info The home's total operating expense for the year — all the costs of running it, salaries included (CMS cost report, Worksheet G-3).
$10.0M

Who this home usually serves

TYPE OF STAY

Primarily short stays

Residents typically stay for brief periods, with frequent admissions and discharges throughout the year.

Most new residents arrive under private pay (64% of admissions), and a typical private pay stay runs around 1 - 2 months.

Admissions
379 total

Coverage residents most often arrive under.

Medicare 28%
Private pay 64%
Medicaid 7%
Discharges
378 total

Coverage residents most often leave under.

Medicare 23%
Private pay 58%
Medicaid 19%

Managed by Sydney Morrow

Licensed Nursing Home Administrator

Over 4 years of experience

Sydney Morrow is the Licensed Nursing Home Administrator at Greenbriar Rehabilitation and Nursing Center. With over 4 years of experience in long-term care and skilled nursing facilities nationwide, Sydney is passionate about delivering quality care inspired by personal family experience. Sydney is dedicated to ensuring excellent care and positive outcomes for all residents.

Places of interest near Greenbriar Rehabilitation and Nursing Center

Address 1.3 miles from city center Info Estimated distance in miles from Bradenton's city center to Greenbriar Rehabilitation and Nursing Center's address, calculated via Google Maps. — 1.17 miles to nearest hospital (Manatee Memorial Hospital)

Calculate Travel Distance to Greenbriar Rehabilitation and Nursing Center

Add your location

Address

Compare Nursing Homes around Bradenton

The information below is reported by the Florida Agency for Health Care Administration (AHCA).

5 facilities compared · CMS & FL Dept. of Health data

Westminster Point Pleasant
NH
AL
HC
IL
MC
NC
Bradenton
120
Facility 120
FL AVG 89
Rank #256 / 1074
94.4%
Facility 94.4%
FL AVG 84.3%
Rank #35 / 258
+12%
3.85
Facility 3.85
FL AVG 4.04
Rank #126 / 253
+28% -5%
$0
Facility $0
FL AVG $78.9k
Rank #1 / 258
92
Facility 92
FL AVG 83
Rank #237 / 876
12
Facility 12
FL AVG 19.7
Rank #67 / 252
3.0
Facility 3.0
FL AVG 4.5
Rank #53 / 252
- 111 -
76
Facility 76
FL AVG 40
Rank #139 / 1486
-
$16.2M
Facility $16.2M
FL AVG $15.7M
Rank #15 / 257
$18.1M
Facility $18.1M
FL AVG $6.1M
Rank #15 / 257
111.8%
Facility 111.8%
FL AVG 39.8%
Rank #179 / 257
106030
Surrey Place Healthcare & Rehabilitation
NH
HC
PC
RC
Bradenton
74
Facility 74
FL AVG 89
Rank #627 / 1074
90.2%
Facility 90.2%
FL AVG 84.3%
Rank #114 / 258
+7%
3.54
Facility 3.54
FL AVG 4.04
Rank #216 / 253
-15% -12%
$0
Facility $0
FL AVG $78.9k
Rank #1 / 258
-
11
Facility 11
FL AVG 19.7
Rank #53 / 252
3.7
Facility 3.7
FL AVG 4.5
Rank #94 / 252
- 63 -
30
Facility 30
FL AVG 40
Rank #915 / 1486
Shelley Christian
$11.1M
Facility $11.1M
FL AVG $15.7M
Rank #178 / 257
$5.7M
Facility $5.7M
FL AVG $6.1M
Rank #205 / 257
51.4%
Facility 51.4%
FL AVG 39.8%
Rank #169 / 257
105629
Greenbriar Rehabilitation and Nursing Center
NH
RC
Bradenton
79
Facility 79
FL AVG 89
Rank #600 / 1074
94.1%
Facility 94.1%
FL AVG 84.3%
Rank #43 / 258
+12%
3.83
Facility 3.83
FL AVG 4.04
Rank #145 / 253
+7% -5%
$8.5k
Facility $8.5k
FL AVG $78.9k
Rank #171 / 258
-
20
Facility 20
FL AVG 19.7
Rank #142 / 252
5.0
Facility 5.0
FL AVG 4.5
Rank #164 / 252
1 70 -
50
Facility 50
FL AVG 40
Rank #524 / 1486
Greenbriar Snf Holdco LLC
$9.4M
Facility $9.4M
FL AVG $15.7M
Rank #205 / 257
$4.5M
Facility $4.5M
FL AVG $6.1M
Rank #218 / 257
47.6%
Facility 47.6%
FL AVG 39.8%
Rank #134 / 257
105159
The Inn at Freedom Village
NH
NC
Bradenton
160
Facility 160
FL AVG 89
Rank #111 / 1074
81.0%
Facility 81.0%
FL AVG 84.3%
Rank #185 / 258
-4%
4.94
Facility 4.94
FL AVG 4.04
Rank #32 / 253
-18% +22%
$0
Facility $0
FL AVG $78.9k
Rank #1 / 258
82
Facility 82
FL AVG 83
Rank #530 / 876
16
Facility 16
FL AVG 19.7
Rank #107 / 252
4.0
Facility 4.0
FL AVG 4.5
Rank #112 / 252
1 85 -
67
Facility 67
FL AVG 40
Rank #250 / 1486
Steven Levato
$18.6M
Facility $18.6M
FL AVG $15.7M
Rank #16 / 257
$17.4M
Facility $17.4M
FL AVG $6.1M
Rank #8 / 257
93.5%
Facility 93.5%
FL AVG 39.8%
Rank #151 / 257
105655
Manatee Springs Nursing and Rehab
NH
NC
RC
Bradenton (South Bradenton)
120
Facility 120
FL AVG 89
Rank #256 / 1074
27.5%
Facility 27.5%
FL AVG 84.3%
Rank #254 / 258
-67%
4.42
Facility 4.42
FL AVG 4.04
Rank #61 / 253
+90% +10%
$0
Facility $0
FL AVG $78.9k
Rank #1 / 258
-
18
Facility 18
FL AVG 19.7
Rank #129 / 252
3.6
Facility 3.6
FL AVG 4.5
Rank #90 / 252
- 33 -
24
Facility 24
FL AVG 40
Rank #1015 / 1486
Manatee Holdings LLC
$13.8M
Facility $13.8M
FL AVG $15.7M
Rank #139 / 257
$1.7M
Facility $1.7M
FL AVG $6.1M
Rank #151 / 257
12.2%
Facility 12.2%
FL AVG 39.8%
Rank #151 / 257
105525

Financial Assistance for
Nursing Home in Florida

Greenbriar Rehabilitation and Nursing Center is located in Bradenton, Florida.
Here are the financial assistance programs available to residents in Florida.

Get Financial aid guidance

Long-Term Care Waiver

Florida Medicaid LTC Waiver

Age 65+ or 21+ disabled
General Florida resident, Medicaid- eligible, nursing home-level care need.
Income Limits (2025) ~$2,829/month 300% FBR, individual
Asset Limits $2,000 (individual), $3,000 (couple).
FL

High demand; waitlists common.

Benefits
In-home care (6-8 hours/day) Assisted living Respite (240 hours/year) Case management

Community Care for the Elderly (CCE)

Florida CCE

Age 60+
General Florida resident, at risk of nursing home.
Income Limits ~$2,000/month varies
Asset Limits $5,000 individual
FL

Limited funding; regional variation.

Benefits
Homemaker services (3-5 hours/week) Adult day care (~$60/day) Respite (up to 10 days/year)

Home Care for the Elderly (HCE)

Florida Home Care for the Elderly

Age 60+
General Florida resident, at risk of nursing home placement; caregiver must be approved.
Income Limits (2025) ~$2,829/month individual, aligned with Medicaid thresholds
Asset Limits ~$2,000 (individual); varies by case manager discretion.
FL

Limited funding (~3,500 served annually); prioritizes low-income frail seniors.

Benefits
Basic subsidy (~$160/month) for housing/medical costs; special subsidies for supplies/services (e.g., incontinence supplies, ~$50-$200/month)

Program of All-Inclusive Care for the Elderly (PACE)

Florida Medicaid PACE

Age 55+
General Florida resident, nursing home-level care need, safe with PACE support.
Income Limits (2025) ~$2,829/month 300% FBR
Asset Limits $2,000 (individual), $3,000 (couple).
FL

Limited to specific counties (e.g., Hillsborough, Miami-Dade); ~10 sites statewide.

Benefits
Personal care (5-7 hours/day) Medical care Meals Transportation Therapy

Optional State Supplementation (OSS)

Florida Optional State Supplementation

Age 65+ or disabled
General Florida resident, living in approved facility, receiving SSI or low-income.
Income Limits (2025) ~$1,004/month individual, including SSI
Asset Limits $2,000 (individual), $3,000 (couple).
FL

Limited to specific facility types; ~$78.40/month max supplement.

Benefits
Cash payment (~$78.40/month) for room/board or personal needs in facilities

Frequently Asked Questions about Greenbriar Rehabilitation and Nursing Center

Is Greenbriar Rehabilitation and Nursing Center in a walkable area?

Greenbriar Rehabilitation and Nursing Center has a walk score of 50. Moderately walkable. Some errands can be accomplished on foot, with a mix of nearby amenities.

What is the occupancy rate at Greenbriar Rehabilitation and Nursing Center?

Greenbriar Rehabilitation and Nursing Center's occupancy is 94.1%.

Does Greenbriar Rehabilitation and Nursing Center operate as a for-profit or non-profit?

Greenbriar Rehabilitation and Nursing Center is registered as a for-profit.

Are there photos of Greenbriar Rehabilitation and Nursing Center?

Yes — there are 15 photos of Greenbriar Rehabilitation and Nursing Center in the photo gallery on this page.

What is the address of Greenbriar Rehabilitation and Nursing Center?

Greenbriar Rehabilitation and Nursing Center is located at 210 21St Ave W, Bradenton, FL 34205.

What is the phone number of Greenbriar Rehabilitation and Nursing Center?

(941) 747-3786 will put you in contact with the team at Greenbriar Rehabilitation and Nursing Center.

Is Greenbriar Rehabilitation and Nursing Center Medicare or Medicaid certified?

Yes — Greenbriar Rehabilitation and Nursing Center is a CMS-certified provider of Medicare and Medicaid.

Guides for Better Senior Living

Care Cost Calculator: See Prices in Your Area

Nursing Home Data Explorer

Don’t Wait Too Long: 7 Red Flag Signs Your Parent Needs Assisted Living Now

The True Cost of Assisted Living in 2025 – And How Families Are Paying For It

Understanding Senior Living Costs: Pricing Models, Discounts & Financial Assistance