Heritage Park Care & Rehabilitation Center
Nursing Home & Memory Care · Bradenton, FL
CMS overall rating Info CMS (the Centers for Medicare & Medicaid Services) is the federal agency that rates nursing home quality. Its Overall Rating runs from 1 to 5 stars, combining health inspections, staffing, and quality measures, with inspections weighted most heavily.

Heritage Park Care & Rehabilitation Center

Nursing Home & Memory Care · Bradenton, FL
CMS overall rating Info CMS (the Centers for Medicare & Medicaid Services) is the federal agency that rates nursing home quality. Its Overall Rating runs from 1 to 5 stars, combining health inspections, staffing, and quality measures, with inspections weighted most heavily.
Calculator: See prices in your area
Heritage Park Care & Rehabilitation Center accepts Medicare, Medicaid, and private pay.

Overview of Heritage Park Care & Rehabilitation Center

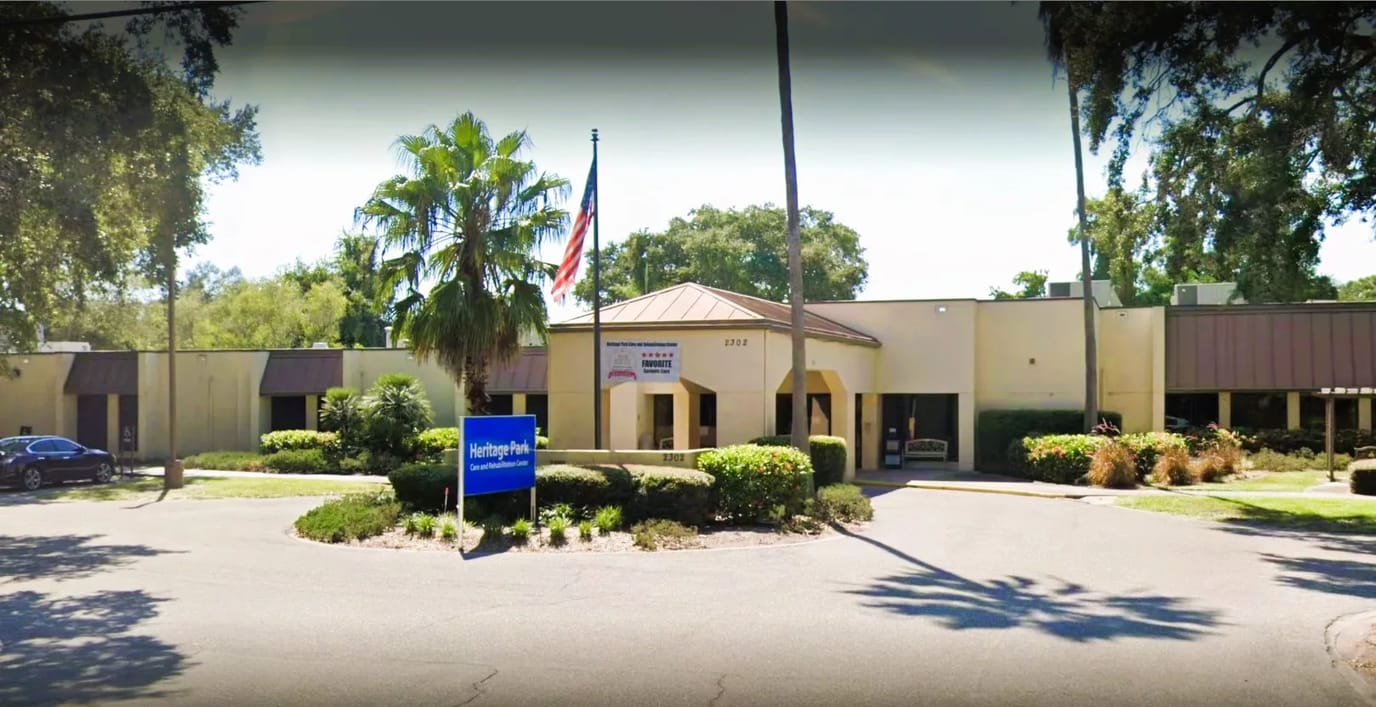
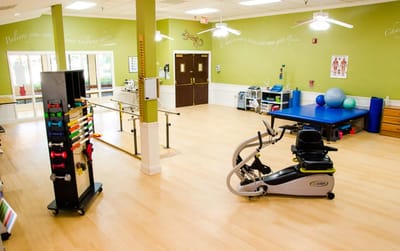
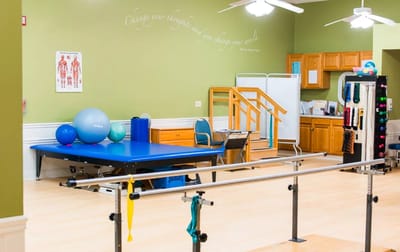
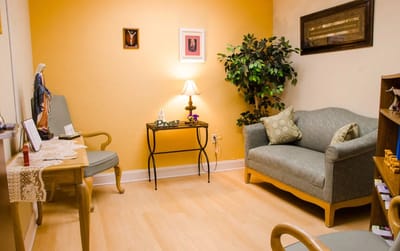
Located in Bradenton, Florida, the Heritage Park Care & Rehabilitation Center stands as a premier destination offering both short and long-term rehabilitation services. This skilled nursing home boasts a friendly and dedicated staff known for providing comprehensive and effective treatment plans to its residents. Within its walls, Heritage Park offers in-house therapy and skilled nursing services, making it an ideal place for residents to stay active and engaged. Their vibrant activity calendar ensures residents are involved in a range of activities designed to enhance their well-being.
In addition to their skilled nursing home services, Heritage Park also excels in providing memory care services. Professional caregivers tailor therapy programs to meet the unique needs of each patient, offering a personalized approach that ensures a supportive and nurturing environment. At Heritage Park Care & Rehabilitation Center, residents receive not just care, but genuine concern for their well-being, making it a place where rehabilitation meets compassion.

(941) 792-8480

Quality ratings

Measured by Centers for Medicare & Medicaid Services (CMS)

Overall rating Info The Overall CMS Rating combines results from health inspections, staffing levels and quality measures. Health inspections carry the most weight. Staffing and quality scores can increase or decrease the final rating based on performance compared to state and national standards.
▼ 5.5% Below FL avg. ▼ 5.5% Below FL avg.FL average: 3.2Click the badge to see the full State ranking.Click here to see the full State ranking.
Health Inspection Info Based on the results of the facility's three most recent standard inspections and any complaint investigations. CMS reviews the number, scope, and severity of deficiencies, with more recent findings weighted more heavily.
▲ 6.7% Above FL avg. ▲ 6.7% Above FL avg.FL average: 2.8Click the badge to see the full State ranking.Click here to see the full State ranking.
Staffing Info Measures average nursing staff hours per resident per day, including Registered Nurses (RNs) and total nursing staff. Ratings are adjusted based on the level of care residents require and are compared to state and national benchmarks.
▼ 40.9% Below FL avg. ▼ 40.9% Below FL avg.FL average: 3.4Click the badge to see the full State ranking.Click here to see the full State ranking.
Quality Measures Info Based on clinical and physical health indicators reported to CMS, such as hospital readmissions, falls, pressure ulcers, and improvements in mobility. These measures reflect how well residents' health needs are being managed.
▼ 50.7% Below FL avg. ▼ 50.7% Below FL avg.FL average: 4.1Click the badge to see the full State ranking.Click here to see the full State ranking.

Staffing hours breakdown

Info Daily nursing hours per resident by staff type, reported to CMS. Higher is generally better — compare this facility to state and national averages to see where staffing stands.

Hours per resident per day — compared to Florida state averages

Total nursing care / resident Info This home is ranked 145th out of 253 homes in Florida for nurse hours. Total adjusted nursing hours per resident per day, combining RN, LPN, and aide time. CMS adjusts this for case-mix so facilities can be fairly compared.
3h 48m per day
Rank #145 / 253Nurse hours — State benchmarkedThis home is ranked 145th out of 253 homes in Florida. Shows adjusted nurse hours per resident per day benchmarked to the Florida average, with a ranking across 253 Florida facilities. More hours mean more direct care. The national average is about 3.5 hrs; below 3.0 is a red flag.Ranking totals vary by category as each rank only includes facilities that report data for that metric. Homes missing that data point aren't included in the ranking.Click the rank badge to see the full State ranking.Click here to see the full State ranking.
This facility Florida avg (4h 2m per day)
vs Florida avg
-6%

4 of 6 metrics below state avg

Standout metric Physical Therapist is +27% above state avg
Staff typeHours / Day / Residentvs state avg
Registered Nurse (RN) Info RNs hold the highest nursing license and can assess residents, interpret test results, and direct care plans. More RN hours per day often signals stronger clinical oversight and faster response to health changes. 24m per day ▼ 46% State avg: 44m per day · National avg: 41m per day
LPN / LVN Info Licensed Practical Nurses (LPNs) or Licensed Vocational Nurses (LVNs) deliver routine hands-on care — medication administration, wound dressing, and monitoring vital signs. They work under RN supervision and make up a large share of daily bedside care. 57m per day ▲ 20% State avg: 47m per day · National avg: 52m per day
Nurse Aide Info Certified Nurse Aides (CNAs) provide the most direct day-to-day assistance: bathing, dressing, feeding, and mobility. Nurse aide hours are typically the largest staffing category and directly affect residents' quality of life. 2h 3m per day ▼ 12% State avg: 2h 20m per day · National avg: 2h 21m per day
Weekend Total Nursing Info Combined nursing hours (RN + LPN + Nurse Aide) per resident per day on weekends. Staffing often drops on weekends — this figure reveals whether the facility maintains adequate coverage outside of weekday hours. 3h 5m per day ▼ 12% State avg: 3h 31m per day · National avg: 3h 26m per day
Physical Therapist Info Hours per resident per day provided by licensed Physical Therapists (PTs) or PT Assistants. PT services help residents recover mobility after injury or illness and are especially important for post-acute (short-stay) rehabilitation. 6m per day ▲ 27% State avg: 5m per day · National avg: 4m per day
Weekend RN Info Registered nurse hours specifically on weekends. Facilities sometimes reduce RN presence on Saturdays and Sundays — a low weekend RN figure compared to weekday hours can indicate reduced clinical oversight when most administrative staff are absent. 14m per day ▼ 56% State avg: 32m per day · National avg: 29m per day

Capacity and availability

This home usually has availability

Lower occupancy than the Florida average: 84.3%
Occupancy rate
76.4% Rank #203 / 258Occupancy rate — State benchmarkedThis home is ranked 203rd out of 258 homes in Florida. Shows this facility's occupancy rate versus the Florida average, with its Statewide rank out of 258. Higher occupancy signals strong local demand and financial stability.Ranking totals vary by category as each rank only includes facilities that report data for that metric. Homes missing that data point aren't included in the ranking.Click the rank badge to see the full State ranking.Click here to see the full State ranking.
Avg. Length of Stay
62 days
Bed community size
120-bed community Rank #256 / 1074Bed count — State benchmarkedThis home is ranked 256th out of 1074 homes in Florida. Shows this facility's certified or reported bed count compared to other Florida facilities. Larger communities may offer more amenities, programs, and on-site services for residents and families.Ranking totals vary by category as each rank only includes facilities that report data for that metric. Homes missing that data point aren't included in the ranking.Click the rank badge to see the full State ranking.Click here to see the full State ranking.
A larger shared setting that may offer more common spaces and organized community services.
Walk Score
Walk Score: 33 / 100 Rank #864 / 1486Walk Score — State benchmarkedThis home is ranked 864th out of 1486 homes in Florida. Shows how walkable this facility's neighborhood is compared to the average Walk Score across Florida facilities. Higher scores benefit residents, families, and staff.Ranking totals vary by category as each rank only includes facilities that report data for that metric. Homes missing that data point aren't included in the ranking.Click the rank badge to see the full State ranking.Click here to see the full State ranking.
Somewhat walkable. A few nearby services may be reachable on foot, but most trips require transportation.
BBB Rating
BBB Rating: A+ (Not Accredited)
An independent rating from the Better Business Bureau based on factors such as complaint history, transparency, and business practices.
How BBB ratings work

About this community

Contact Heritage Park Care & Rehabilitation Center

Inspection History

In Florida, the Agency for Health Care Administration (AHCA) is the primary authority that conducts unannounced inspections and completes official health quality reports for all healthcare facilities.

Since 2020 · 6 years of data 18 citations
We don't publish a score for nursing homes with fewer than three inspections on record. This would unfairly reward providers with limited inspection history or those that have not been operating long enough to be cited.

Inspection score unavailable

Not enough inspection history to generate a score.

Average score for Florida nursing homes: B 83/100

Inspection score not available. Not enough inspection history to score against the Florida benchmark.

Inspection Scorecard Info This scorecard compares key inspection, citation, and complaint metrics at this facility against the Florida state average. Metrics rated ≥15% worse than average are highlighted in red; those ≥15% better are highlighted in green.

Since 2020 vs. Florida state average
Overall vs. FL average 0 Worse No metrics in this bucket. 2 Better Metrics better than Florida average:
• Total citations (45% below)
• Citations per year (45% below)
Latest Inspection December 15, 2025 Complaint Investigation

Citations Info Citations are formal regulatory issues recorded during state inspections.

This FacilityFL Averagevs. FL Avg
Total citations Info Formal regulatory issues recorded by inspectors across all inspection types. 1833 This facility has 45% fewer total citations than a typical Florida nursing home (18 vs. FL avg 33).↓ 45% better Rank #1 / 919 Total citations — State benchmarked This home is ranked 1st out of 919 homes in Florida. Shows this facility's total citations compared to the Florida average among 919 comparable communities in the ranking pool. Ranking totals vary by category as each rank only includes facilities that report data for that metric. Homes missing that data point aren't included in the ranking.
Citations per year Info Average citations per year since 2020. 35.5 This facility has 45% fewer citations per year than a typical Florida nursing home (3 vs. FL avg 5.5).↓ 45% better

Inspection Reports Summary Info An editor-reviewed summary of the themes and findings across this facility's recent inspection reports.

  • December 15, 2025 complaint investigation found failures in respecting residents due to language barriers and unresolved sewage odor with multiple clogged toilets in resident bathrooms.
  • October 19, 2023 annual inspection cited seven deficiencies including inadequate PTSD care plans, untreated skin conditions, enteral feeding failures, and food service sanitation issues.
  • September 16, 2021 annual inspection found four documentation and notification deficiencies but no complaints or immediate jeopardy were reported.

Health Inspection History

Inspections since 2020
Total health inspections 3

Florida average 4.3


Last Health inspection on Oct 2023

Total health citations
11 Rank #53 / 252Health citations — State benchmarkedThis home is ranked 53rd out of 252 homes in Florida. Shows this facility's total health deficiency citations benchmarked to the Florida State average, with a ranking across all 252 FL facilities. Lower citation counts earn a better rank.Ranking totals vary by category as each rank only includes facilities that report data for that metric. Homes missing that data point aren't included in the ranking.Click the rank badge to see the full State ranking.Click here to see the full State ranking.

Florida average 19.7

Citations per inspection
3.67 Rank #94 / 252Citations per inspection — State benchmarkedThis home is ranked 94th out of 252 homes in Florida. Shows average deficiency citations per CMS inspection for this facility versus the Florida mean across 252 facilities with citation data. Lower is better.Ranking totals vary by category as each rank only includes facilities that report data for that metric. Homes missing that data point aren't included in the ranking.Click the rank badge to see the full State ranking.Click here to see the full State ranking.

Florida average 4.48


Health citations are formal notices following inspections when they fail to comply with safety and care standards.

All 11 citations resulted from standard inspections.

Breakdown of citation severity (last 6 years)
Critical health citations
0
100% better than Florida average

Florida average: 0.8


Serious health citations
0
100% better than Florida average

Florida average: 0.4

0 critical citations Florida average: 0.8

0 serious citations Florida average: 0.4

11 moderate citations Florida average: 18.4

0 minor citations Florida average: 0.2
Citations history (last 6 years)
Nutrition moderate citation Oct 19, 2023
Corrected

Quality of Care moderate citation Oct 19, 2023
Corrected

Quality of Care moderate citation Oct 19, 2023
Corrected

Care Planning moderate citation Oct 19, 2023
Corrected

Staffing Data

Reporting period: October 1 – December 31, 2025 (Q4 2025). Source: CMS Payroll-Based Journal report.

Total staff 142
Employees 139
Contractors 3
Staff to resident ratio 1.46 : 1
0% compared with Florida average
Florida average ratio: 1.47 : 1 Florida average ratio: 1.47 : 1See full Florida ranking
Avg staff/day 56
Average shift 7.9 hours
0% compared with Florida average
Florida average: 7.9 hours Florida average shift: 7.9 hoursSee full Florida ranking
Total staff hours (quarter) 40,565

Nursing staff breakdown

Q4 2025 · Oct 1 – Dec 31 More info This data comes from the CMS Payroll-Based Journal report covering October 1 – December 31, 2025.
Registered Nurse

Manages medical care and health needs.

RN Staff Info All 12 RN Staff are full-time employees. No contractors work on this role. 12
Average shift length Info Average shift length. Calculated as total hours divided by days worked and average staff per day. 9.2 hours
Licensed Practical Nurse

Assists with medical care and medications.

LPN Staff Info All 25 LPN Staff are full-time employees. No contractors work on this role. 25
Average shift length Info Average shift length. Calculated as total hours divided by days worked and average staff per day. 9.4 hours
Certified Nursing Assistant

Helps with daily care and mobility.

CNA Staff Info All 72 CNA Staff are full-time employees. No contractors work on this role. 72
Average shift length Info Average shift length. Calculated as total hours divided by days worked and average staff per day. 7.5 hours

Contractor staffing

Q4 2025 · Oct 1 – Dec 31 More info This data comes from the CMS Payroll-Based Journal report covering October 1 – December 31, 2025.

Total hours from contractors

0.4%

175 contractor hours this quarter

Occupational Therapy Assistant: 2 Medical Director: 1

Staff by category

Q4 2025 · Oct 1 – Dec 31 More info This data comes from the CMS Payroll-Based Journal report covering October 1 – December 31, 2025.
Certified Nursing Assistant7207221,00292100%7.5
Licensed Practical Nurse250258,62492100%9.4
Registered Nurse120122,3059098%9.2
Clinical Nurse Specialist3031,2517278%7.7
Respiratory Therapy Technician4041,0867278%7.9
RN Director of Nursing4041,0696672%7.7
Physical Therapy Assistant5057387177%7.3
Mental Health Service Worker2026326470%7.3
Qualified Social Worker2026086571%6.3
Nurse Practitioner1015206571%8
Administrator1015126470%8
Dietitian1015096672%7.7
Physical Therapy Aide2024906470%7.4
Other Dietary Services Staff1014846368%7.7
Occupational Therapy Aide1013183336%9.6
Speech Language Pathologist3032454448%5.6
Medical Director0111065358%2
Occupational Therapy Assistant022692830%2.3
72 Certified Nursing Assistant
% of Days 100%
25 Licensed Practical Nurse
% of Days 100%
12 Registered Nurse
% of Days 98%
3 Clinical Nurse Specialist
% of Days 78%
4 Respiratory Therapy Technician
% of Days 78%
4 RN Director of Nursing
% of Days 72%
5 Physical Therapy Assistant
% of Days 77%
2 Mental Health Service Worker
% of Days 70%
2 Qualified Social Worker
% of Days 71%
1 Nurse Practitioner
% of Days 71%
1 Administrator
% of Days 70%
1 Dietitian
% of Days 72%
2 Physical Therapy Aide
% of Days 70%
1 Other Dietary Services Staff
% of Days 68%
1 Occupational Therapy Aide
% of Days 36%
3 Speech Language Pathologist
% of Days 48%
1 Medical Director
% of Days 58%
2 Occupational Therapy Assistant
% of Days 30%

Penalties and fines

Includes penalties issued in 2023

Federal penalties imposed by CMS for regulatory violations, including civil money penalties (fines) and denials of payment for new Medicare/Medicaid admissions.

Source: CMS Penalties Database (Data as of Jan 2026)

Total fines amount $4K Rank #164 / 258Federal fines — State benchmarkedThis home is ranked 164th out of 258 homes in Florida. Shows this facility's cumulative CMS federal fine dollars versus the Florida average among facilities with fines, and where it ranks among 258 facilities in the pool. Lower total dollars mean a better rank.Ranking totals vary by category as each rank only includes facilities that report data for that metric. Homes missing that data point aren't included in the ranking.Click the rank badge to see the full State ranking.Click here to see the full State ranking.
94% lower than Florida average

Florida average: $72K

Number of fines 1
62% fewer fines than Florida average

Florida average: 2.6

Payment Denials Info Serious action where Medicare and/or Medicaid temporarily stops payments for new residents until issues are fixed. 0
100% fewer payment denials than Florida average

Florida average: 0.1

Fines amount comparison
This facility $4K
Florida average $72K
Penalty History

Penalties are imposed by CMS for violations of federal nursing home regulations.

1 penalty in the past 3 years

Oct 19, 2023 · $4K

Civil Money Penalty Info Fines imposed for noncompliance, which can be assessed per day or per instance of violation. Oct 19, 2023
$4K

Last updated: Jan 2026

Quality of care over time

These measures show how residents usually do over time at this home, based on health outcomes and preventive care.

High-risk clinical events score Info A composite score based on pressure ulcers, falls with injury, weight loss, walking ability decline, and activities of daily living decline. 16.0
116% worse than Florida average

Florida average: 7.4

Functional decline score Info A composite score based on activities of daily living decline, walking ability decline, and incontinence. 30.0
142% worse than Florida average

Florida average: 12.4

Long-stay resident measures
Below average Florida avg: 4.5 Info CMS star rating based on long-stay quality measure performance. 5 stars = significantly above average, 1 star = significantly below average.
Need for Help with Daily Activities Increased Info Percent of long-stay residents whose need for help with daily activities has increased 26.6%
153% worse than Florida average

Florida average: 10.5%

Walking Ability Worsened Info Percent of long-stay residents whose ability to move independently worsened 36.1%
178% worse than Florida average

Florida average: 12.9%

Low Risk Residents with Bowel/Bladder Incontinence Info Percent of low risk long-stay residents who lose control of their bowels or bladder 27.5%
103% worse than Florida average

Florida average: 13.5%

Falls with Major Injury Info Percent of long-stay residents experiencing one or more falls with major injury 3.4%
27% worse than Florida average

Florida average: 2.6%

High Risk Residents with Pressure Ulcers Info Percent of long-stay high risk residents with pressure ulcers 6.6%
23% worse than Florida average

Florida average: 5.4%

Urinary Tract Infection Info Percent of long-stay residents with a urinary tract infection 1.9%
115% worse than Florida average

Florida average: 0.9%

Lost Too Much Weight Info Percent of long-stay residents who lose too much weight 7.6%
27% worse than Florida average

Florida average: 6.0%

Depressive Symptoms Info Percent of long-stay residents who have depressive symptoms 0.7%
79% better than Florida average

Florida average: 3.3%

Antipsychotic Use Info Percent of long-stay residents who received an antipsychotic medication 6.6%
18% better than Florida average

Florida average: 8.0%

Pneumococcal Vaccine Info Percent of long-stay residents assessed and appropriately given the pneumococcal vaccine 98.2%
In line with Florida average

Florida average: 97.7%

Influenza Vaccine Info Percent of long-stay residents assessed and appropriately given the seasonal influenza vaccine 100.0%
In line with Florida average

Florida average: 99.2%

Hospitalizations per 1,000 days Info Number of hospitalizations per 1,000 long-stay resident days. 2.07
In line with Florida average

Florida average: 2.10

ED visits per 1,000 days Info Number of outpatient emergency department visits per 1,000 long-stay resident days. 1.31
11% worse than Florida average

Florida average: 1.18

Short-stay resident measures
Significantly below average Florida avg: 3.1 Info CMS star rating based on short-stay quality measure performance. 5 stars = much above average, 1 star = much below average.
Pneumococcal Vaccine Info Percent of short-stay residents assessed and appropriately given the pneumococcal vaccine 96.4%
In line with Florida average

Florida average: 94.0%

Antipsychotic medication increase Info Percent of short-stay residents who newly received an antipsychotic medication 1.9%
26% worse than Florida average

Florida average: 1.5%

Influenza Vaccine Info Percent of short-stay residents assessed and appropriately given the seasonal influenza vaccine 89.8%
5% worse than Florida average

Florida average: 94.7%

Re-hospitalized after SNF stay Info Percentage of short-stay residents who were re-hospitalized after their nursing home admission. 23.7%
10% better than Florida average

Florida average: 26.2%

Emergency department visits Info Percentage of short-stay residents who had an outpatient emergency department visit. 10.6%
14% worse than Florida average

Florida average: 9.3%

Falls with major injury Info Percentage of SNF residents who experience falls with major injury during their stay. 0.6%
23% better than Florida average

Florida average: 0.8%

Ability to care for self at discharge Info Percentage of residents at or above expected ability to care for themselves at discharge. 39.5%
27% worse than Florida average

Florida average: 53.7%

Successful return to home or community Info Rate of successful return to home or community from a skilled nursing facility. 41.6%
18% worse than Florida average

Florida average: 50.6%

Breakdown by payment type

Medicare

17% of new residents, usually for short-term rehab.

Typical stay 1 - 2 months

Private pay

31% of new residents, often for short stays.

Typical stay 5 - 6 months

Medicaid

52% of new residents, often for long-term daily care.

Typical stay 7 days

Facility Characteristics

Source: CMS Long-Term Care Facility Characteristics (Data as of Jan 2026)

Total residents 97
Medicare
7
7.2% of residents
Medicaid
44
45.4% of residents
Private pay or other
46
47.4% of residents
Programs & Services
Residents Group

Residents meet regularly to discuss policies, care quality, and activities

Active Resident Council

Organized group of residents that meets regularly to discuss facility policies, quality of life, and activities.

Finances and operations

Based on CMS SNF Cost Report for fiscal year ending in 12/2023.

Privately-owned community
Operated by a single business entity.
Net patient revenue Info Net patient revenue — what the home actually collects for resident care, after contractual allowances, bad debt and discounts are subtracted from its gross charges (CMS cost report, Worksheet G-3). It covers resident care only; money the home earns from other sources is shown separately as "Other income."
$10.6M
Net patient income Info Net patient income: net patient revenue minus the home's total operating expenses. A positive figure means it earns more from resident care than it spends to deliver it; a negative figure means the opposite. It excludes non-operating "other income."
-$1.7M
Privately-owned community Operated by a single business entity.
Net patient revenue Info Net patient revenue — what the home actually collects for resident care, after contractual allowances, bad debt and discounts are subtracted from its gross charges (CMS cost report, Worksheet G-3). It covers resident care only; money the home earns from other sources is shown separately as "Other income."
$10.6M Rank #220 / 257Revenue — State benchmarkedThis home is ranked 220th out of 257 homes in Florida. Shows this facility's annual revenue compared to the Florida average. Higher revenue generally means more resources for staffing and capital — read alongside Payroll %.Ranking totals vary by category as each rank only includes facilities that report data for that metric. Homes missing that data point aren't included in the ranking.Click the rank badge to see the full State ranking.Click here to see the full State ranking.
Net patient income Info Net patient income: net patient revenue minus the home's total operating expenses. A positive figure means it earns more from resident care than it spends to deliver it; a negative figure means the opposite. It excludes non-operating "other income."
-$1.7M
Other income Info Money the home earns outside of resident care — such as investments, grants, rentals and other non-operating sources (CMS cost report, Worksheet G-3). It is tracked separately from net patient revenue: it is not part of that figure, and it is not included in net patient income.
$282
Payroll costs Info Staff salaries plus wage-related costs — benefits such as payroll taxes, health insurance and retirement — from the home's own accounting records (CMS cost report, Worksheet A). Contract or agency labor is counted separately, under other operating costs. Rank #211 / 257Payroll — State benchmarkedThis home is ranked 211th out of 257 homes in Florida. Shows total annual staff payroll benchmarked to the Florida average. Higher payroll investment relative to peers often signals better staffing and less reliance on cheaper contract labor.Ranking totals vary by category as each rank only includes facilities that report data for that metric. Homes missing that data point aren't included in the ranking.Click the rank badge to see the full State ranking.Click here to see the full State ranking.
$5.5M 51.5% of net patient revenue Info Payroll as a share of revenue: staff salaries and wage-related benefits divided by net patient revenue. A higher figure means more of each revenue dollar goes to staff pay. Rank #57 / 257Payroll % — State benchmarkedThis home is ranked 57th out of 257 homes in Florida. Shows payroll as a percentage of revenue versus the Florida average. Well-run Florida facilities typically land around 49–56% — the top third Statewide. Below 25% may signal understaffing or heavy agency use — read with Staffing ratings.Ranking totals vary by category as each rank only includes facilities that report data for that metric. Homes missing that data point aren't included in the ranking.Click the rank badge to see the full State ranking.Click here to see the full State ranking.
Other operating costs Info Everything it costs to run the home apart from payroll — food, utilities, supplies, maintenance, contract labor and administration. Calculated as total operating expense minus payroll (staff salaries and wage-related benefits).
$6.8M
Total costs Info The home's total operating expense for the year — all the costs of running it, salaries included (CMS cost report, Worksheet G-3).
$12.3M

Who this home usually serves

TYPE OF STAY

Mostly long-term care residents

Most residents stay for extended periods and receive ongoing daily care.

Most new residents arrive under Medicaid (52% of admissions), and a typical Medicaid stay runs around 7 days.

Admissions
546 total

Coverage residents most often arrive under.

Medicare 17%
Private pay 31%
Medicaid 52%
Discharges
542 total

Coverage residents most often leave under.

Medicare 17%
Private pay 30%
Medicaid 53%

Places of interest near Heritage Park Care & Rehabilitation Center

Address 3.2 miles from city center Info Estimated distance in miles from Bradenton's city center to Heritage Park Care & Rehabilitation Center's address, calculated via Google Maps. — 0.27 miles to nearest hospital (HCA Florida Blake Hospital)

Calculate Travel Distance to Heritage Park Care & Rehabilitation Center

Add your location

Address

Compare Nursing Home around Bradenton

The information below is reported by the Florida Agency for Health Care Administration (AHCA).

5 facilities compared · CMS & FL Dept. of Health data

Westminster Point Pleasant
NH
AL
HC
IL
MC
NC
Bradenton
120
Facility 120
FL AVG 89
Rank #256 / 1074
94.4%
Facility 94.4%
FL AVG 84.3%
Rank #35 / 258
+12%
3.85
Facility 3.85
FL AVG 4.04
Rank #126 / 253
+28%-5%
$0
Facility $0
FL AVG $78.9k
Rank #1 / 258
92
Facility 92
FL AVG 83
Rank #237 / 876
12
Facility 12
FL AVG 19.7
Rank #67 / 252
3.0
Facility 3.0
FL AVG 4.5
Rank #53 / 252
-111-
76
Facility 76
FL AVG 40
Rank #139 / 1486
-
$16.2M
Facility $16.2M
FL AVG $15.7M
Rank #15 / 257
$18.1M
Facility $18.1M
FL AVG $6.1M
Rank #15 / 257
111.8%
Facility 111.8%
FL AVG 39.8%
Rank #179 / 257
106030
Surrey Place Healthcare & Rehabilitation
NH
HC
PC
RC
Bradenton
74
Facility 74
FL AVG 89
Rank #627 / 1074
90.2%
Facility 90.2%
FL AVG 84.3%
Rank #114 / 258
+7%
3.54
Facility 3.54
FL AVG 4.04
Rank #216 / 253
-15%-12%
$0
Facility $0
FL AVG $78.9k
Rank #1 / 258
-
11
Facility 11
FL AVG 19.7
Rank #53 / 252
3.7
Facility 3.7
FL AVG 4.5
Rank #94 / 252
-63-
30
Facility 30
FL AVG 40
Rank #915 / 1486
Shelley Christian
$11.1M
Facility $11.1M
FL AVG $15.7M
Rank #178 / 257
$5.7M
Facility $5.7M
FL AVG $6.1M
Rank #205 / 257
51.4%
Facility 51.4%
FL AVG 39.8%
Rank #169 / 257
105629
Heritage Park Care & Rehabilitation Center
NH
MC
Bradenton
120
Facility 120
FL AVG 89
Rank #256 / 1074
76.4%
Facility 76.4%
FL AVG 84.3%
Rank #203 / 258
-9%
3.81
Facility 3.81
FL AVG 4.04
Rank #145 / 253
-30%-6%
$4.5k
Facility $4.5k
FL AVG $78.9k
Rank #164 / 258
-
11
Facility 11
FL AVG 19.7
Rank #53 / 252
3.7
Facility 3.7
FL AVG 4.5
Rank #94 / 252
-112A+
33
Facility 33
FL AVG 40
Rank #864 / 1486
Heritage Park Nursing Center LLC
$10.6M
Facility $10.6M
FL AVG $15.7M
Rank #220 / 257
$5.5M
Facility $5.5M
FL AVG $6.1M
Rank #211 / 257
51.5%
Facility 51.5%
FL AVG 39.8%
Rank #57 / 257
105529
The Inn at Freedom Village
NH
NC
Bradenton
160
Facility 160
FL AVG 89
Rank #111 / 1074
81.0%
Facility 81.0%
FL AVG 84.3%
Rank #185 / 258
-4%
4.94
Facility 4.94
FL AVG 4.04
Rank #32 / 253
-18%+22%
$0
Facility $0
FL AVG $78.9k
Rank #1 / 258
82
Facility 82
FL AVG 83
Rank #530 / 876
16
Facility 16
FL AVG 19.7
Rank #107 / 252
4.0
Facility 4.0
FL AVG 4.5
Rank #112 / 252
185-
67
Facility 67
FL AVG 40
Rank #250 / 1486
Steven Levato
$18.6M
Facility $18.6M
FL AVG $15.7M
Rank #16 / 257
$17.4M
Facility $17.4M
FL AVG $6.1M
Rank #8 / 257
93.5%
Facility 93.5%
FL AVG 39.8%
Rank #151 / 257
105655
Westminster Manor -
NH
AL
HC
IL
MC
NC
Bradenton
59
Facility 59
FL AVG 89
Rank #734 / 1074
---------------
59
Facility 59
FL AVG 40
Rank #368 / 1486
$6.6M
Facility $6.6M
FL AVG $15.7M
Rank #159 / 257
$7.6M
Facility $7.6M
FL AVG $6.1M
Rank #127 / 257
115.9%
Facility 115.9%
FL AVG 39.8%
Rank #69 / 257
105919

Financial Assistance for
Nursing Home in Florida

Heritage Park Care & Rehabilitation Center is located in Bradenton, Florida.
Here are the financial assistance programs available to residents in Florida.

Get Financial aid guidance

Long-Term Care Waiver

Florida Medicaid LTC Waiver

Age 65+ or 21+ disabled
General Florida resident, Medicaid- eligible, nursing home-level care need.
Income Limits (2025) ~$2,829/month 300% FBR, individual
Asset Limits $2,000 (individual), $3,000 (couple).
FL

High demand; waitlists common.

Benefits
In-home care (6-8 hours/day) Assisted living Respite (240 hours/year) Case management

Community Care for the Elderly (CCE)

Florida CCE

Age 60+
General Florida resident, at risk of nursing home.
Income Limits ~$2,000/month varies
Asset Limits $5,000 individual
FL

Limited funding; regional variation.

Benefits
Homemaker services (3-5 hours/week) Adult day care (~$60/day) Respite (up to 10 days/year)

Home Care for the Elderly (HCE)

Florida Home Care for the Elderly

Age 60+
General Florida resident, at risk of nursing home placement; caregiver must be approved.
Income Limits (2025) ~$2,829/month individual, aligned with Medicaid thresholds
Asset Limits ~$2,000 (individual); varies by case manager discretion.
FL

Limited funding (~3,500 served annually); prioritizes low-income frail seniors.

Benefits
Basic subsidy (~$160/month) for housing/medical costs; special subsidies for supplies/services (e.g., incontinence supplies, ~$50-$200/month)

Program of All-Inclusive Care for the Elderly (PACE)

Florida Medicaid PACE

Age 55+
General Florida resident, nursing home-level care need, safe with PACE support.
Income Limits (2025) ~$2,829/month 300% FBR
Asset Limits $2,000 (individual), $3,000 (couple).
FL

Limited to specific counties (e.g., Hillsborough, Miami-Dade); ~10 sites statewide.

Benefits
Personal care (5-7 hours/day) Medical care Meals Transportation Therapy

Optional State Supplementation (OSS)

Florida Optional State Supplementation

Age 65+ or disabled
General Florida resident, living in approved facility, receiving SSI or low-income.
Income Limits (2025) ~$1,004/month individual, including SSI
Asset Limits $2,000 (individual), $3,000 (couple).
FL

Limited to specific facility types; ~$78.40/month max supplement.

Benefits
Cash payment (~$78.40/month) for room/board or personal needs in facilities

Frequently Asked Questions about Heritage Park Care & Rehabilitation Center

Is Heritage Park Care & Rehabilitation Center in a walkable area?

Heritage Park Care & Rehabilitation Center has a walk score of 33. Somewhat walkable. A few nearby services may be reachable on foot, but most trips require transportation.

What is the occupancy rate at Heritage Park Care & Rehabilitation Center?

Heritage Park Care & Rehabilitation Center's occupancy is 76.4%.

Are there photos of Heritage Park Care & Rehabilitation Center?

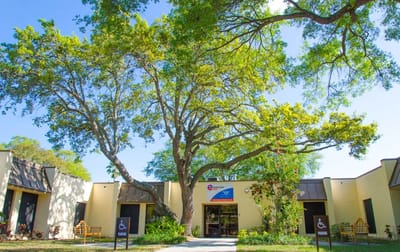
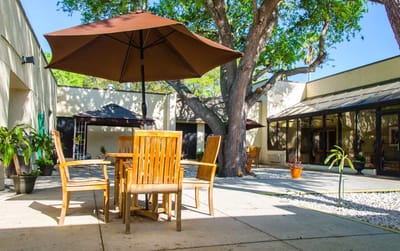
Yes — there are 6 photos of Heritage Park Care & Rehabilitation Center in the photo gallery on this page.

What is the phone number of Heritage Park Care & Rehabilitation Center?

(941) 792-8480 will put you in contact with the team at Heritage Park Care & Rehabilitation Center.

Is Heritage Park Care & Rehabilitation Center Medicare or Medicaid certified?

Yes — Heritage Park Care & Rehabilitation Center is a CMS-certified provider of Medicare and Medicaid.

Guides for Better Senior Living

Care Cost Calculator: See Prices in Your Area

Nursing Home Data Explorer

Don’t Wait Too Long: 7 Red Flag Signs Your Parent Needs Assisted Living Now

The True Cost of Assisted Living in 2025 – And How Families Are Paying For It

Understanding Senior Living Costs: Pricing Models, Discounts & Financial Assistance