Greenridge Estates
Nursing Home & Assisted Living · Lake Oswego, OR
CMS overall rating Info CMS (the Centers for Medicare & Medicaid Services) is the federal agency that rates nursing home quality. Its Overall Rating runs from 1 to 5 stars, combining health inspections, staffing, and quality measures, with inspections weighted most heavily.

Greenridge Estates

Nursing Home & Assisted Living · Lake Oswego, OR
CMS overall rating Info CMS (the Centers for Medicare & Medicaid Services) is the federal agency that rates nursing home quality. Its Overall Rating runs from 1 to 5 stars, combining health inspections, staffing, and quality measures, with inspections weighted most heavily.
Calculator: See prices in your area
Greenridge Estates accepts Medicare, Medicaid, and private pay.

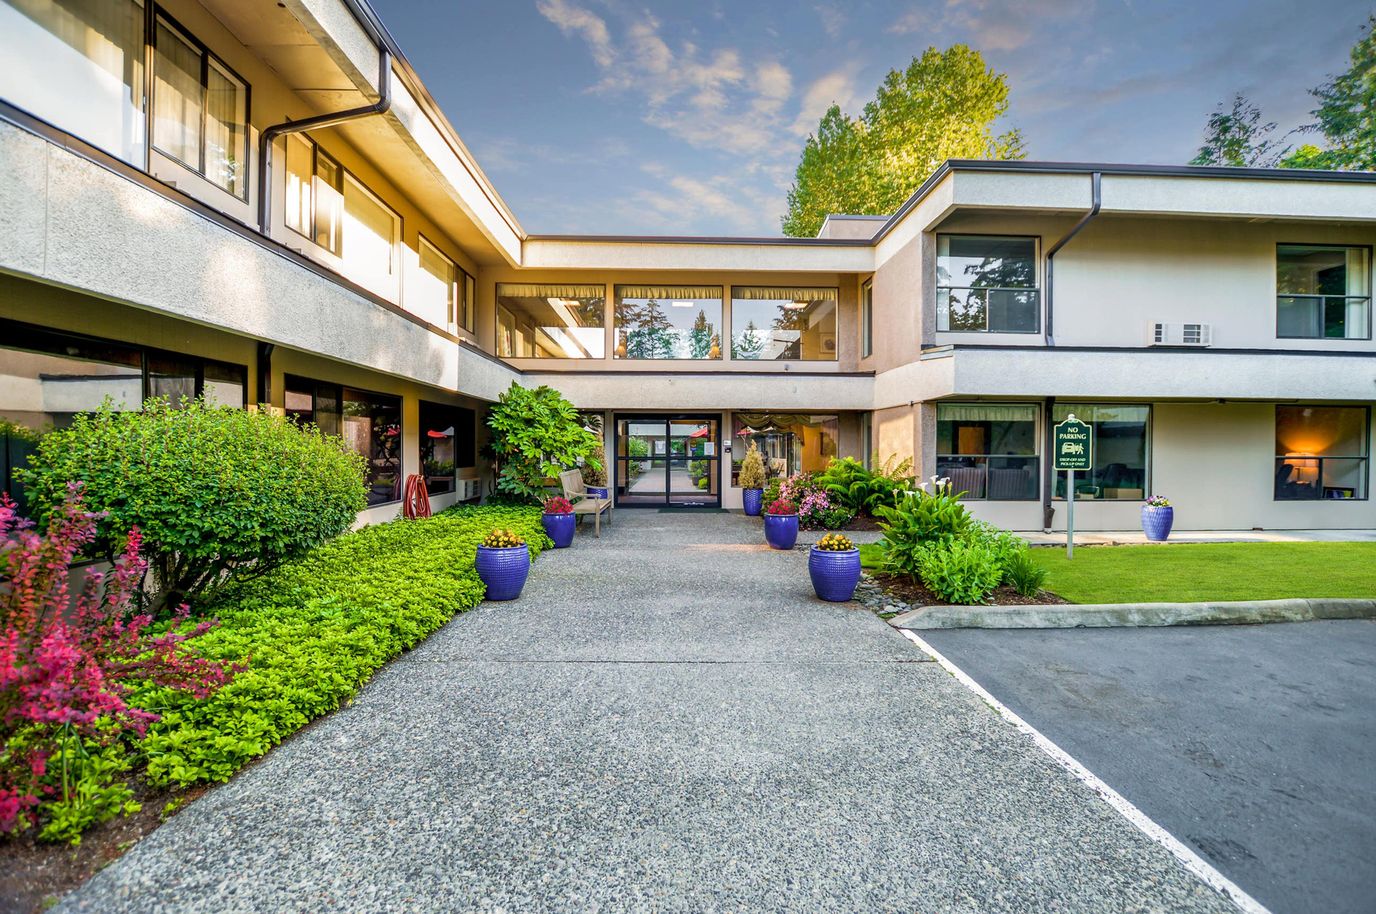
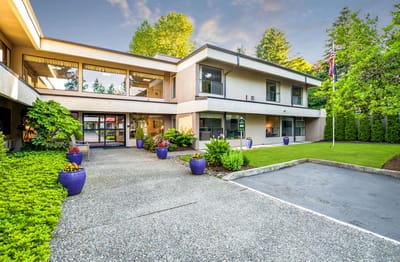
Overview of Greenridge Estates

Owned and operated by Greenridge Estates Operating, LLC, Greenridge Estates is an assisted living community in Lake Oswego, Oregon, that has been providing personal care and nursing care for 34 years. This 79-bed community is also located in a very walkable neighborhood where most errands can be accessed on foot. Medicare, Medicaid, and private pay are all accepted, offering families several payment options.

To support older adults who require nursing services, the community offers 24-hour staffing. Additionally, an average of 4 hours and 32 minutes of total nursing care is provided per day, along with 4 hours and 11 minutes of nurse aide assistance. This staffing structure also reflects a strong focus on direct daily care.

With an average resident stay of 71 days, the community is currently operating at 67.3% occupancy. This reflects that the community can support both short-term rehabilitation and skilled nursing needs.

An on-site gym, a restaurant-style dining option, and transportation services for appointments and outings are offered. Additionally, housekeeping and laundry services are provided to help simplify daily routines for residents and their families.

Concerns related to food safety, medication management, and care documentation were identified through state inspections. To get to know Greenridge Estates’ care options, lifestyle services, and overall daily environment, interested families are encouraged to conduct an in-person tour.

Quality ratings

Measured by Centers for Medicare & Medicaid Services (CMS)

Overall rating Info The Overall CMS Rating combines results from health inspections, staffing levels and quality measures. Health inspections carry the most weight. Staffing and quality scores can increase or decrease the final rating based on performance compared to state and national standards.
▲ 66.7% Above OR avg. ▲ 66.7% Above OR avg.OR average: 3.0Click the badge to see the full State ranking.Click here to see the full State ranking.
Health Inspection Info Based on the results of the facility's three most recent standard inspections and any complaint investigations. CMS reviews the number, scope, and severity of deficiencies, with more recent findings weighted more heavily.
▲ 44.7% Above OR avg. ▲ 44.7% Above OR avg.OR average: 2.8Click the badge to see the full State ranking.Click here to see the full State ranking.
Staffing Info Measures average nursing staff hours per resident per day, including Registered Nurses (RNs) and total nursing staff. Ratings are adjusted based on the level of care residents require and are compared to state and national benchmarks.
▲ 34.6% Above OR avg. ▲ 34.6% Above OR avg.OR average: 3.7Click the badge to see the full State ranking.Click here to see the full State ranking.
Quality Measures Info Based on clinical and physical health indicators reported to CMS, such as hospital readmissions, falls, pressure ulcers, and improvements in mobility. These measures reflect how well residents' health needs are being managed.
▲ 45.2% Above OR avg. ▲ 45.2% Above OR avg.OR average: 3.4Click the badge to see the full State ranking.Click here to see the full State ranking.

Staffing hours breakdown

Info Daily nursing hours per resident by staff type, reported to CMS. Higher is generally better — compare this facility to state and national averages to see where staffing stands.

Hours per resident per day — compared to Oregon state averages

Total nursing care / resident Info This home is ranked 85th out of 97 homes in Oregon for nurse hours. Total adjusted nursing hours per resident per day, combining RN, LPN, and aide time. CMS adjusts this for case-mix so facilities can be fairly compared.
4h 32m per day
Rank #85 / 97Nurse hours — State benchmarkedThis home is ranked 85th out of 97 homes in Oregon. Shows adjusted nurse hours per resident per day benchmarked to the Oregon average, with a ranking across 97 Oregon facilities. More hours mean more direct care. The national average is about 3.5 hrs; below 3.0 is a red flag.Rankings are based only on facilities in Oregon that report data for that category. Facilities without available data are excluded from the ranking.Click the rank badge to see the full State ranking.Click here to see the full State ranking.
This facility Oregon avg (5h 15m per day)
vs Oregon avg
-14%

1 of 6 metrics below state avg

Standout metric Physical Therapist is +216% above state avg
Staff typeHours / Day / Residentvs state avg
Registered Nurse (RN) Info RNs hold the highest nursing license and can assess residents, interpret test results, and direct care plans. More RN hours per day often signals stronger clinical oversight and faster response to health changes. 1h 11m per day ▲ 72% State avg: 42m per day · National avg: 41m per day
LPN / LVN Info Licensed Practical Nurses (LPNs) or Licensed Vocational Nurses (LVNs) deliver routine hands-on care — medication administration, wound dressing, and monitoring vital signs. They work under RN supervision and make up a large share of daily bedside care. 50m per day ▼ 10% State avg: 55m per day · National avg: 52m per day
Nurse Aide Info Certified Nurse Aides (CNAs) provide the most direct day-to-day assistance: bathing, dressing, feeding, and mobility. Nurse aide hours are typically the largest staffing category and directly affect residents' quality of life. 3h 26m per day ■ Avg State avg: 3h 27m per day · National avg: 2h 20m per day
Weekend Total Nursing Info Combined nursing hours (RN + LPN + Nurse Aide) per resident per day on weekends. Staffing often drops on weekends — this figure reveals whether the facility maintains adequate coverage outside of weekday hours. 4h 25m per day ■ Avg State avg: 4h 32m per day · National avg: 3h 27m per day
Physical Therapist Info Hours per resident per day provided by licensed Physical Therapists (PTs) or PT Assistants. PT services help residents recover mobility after injury or illness and are especially important for post-acute (short-stay) rehabilitation. 17m per day ▲ 216% State avg: 5m per day · National avg: 4m per day
Weekend RN Info Registered nurse hours specifically on weekends. Facilities sometimes reduce RN presence on Saturdays and Sundays — a low weekend RN figure compared to weekday hours can indicate reduced clinical oversight when most administrative staff are absent. 47m per day ▲ 74% State avg: 27m per day · National avg: 29m per day

Capacity and availability

Avg. Length of Stay Info Average number of days residents stay at this facility, based on CMS cost report data. Shorter stays often reflect post-acute or rehab care; longer stays reflect long-term care.
71 days
Bed community size
79-bed community Rank #113 / 351Bed count — State benchmarkedThis home is ranked 113th out of 351 homes in Oregon. Shows this facility's certified or reported bed count compared to other Oregon facilities. Larger communities may offer more amenities, programs, and on-site services for residents and families.Rankings are based only on facilities in Oregon that report data for that category. Facilities without available data are excluded from the ranking.Click the rank badge to see the full State ranking.Click here to see the full State ranking.
A larger shared setting that may offer more common spaces and organized community services.
Years in operation
34 years in operation Rank #47 / 374Years in operation — State benchmarkedThis home is ranked 47th out of 374 homes in Oregon. Shows how long this facility has been in operation compared to other Oregon facilities. Longer operating histories may benefit residents, families, and staff.Rankings are based only on facilities in Oregon that report data for that category. Facilities without available data are excluded from the ranking.Click the rank badge to see the full State ranking.Click here to see the full State ranking.
A longer operating history, which may indicate experience navigating regulations and delivering ongoing care.
Walk Score
Walk Score: 73 / 100 Rank #136 / 476Walk Score — State benchmarkedThis home is ranked 136th out of 476 homes in Oregon. Shows how walkable this facility's neighborhood is compared to the average Walk Score across Oregon facilities. Higher scores benefit residents, families, and staff.Rankings are based only on facilities in Oregon that report data for that category. Facilities without available data are excluded from the ranking.Click the rank badge to see the full State ranking.Click here to see the full State ranking.
Very walkable. Most errands can be accomplished on foot, and many essentials are within a short walk.

About this community

Occupancy

Occupancy rate
67%
Rank #42 / 95Occupancy rate — State benchmarkedThis home is ranked 42nd out of 95 homes in Oregon. Shows this facility's occupancy rate versus the Oregon average, with its Statewide rank out of 95. Higher occupancy signals strong local demand and financial stability.Rankings are based only on facilities in Oregon that report data for that category. Facilities without available data are excluded from the ranking.Click the rank badge to see the full State ranking.Click here to see the full State ranking.
Similar to the Oregon average: 65.7%
Occupied beds
53 / 79
Average occupied beds in Oregon homes 55 beds

License Details

Facility TypeAssisted Living Facility
StatusActive
IssuanceJune 3, 1992
CountyClackamas
License Number70M034

Ownership & Operating Entity

Greenridge Estates is administered by Jennifer Scruggs.

Owner NameGreenridge Estates Operating, LLC

Safety & Compliance

Emergency SystemsYes

Staffing & Medical

2 services
Licensed Nurses/CNAs
24-Hour Staffing

Contact Information

Additional Policies & Features

Pets Allowed
HousekeepingYes
Linen ServiceYes
Utilities IncludedYes

Amenities & Lifestyle

Gym
Restaurant
Transportation
Housekeeping
Laundry

Contact Greenridge Estates

Inspection History

In Oregon, the Department of Human Services, Aging and People with Disabilities performs unannounced surveys and regular inspections to ensure resident safety in all care settings.

Since 2021 · 5 years of data 54 deficiencies 8 inspections

Inspection Scorecard Info This scorecard compares key inspection, deficiency, and complaint metrics at this facility against the Oregon state average. Metrics rated ≥15% worse than average are highlighted in red; those ≥15% better are highlighted in green.

Since 2021 vs. Oregon state average
Overall vs. OR average 3 Worse Metrics worse than Oregon average:
• Total deficiencies (74% above)
• Deficiencies per year (74% above)
• Deficiencies per inspection (55% above)
0 Better No metrics in this bucket.
Latest Inspection October 14, 2025

Deficiencies Info Deficiencies are formal regulatory issues recorded during state inspections.

This FacilityOR Averagevs. OR Avg
Total deficiencies Info Formal regulatory issues recorded by inspectors across all inspection types. 5431 This facility has 74% more total deficiencies than a typical Oregon assisted living residence (54 vs. OR avg 31).↑ 74% worse
Deficiencies per year Info Average deficiencies per year since 2021. 10.86.2 This facility has 74% more deficiencies per year than a typical Oregon assisted living residence (10.8 vs. OR avg 6.2).↑ 74% worse
Deficiencies per inspection Info Average deficiencies per inspection. 6.84.4 This facility has 55% more deficiencies per inspection than a typical Oregon assisted living residence (6.8 vs. OR avg 4.4).↑ 55% worse

Inspections Info State inspections evaluate whether the facility meets health and safety standards.

This FacilityOR Averagevs. OR Avg
Total inspections Info Combined count of all routine and focused inspections. Excludes complaint investigations. 87 This facility has had 14% more total inspections than the Oregon average (8 vs. OR avg 7). More inspections can mean more regulatory scrutiny rather than worse care.↑ 14% more

Inspection Reports Summary Info An editor-reviewed summary of the themes and findings across this facility's recent inspection reports.

  • October 14, 2025 inspection found one deficiency related to licensing complaint investigation with no complaints substantiated.
  • April 30, 2025 inspection cited two deficiencies for poor kitchen sanitation, improper food storage, and staff hygiene violations requiring deep cleaning and infection control training.
  • March 5, 2024 complaint investigation revealed 13 deficiencies including medication errors, staffing shortages, incomplete records, and infection prevention lapses.

Health Inspection History

Inspections since 2018
Total health inspections 3

Oregon average 5.1


Last Health inspection on Aug 2024

Total health citations
32 Rank #44 / 95Health citations — State benchmarkedThis home is ranked 44th out of 95 homes in Oregon. Shows this facility's total health deficiency citations benchmarked to the Oregon State average, with a ranking across all 95 OR facilities. Lower citation counts earn a better rank.Rankings are based only on facilities in Oregon that report data for that category. Facilities without available data are excluded from the ranking.Click the rank badge to see the full State ranking.Click here to see the full State ranking.

Oregon average 34

Citations per inspection
10.67 Rank #83 / 95Citations per inspection — State benchmarkedThis home is ranked 83rd out of 95 homes in Oregon. Shows average deficiency citations per CMS inspection for this facility versus the Oregon mean across 95 facilities with citation data. Lower is better.Rankings are based only on facilities in Oregon that report data for that category. Facilities without available data are excluded from the ranking.Click the rank badge to see the full State ranking.Click here to see the full State ranking.

Oregon average 6.86


Health citations are formal notices following inspections when they fail to comply with safety and care standards.

17 of 32 citations resulted from standard inspections; and 15 of 32 came from combined inspections (standard and complaint).

Breakdown of citation severity (last 8 years)
Critical health citations
0
100% better than Oregon average

Oregon average: 0.5


Serious health citations
2
67% worse than Oregon average

Oregon average: 1.2

0 critical citations Oregon average: 0.5

2 serious citations Oregon average: 1.2

30 moderate citations Oregon average: 32.1

0 minor citations Oregon average: 0.2
Citations history (last 8 years)
Abuse/Neglect moderate citation Aug 16, 2024
Corrected

Infection Control moderate citation Aug 16, 2024
Corrected

Nursing Services moderate citation Aug 16, 2024
Corrected

Nutrition moderate citation Aug 16, 2024
Corrected

Staffing Data

Reporting period: October 1 – December 31, 2025 (Q4 2025). Source: CMS Payroll-Based Journal report.

Total staff 100
Employees 95
Contractors 5
Staff to resident ratio 2.63 : 1
10% fewer staff per resident than Oregon average
Oregon average ratio: 2.93 : 1 Oregon average ratio: 2.93 : 1See full Oregon ranking
Avg staff/day 32
Average shift 7.8 hours
0% compared with Oregon average
Oregon average: 7.8 hours Oregon average shift: 7.8 hoursSee full Oregon ranking
Total staff hours (quarter) 23,020

Nursing staff breakdown

Q4 2025 · Oct 1 – Dec 31 More info This data comes from the CMS Payroll-Based Journal report covering October 1 – December 31, 2025.
Registered Nurse

Manages medical care and health needs.

RN Staff Info 11 total: 10 full-time employees and 1 contractor. 11
Average shift length Info Average shift length. Calculated as total hours divided by days worked and average staff per day. 9.4 hours
Licensed Practical Nurse

Assists with medical care and medications.

LPN Staff Info 12 total: 10 full-time employees and 2 contractors. 12
Average shift length Info Average shift length. Calculated as total hours divided by days worked and average staff per day. 9.1 hours
Certified Nursing Assistant

Helps with daily care and mobility.

CNA Staff Info All 34 CNA Staff are full-time employees. No contractors work on this role. 34
Average shift length Info Average shift length. Calculated as total hours divided by days worked and average staff per day. 8 hours

Contractor staffing

Q4 2025 · Oct 1 – Dec 31 More info This data comes from the CMS Payroll-Based Journal report covering October 1 – December 31, 2025.

Total hours from contractors

3.4%

781 contractor hours this quarter

Licensed Practical Nurse: 2 Registered Nurse: 1 Medical Director: 1 Occupational Therapy Assistant: 1

Staff by category

Q4 2025 · Oct 1 – Dec 31 More info This data comes from the CMS Payroll-Based Journal report covering October 1 – December 31, 2025.
Certified Nursing Assistant340349,97892100%8
Registered Nurse101112,7158997%9.4
Licensed Practical Nurse102122,1358795%9.1
Nurse Aide in Training110111,3847986%8.1
Respiratory Therapy Technician4049917177%7.1
Clinical Nurse Specialist2029017683%7.2
Physical Therapy Assistant8087616874%7.2
RN Director of Nursing1017046571%10.8
Mental Health Service Worker2025366470%7.9
Other Dietary Services Staff2025056571%5.1
Dietitian1014916368%7.8
Administrator1014595964%7.8
Nurse Practitioner1014575863%7.9
Medication Aide/Technician1013934246%9.3
Qualified Social Worker3032735155%5.1
Physical Therapy Aide2021672426%6.9
Occupational Therapy Aide1011153942%3
Occupational Therapy Assistant011263942%0.7
Medical Director011232426%1
Speech Language Pathologist101922%4.5
34 Certified Nursing Assistant
% of Days 100%
11 Registered Nurse
% of Days 97%
12 Licensed Practical Nurse
% of Days 95%
11 Nurse Aide in Training
% of Days 86%
4 Respiratory Therapy Technician
% of Days 77%
2 Clinical Nurse Specialist
% of Days 83%
8 Physical Therapy Assistant
% of Days 74%
1 RN Director of Nursing
% of Days 71%
2 Mental Health Service Worker
% of Days 70%
2 Other Dietary Services Staff
% of Days 71%
1 Dietitian
% of Days 68%
1 Administrator
% of Days 64%
1 Nurse Practitioner
% of Days 63%
1 Medication Aide/Technician
% of Days 46%
3 Qualified Social Worker
% of Days 55%
2 Physical Therapy Aide
% of Days 26%
1 Occupational Therapy Aide
% of Days 42%
1 Occupational Therapy Assistant
% of Days 42%
1 Medical Director
% of Days 26%
1 Speech Language Pathologist
% of Days 2%

Penalties and fines

Federal penalties imposed by CMS for regulatory violations, including civil money penalties (fines) and denials of payment for new Medicare/Medicaid admissions.

Source: CMS Penalties Database (Data as of Jan 2026)

Total fines amount $13K Rank #49 / 98Federal fines — State benchmarkedThis home is ranked 49th out of 98 homes in Oregon. Shows this facility's cumulative CMS federal fine dollars versus the Oregon average among facilities with fines, and where it ranks among 98 facilities in the pool. Lower total dollars mean a better rank.Rankings are based only on facilities in Oregon that report data for that category. Facilities without available data are excluded from the ranking.Click the rank badge to see the full State ranking.Click here to see the full State ranking.
78% lower than Oregon average

Oregon average: $60K

Number of fines 2
18% more fines than Oregon average

Oregon average: 1.7

Payment Denials Info Serious action where Medicare and/or Medicaid temporarily stops payments for new residents until issues are fixed. 0
100% fewer payment denials than Oregon average

Oregon average: 0.1

Fines amount comparison
This facility $13K
Oregon average $60K

No penalties in the past 3 years

No civil money penalties or payment denials were reported in the last 3 years.

Quality of care over time

These measures show how residents usually do over time at this home, based on health outcomes and preventive care.

High-risk clinical events score Info A composite score based on pressure ulcers, falls with injury, weight loss, walking ability decline, and activities of daily living decline. 7.8
26% better than Oregon average

Oregon average: 10.5

Functional decline score Info A composite score based on activities of daily living decline, walking ability decline, and incontinence. 12.8
39% better than Oregon average

Oregon average: 21.1

Long-stay resident measures
Need for Help with Daily Activities Increased Info Percent of long-stay residents whose need for help with daily activities has increased 6.5%
60% better than Oregon average

Oregon average: 16.3%

Walking Ability Worsened Info Percent of long-stay residents whose ability to move independently worsened 24.0%
In line with Oregon average

Oregon average: 24.9%

Low Risk Residents with Bowel/Bladder Incontinence Info Percent of low risk long-stay residents who lose control of their bowels or bladder 7.9%
65% better than Oregon average

Oregon average: 22.6%

Falls with Major Injury Info Percent of long-stay residents experiencing one or more falls with major injury 0.0%
100% better than Oregon average

Oregon average: 2.4%

High Risk Residents with Pressure Ulcers Info Percent of long-stay high risk residents with pressure ulcers 7.5%
8% worse than Oregon average

Oregon average: 6.9%

Urinary Tract Infection Info Percent of long-stay residents with a urinary tract infection 2.8%
35% worse than Oregon average

Oregon average: 2.1%

Lost Too Much Weight Info Percent of long-stay residents who lose too much weight 1.1%
79% better than Oregon average

Oregon average: 5.3%

Depressive Symptoms Info Percent of long-stay residents who have depressive symptoms 3.0%
36% better than Oregon average

Oregon average: 4.6%

Antipsychotic Use Info Percent of long-stay residents who received an antipsychotic medication 4.9%
63% better than Oregon average

Oregon average: 13.2%

Pneumococcal Vaccine Info Percent of long-stay residents assessed and appropriately given the pneumococcal vaccine 100.0%
In line with Oregon average

Oregon average: 95.7%

Influenza Vaccine Info Percent of long-stay residents assessed and appropriately given the seasonal influenza vaccine 100.0%
5% better than Oregon average

Oregon average: 95.2%

Short-stay resident measures
Pneumococcal Vaccine Info Percent of short-stay residents assessed and appropriately given the pneumococcal vaccine 100.0%
16% better than Oregon average

Oregon average: 86.2%

Antipsychotic medication increase Info Percent of short-stay residents who newly received an antipsychotic medication 0.4%
76% better than Oregon average

Oregon average: 1.8%

Influenza Vaccine Info Percent of short-stay residents assessed and appropriately given the seasonal influenza vaccine 98.7%
21% better than Oregon average

Oregon average: 81.2%

Breakdown by payment type

Medicare

43% of new residents, usually for short-term rehab.

Typical stay 1 months

Private pay

46% of new residents, often for short stays.

Typical stay 1 - 2 months

Medicaid

11% of new residents, often for long-term daily care.

Typical stay 9 - 10 months

Facility Characteristics

Source: CMS Long-Term Care Facility Characteristics (Data as of Jan 2026)

Total residents 38
Medicare
9
23.7% of residents
Medicaid
23
60.5% of residents
Private pay or other
6
15.8% of residents
Programs & Services
Residents Group

Residents meet regularly to discuss policies, care quality, and activities

Nurse Aide Training

State-approved Nurse Aide Training and Competency Evaluation Program on-site

Active Resident Council

Organized group of residents that meets regularly to discuss facility policies, quality of life, and activities.

Finances and operations

Based on CMS SNF Cost Report for fiscal year ending in 12/2023.

For-profit
Operated by a single business entity.
Net patient revenue Info Net patient revenue — what the home actually collects for resident care, after contractual allowances, bad debt and discounts are subtracted from its gross charges (CMS cost report, Worksheet G-3). It covers resident care only; money the home earns from other sources is shown separately as "Other income."
$6.9M
Net patient income Info Net patient income: net patient revenue minus the home's total operating expenses. A positive figure means it earns more from resident care than it spends to deliver it; a negative figure means the opposite. It excludes non-operating "other income."
-$114.9K
For-profit Operated by a single business entity.
Net patient revenue Info Net patient revenue — what the home actually collects for resident care, after contractual allowances, bad debt and discounts are subtracted from its gross charges (CMS cost report, Worksheet G-3). It covers resident care only; money the home earns from other sources is shown separately as "Other income."
$6.9M Rank #80 / 93Revenue — State benchmarkedThis home is ranked 80th out of 93 homes in Oregon. Shows this facility's annual revenue compared to the Oregon average. Higher revenue generally means more resources for staffing and capital — read alongside Payroll %.Rankings are based only on facilities in Oregon that report data for that category. Facilities without available data are excluded from the ranking.Click the rank badge to see the full State ranking.Click here to see the full State ranking.
Net patient income Info Net patient income: net patient revenue minus the home's total operating expenses. A positive figure means it earns more from resident care than it spends to deliver it; a negative figure means the opposite. It excludes non-operating "other income."
-$114.9K
Other income Info Money the home earns outside of resident care — such as investments, grants, rentals and other non-operating sources (CMS cost report, Worksheet G-3). It is tracked separately from net patient revenue: it is not part of that figure, and it is not included in net patient income.
$438.5K
Payroll costs Info Staff salaries plus wage-related costs — benefits such as payroll taxes, health insurance and retirement — from the home's own accounting records (CMS cost report, Worksheet A). Contract or agency labor is counted separately, under other operating costs. Rank #58 / 93Payroll — State benchmarkedThis home is ranked 58th out of 93 homes in Oregon. Shows total annual staff payroll benchmarked to the Oregon average. Higher payroll investment relative to peers often signals better staffing and less reliance on cheaper contract labor.Rankings are based only on facilities in Oregon that report data for that category. Facilities without available data are excluded from the ranking.Click the rank badge to see the full State ranking.Click here to see the full State ranking.
$3.5M 50.5% of net patient revenue Info Payroll as a share of revenue: staff salaries and wage-related benefits divided by net patient revenue. A higher figure means more of each revenue dollar goes to staff pay. Rank #5 / 93Payroll % — State benchmarkedThis home is ranked 5th out of 93 homes in Oregon. Shows payroll as a percentage of revenue versus the Oregon average. Well-run Oregon facilities typically land around 51–62% — the top third Statewide. Below 25% may signal understaffing or heavy agency use — read with Staffing ratings.Rankings are based only on facilities in Oregon that report data for that category. Facilities without available data are excluded from the ranking.Click the rank badge to see the full State ranking.Click here to see the full State ranking.
Other operating costs Info Everything it costs to run the home apart from payroll — food, utilities, supplies, maintenance, contract labor and administration. Calculated as total operating expense minus payroll (staff salaries and wage-related benefits).
$3.5M
Total costs Info The home's total operating expense for the year — all the costs of running it, salaries included (CMS cost report, Worksheet G-3).
$7.0M

Who this home usually serves

TYPE OF STAY

Mix of rehab and long-term care

This home supports both short-term rehab and long-term care, with residents staying for a wide range of durations.

New residents most often arrive under private pay (46% of admissions), and a typical private pay stay runs around 1 - 2 months.

Admissions
178 total

Coverage residents most often arrive under.

Medicare 43%
Private pay 46%
Medicaid 11%
Discharges
173 total

Coverage residents most often leave under.

Medicare 39%
Private pay 46%
Medicaid 16%

Places of interest near Greenridge Estates

Address 2.8 miles from city center Info Estimated distance in miles from Lake Oswego's city center to Greenridge Estates's address, calculated via Google Maps.

Calculate Travel Distance to Greenridge Estates

Add your location

Address

Financial Assistance for
Assisted Living in Oregon

Greenridge Estates is located in LAKE OSWEGO, Oregon.
Here are the financial assistance programs available to residents in Oregon.

Get Financial aid guidance

Oregon Project Independence (OPI)

OPI

Age 60+
General Oregon resident, at risk of nursing home but not Medicaid-eligible.
Income Limits ~$2,000/month individual, varies
Asset Limits $5,000 individual
OR

Cost-sharing required; rural/urban balance.

Benefits
In-home care (3-5 hours/week) Respite (up to 10 days/year) Adult day care (~$70/day) Transportation (~5 trips/month)

Oregon Medicaid Community-Based Care

OR Medicaid CBC

Age 65+ or disabled
General Oregon resident, Medicaid-eligible, nursing home-level care need.
Income Limits (2025) ~$2,829/month 300% FBR, individual
Asset Limits $2,000 (individual), $3,000 (couple).
OR

High demand in urban areas (e.g., Portland).

Benefits
Personal care (5-7 hours/day) Respite (240 hours/year) Adult day care ($70/day) Home modifications ($1,500 avg.)

Program of All-Inclusive Care for the Elderly (PACE)

Oregon PACE (e.g., Providence ElderPlace)

Age 55+
General OR resident (specific counties), NFLOC, safe with PACE support.
Income Limits (2025) ~$2,829/month (Medicaid-eligible); private pay option available.
Asset Limits $2,000 (individual), $3,000 (couple) for Medicaid enrollees.
OR

Available in 11 counties (e.g., Multnomah, Washington); Providence ElderPlace dominant provider.

Benefits
Personal care (5-7 hours/day) Medical care Meals Transportation Respite Therapies

Medicare Savings Program (MSP)

Oregon Medicare Savings Program

Age 65+ or disabled
General OR resident, Medicare Part A/B.
Income Limits (2025) ~$2,510/month (QMB), ~$3,380/month (SLMB), ~$3,598/month (QI)—individual.
Asset Limits $9,430 (individual), $14,130 (couple).
OR

Three tiers; includes Extra Help for Part D; no waitlist.

Benefits
Covers Part B premiums ($174.70/month) Deductibles ($240/year) Copays (~20%)

Family Caregiver Support Program (FCSP)

Oregon Family Caregiver Support Program

Age
General Caregivers of 60+ needing care or 55+ caregivers of others; OR resident; functional needs (2+ ADLs).
Income Limits (2025) No strict cap; prioritizes low-income ~$24,980/year
Asset Limits Not assessed; need-based.
OR

15 regions; rural priority; includes grandparent caregivers.

Benefits
Respite (4-6 hours/week or 5 days/year) Adult day care ($60/day) Training Supplies (~$500/year)

VA Aid and Attendance (A&A) and Housebound Benefits

Oregon VA Aid and Attendance/Housebound

Age 65+ or disabled veteran/spouse
General OR resident, wartime service, need for ADL help (A&A) or homebound.
Income Limits (2025) Net income < ~$1,984/month (veteran with dependent, A&A); pension offsets income.
Asset Limits ~$155,356 net worth limit
OR

High veteran demand; Oregon Veterans’ Homes option.

Benefits
Cash (~$1,433-$2,642/month veteran, ~$951-$1,318 spouse) for care costs (e.g., in-home, assisted living)

Senior Property Tax Deferral Program

Oregon Property Tax Deferral for Disabled and Senior Citizens

Age 62+
General OR resident, homeowner 5+ years, low-income.
Income Limits (2025) ~$58,000/year household, adjusted annually
Asset Limits Home value < county median; equity > 15%.
OR

Deferred taxes accrue 6% interest; repaid upon sale/death.

Benefits
Tax deferral (~$1,000-$3,000/year avg., varies by county)

Elderly Nutrition Program (ENP)

Oregon Elderly Nutrition Program

Age 60+
General OR resident (or spouse of any age); no income limit.
Income Limits (2025) None; donations encouraged.
Asset Limits Not assessed.
OR

Includes Meals on Wheels; prioritizes homebound/low-income.

Benefits
Home-delivered or congregate meals (~$5-$7/meal value, 5 meals/week avg.)

Frequently Asked Questions about Greenridge Estates

Who is the owner of Greenridge Estates?

Greenridge Estates is legally operated by Greenridge Estates Operating, LLC, and administered by Jennifer Scruggs.

Is Greenridge Estates in a walkable area?

Greenridge Estates has a walk score of 73. Very walkable. Most errands can be accomplished on foot, and many essentials are within a short walk.

What is the license number of Greenridge Estates?

According to OR state health department records, Greenridge Estates's license number is 70M034.

What is the occupancy rate at Greenridge Estates?

Greenridge Estates's occupancy is 67%.

What is the best email address for Greenridge Estates?

The team at Greenridge Estates can be reached at jscruggs@greenridgeestates.com.

Does Greenridge Estates operate as a for-profit or non-profit?

Greenridge Estates is registered as a for-profit in OR.

Who is the administrator of Greenridge Estates?

Jennifer Scruggs is the administrator of Greenridge Estates.

Guides for Better Senior Living

Care Cost Calculator: See Prices in Your Area

Nursing Home Data Explorer

Don’t Wait Too Long: 7 Red Flag Signs Your Parent Needs Assisted Living Now

The True Cost of Assisted Living in 2025 – And How Families Are Paying For It

Understanding Senior Living Costs: Pricing Models, Discounts & Financial Assistance