Explore Open Rooms
1 Contact details
2 What type of senior care service are you looking for?
3 What budget do you have in mind for senior care?
4 How soon do you need to find care?
5 Additional details

Thank you for your interest!

Our team will be in touch shortly to help with next steps.

Nursing Home in Waco

CMS overall rating Info The Overall CMS Rating combines results from health inspections, staffing levels and quality measures. Health inspections carry the most weight. Staffing and quality scores can increase or decrease the final rating based on performance compared to state and national standards.

Greenview Nursing and Rehab

Overview of Greenview Nursing and Rehab

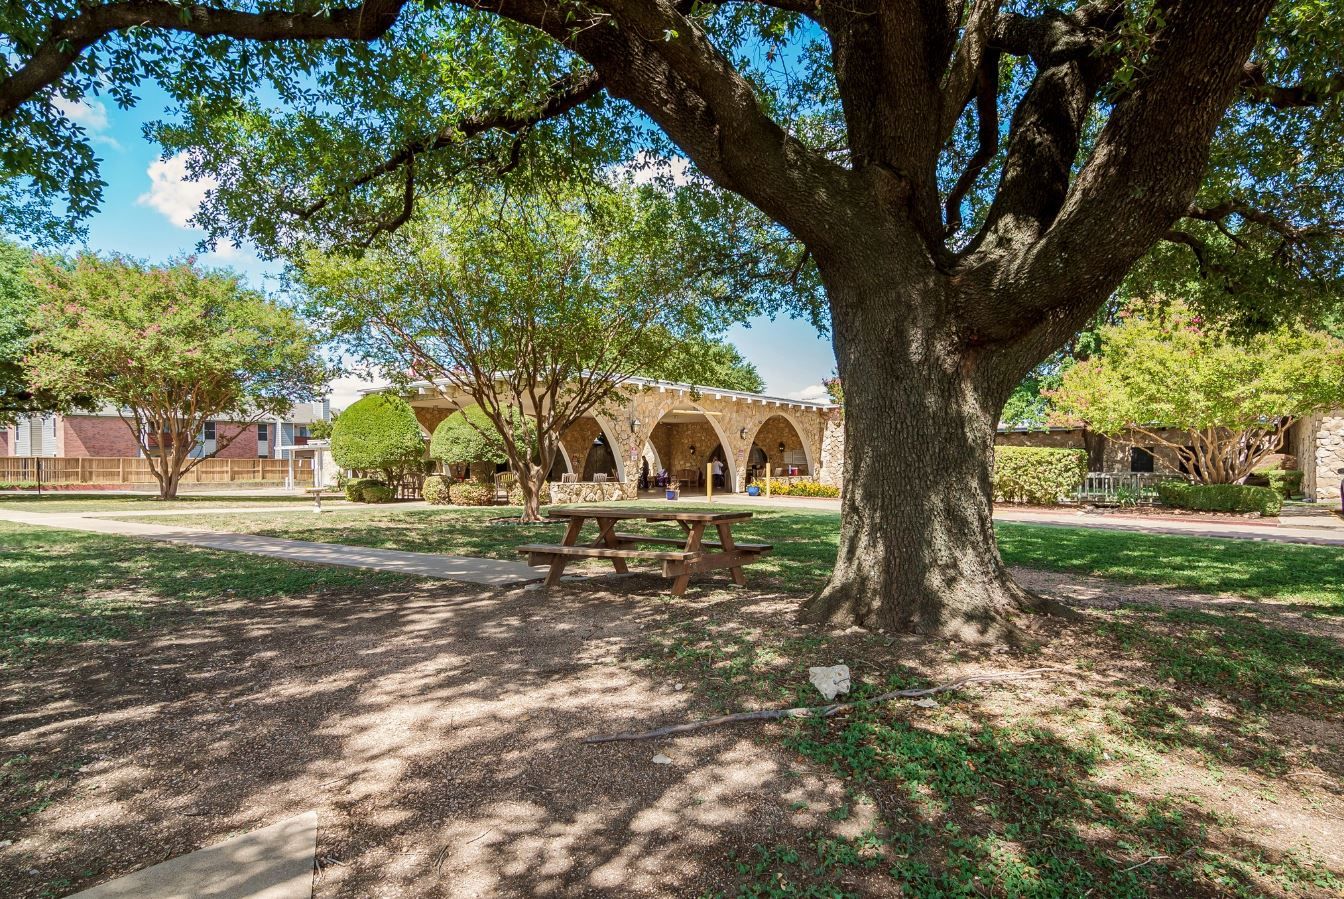
Nestled in the tranquil Owen Lane, Waco, TX, Greenview Nursing and Rehab is committed to providing exceptional care services including skilled nursing, rehabilitation, and long- and short-term care. Featuring elegant and spacious rooms, the community ensures the comfort and safety of its residents. Greenview Nursing and Rehab boasts a team of compassionate and highly skilled professionals consisting of licensed nurses, therapists, and social workers.

The community values the individuality of each resident, collaborating with them to devise a care plan that best matches their specific needs. Moreover, seniors may let go of their worries and their loved ones at ease with 24-hour care and assistance available onsite. Delightful and nutritious meals are served to cater to residents’ dietary needs and preferences. Greenview Nursing and Rehab provides an ideal place to heal and relax with its beautiful surroundings and wonderful amenities such as a therapy room and spacious lounge.

(254) 772-8900

Managed by Braden Wills

Administrator

Braden Wills serves as the Administrator at Greenview Nursing and Rehab, leading a team dedicated to personalized care and holistic healing. Under his leadership, the community emphasizes a family-like environment and customized therapy plans to support recovery. He also ensures transparent communication and safety measures during the COVID-19 pandemic to protect residents, families, and staff.

Quality ratings

Measured by Centers for Medicare & Medicaid Services (CMS)

Overall rating Info The Overall CMS Rating combines results from health inspections, staffing levels and quality measures. Health inspections carry the most weight. Staffing and quality scores can increase or decrease the final rating based on performance compared to state and national standards.
1/5
Texas average: 3.0/5
Health Inspection Info Based on the results of the facility's three most recent standard inspections and any complaint investigations. CMS reviews the number, scope, and severity of deficiencies, with more recent findings weighted more heavily.
1/5
Texas average: 2.9/5
Staffing Info Measures average nursing staff hours per resident per day, including Registered Nurses (RNs) and total nursing staff. Ratings are adjusted based on the level of care residents require and are compared to state and national benchmarks.
1/5
Texas average: 2.4/5
Quality Measures Info Based on clinical and physical health indicators reported to CMS, such as hospital readmissions, falls, pressure ulcers, and improvements in mobility. These measures reflect how well residents' health needs are being managed.
1/5
Texas average: 4.0/5

Nursing care per resident

Info This shows how many total hours of nursing staff time are available per resident each day. Higher numbers usually mean more staff support.
3h 17m per day

This home provides 13% less nursing time per resident than the Texas average.

Texas average: 3h 47m per day

Staffing hours breakdown

Info Hours of care per resident per day, broken down by staff type. Data from CMS Medicare.
Staff type Facility State avg National avg
Registered Nurse (RN) Info Registered nurse hours per resident per day. 26m per day 26m per day 41m per day
Nurse Aide Info Nurse aide hours per resident per day. 1h 41m per day 2h 1m per day 2h 21m per day
Total Nursing (Weekend) Info Total number of nurse staff hours per resident per day on weekends. 2h 35m per day 2h 59m per day 3h 26m per day
Physical Therapist Info Physical therapist staff hours per resident per day. 9m per day 4m per day 4m per day
RN (Weekend) Info Registered nurse hours per resident per day on weekends. 23m per day 21m per day 29m per day

Capacity and availability

Medium-capacity home

Offers a balance of services and community atmosphere.

Total beds 128

This home usually has availability

Lower occupancy suggests more openings may be available.

Lower demand than the Texas average
Occupancy rate 69.9%
Residents per day (avg) 91
Occupancy rate
69.9%
Residents per day (avg)
91

Who this home usually serves

TYPE OF STAY

Mostly long-term care residents

Most residents stay for extended periods and receive ongoing daily care.

Might be optimal for
Long-term daily care Ongoing support needs

Breakdown by payment type

Medicare

21% of new residents, usually for short-term rehab.

Typical stay 21 days

Private pay

35% of new residents, often for short stays.

Typical stay 2 - 3 months

Medicaid

44% of new residents, often for long-term daily care.

Typical stay 10 - 11 months

Finances and operations

Governmental community
Operated by state authorities.
Home revenue
$10.6M
Surplus of revenue
$17.5K
Governmental community Operated by state authorities.
Home revenue
$10.6M
Surplus of revenue
$17.5K
Payroll costs Info The portion of the home's budget spent on staff, including nurses, caregivers, and other employees who support care and operations.
$1
0% of revenue
Other operating costs Info All remaining costs needed to run the home, such as food, utilities, building maintenance, supplies and administrative expenses.
$10.6M
Total costs $10.6M
Bed community size
128-bed community
A larger shared setting that may offer more common spaces and organized community services.
Years in operation
52 years in operation
A longer operating history, which may indicate experience navigating regulations and delivering ongoing care.
Walk Score
Walk Score: 55 / 100
Moderately walkable. Some errands can be accomplished on foot, with a mix of nearby amenities.

Services

Medicare/medicaid

About this community

License Details

Facility TypeNursing
StatusActive
IssuanceJanuary 4, 2025
ExpirationJanuary 4, 2028
CountyMCLENNAN

Additional Licensing Details

License Number308533
Year Opened6/2/1973

Ownership & Operating Entity

Greenview Nursing and Rehab is administrated by Deanna Truax.

Management CompanyRICHLAND NURSING AND REHAB CENTER LLC
OwnerFANNIN COUNTY HOSPITAL AUTHORITY
Ownership TypeHOSPITAL DISTRICT/AUTHORITY

Type Of Units

Medicare
2 units
Medicaid and Medicare
126 units
Total beds
128 units

Staffing

Key information about the people who lead and staff this community.

Leadership

Payment & Insurance

2 services
Accept Medicaid
Accept Medicare

Therapy & Rehabilitation

1 service
Rehabilitation Services

Staffing & Medical

2 services
Skilled Nursing
24-Hour Staffing

Additional Services

2 services
Rehabilitation Therapy
Long-Term & Short-Term Care

Amenities & Lifestyle

0 amenities
Specific ProgramsSkilled Nursing, Rehabilitation Therapy, Long-Term & Short-Term Care

Pricing & Financial Information

What does this home offer?

Building type icon
Building type icon

Building Type: Single-story

Fitness and recreation icon

Fitness and Recreation

Types of Care at Greenview Nursing and Rehab

Skilled Nursing

Access & Eligibility

Ways to qualify for care at this community, including accepted programs and payment options.

Medicaid Accepted

This facility is certified for eligible Medicaid services.

Medicare Accepted

This facility is certified for eligible Medicare services.

Payment & Funding Options

Medicaid Medicare Long-term care insurance

Inspection History

In Texas, the Health and Human Services Commission (HHSC) is the primary regulatory body that conducts unannounced inspections and publishes quality reports for all long-term care homes.

21 visits/inspections

7 visits/inspections triggered by complaints

7 routine inspections

Results

19 with issues

2 without issues

Latest inspection

Date October 17, 2025
Routine

45 deficiencies

Deficiencies indicate regulatory issues. A higher number implies the facility had several areas requiring improvement.

Texas average: 32 deficiencies

Health Inspection History

Inspections
Total health inspections 18

Texas average 7.4


Last Health inspection on Sep 2025

Total health citations 37

Texas average 25.9

Citations per inspection
2.06

Texas average 3.67


Health citations are formal notices following inspections when they fail to comply with safety and care standards.

11 of 37 citations resulted from standard inspections; and 26 of 37 resulted from complaint investigations.

Breakdown of citation severity (last 3 years)
Critical Health citations More info 3
50% worse than Texas average

Texas average: 2


Serious Health citations More info 5
1150% worse than Texas average

Texas average: 0.4

3 critical citations More info Texas average: 2

5 serious citations More info Texas average: 0.4

29 moderate citations More info Texas average: 23

0 minor citations More info Texas average: 0.4
Citations history (last 3 years)
Nutrition moderate citation Info Issues related to food quality, meal service, and resident's nutritional needs. Sep 12, 2025
Corrected

Resident Rights moderate citation Info Issues related to resident's rights, including dignity, privacy, and the ability to make decisions about their care. Aug 29, 2025
Corrected

Abuse/Neglect critical citation Info Issues related to protecting resident's from harm, including abuse, neglect, or mistreatment. Jul 03, 2025
Corrected

Pharmacy moderate citation Info Issues related to medication management, including how drugs are stored, administered, and monitored. Jul 03, 2025
Corrected

Compare Nursing Homes around Waco The information below is reported by the Texas Health and Human Services Commission.

5 facilities compared · CMS & TX Dept. of Health data · Updated Apr 2026

Filter by care type
Wesley Woods Rehabilitation and Healthcare
MC

Memory Care Secured, specialized care for people living with Alzheimer's or dementia. Staff trained in cognitive impairment, with higher staff-to-resident ratios and an environment designed to reduce confusion and wandering risk.

NH

Nursing Home Licensed facility providing 24/7 skilled nursing care for residents with complex, ongoing medical needs. Staffed by RNs, LPNs, and CNAs. Inspected and star-rated annually by CMS. Accepts Medicare (short-term rehab) and Medicaid (long-term care).

Waco (West Waco)
120
83.4%
+31%
3.83
-15%
+5%
3
30
1.9
4
112
A+
39
-
$10.8M
$4.9M
45%
676211
Quality Care of Waco
NH

Nursing Home Licensed facility providing 24/7 skilled nursing care for residents with complex, ongoing medical needs. Staffed by RNs, LPNs, and CNAs. Inspected and star-rated annually by CMS. Accepts Medicare (short-term rehab) and Medicaid (long-term care).

Waco (Dean Highland)
202
22.1%
-65%
3.23
-23%
-11%
3
19
3.2
5
63
-
29
Waco Opco Llc
$3.6M
$2.6M
70.6%
455478
Jeffrey Place Healthcare Center
NH

Nursing Home Licensed facility providing 24/7 skilled nursing care for residents with complex, ongoing medical needs. Staffed by RNs, LPNs, and CNAs. Inspected and star-rated annually by CMS. Accepts Medicare (short-term rehab) and Medicaid (long-term care).

Waco (Richland Hills)
95
77.4%
+22%
3.78
-73%
+4%
1
39
3.0
2
67
-
72
Alexander, Maci
$7.8M
$2.9M
36.5%
455489
Lakeshore Village Nursing and Rehab
NH

Nursing Home Licensed facility providing 24/7 skilled nursing care for residents with complex, ongoing medical needs. Staffed by RNs, LPNs, and CNAs. Inspected and star-rated annually by CMS. Accepts Medicare (short-term rehab) and Medicaid (long-term care).

Waco (Cedar Ridge)
151
81.9%
+29%
3.79
-57%
+4%
3
49
4.9
8
124
-
38
Waco Nursing And Rehab Center Llc
$14.7M
$0.0M
0%
675438
Greenview Nursing and Rehab
NH

Nursing Home Licensed facility providing 24/7 skilled nursing care for residents with complex, ongoing medical needs. Staffed by RNs, LPNs, and CNAs. Inspected and star-rated annually by CMS. Accepts Medicare (short-term rehab) and Medicaid (long-term care).

Waco (Richland Hills)
128
69.9%
+10%
3.29
-40%
-10%
4
37
2.1
8
91
-
55
Richland Nursing And Rehab Center Llc
$10.1M
$0.0M
0%
455638

Places of interest near Greenview Nursing and Rehab

Address 4.3 miles from city center — 0.47 miles to nearest hospital (Heart Hospital)

Calculate Travel Distance to Greenview Nursing and Rehab

Add your location

Address

Staffing Data (Q2 2025)

This data corresponds to Q2 2025 and is based on CMS Payroll-Based Journal.

Total staff 157
Employees 99
Contractors 58
Staff to resident ratio 1.69:1
12% better than Texas average

Texas average ratio: 1.51:1

Avg staff/day 38
Average shift 8.7 hours
7% better than Texas average

Texas average: 8.1 hours

Total staff hours (quarter) 30,070
Nursing staff breakdown
Registered Nurse

Manages medical care and health needs.

Total count 7
Average shift length Info Average shift length. Calculated as total hours divided by days worked and average staff per day. 11.6 hours

No contractors work on this role.

Licensed Practical Nurse

Assists with medical care and medications.

Total count 59
Average shift length Info Average shift length. Calculated as total hours divided by days worked and average staff per day. 9.7 hours

This role is partially covered by contractors.

Certified Nursing Assistant

Helps with daily care and mobility.

Total count 42
Average shift length Info Average shift length. Calculated as total hours divided by days worked and average staff per day. 9.2 hours

This role is partially covered by contractors.

Contractor staffing

Total hours from contractors

7.4%

2,236 contractor hours this quarter

Licensed Practical Nurse: 48 Certified Nursing Assistant: 6 Medication Aide/Technician: 1 Physical Therapy Aide: 1 Feeding Assistant: 1 Physical Therapy Assistant: 1
Staff by category
Certified Nursing Assistant3664213,13491100%9.2
Licensed Practical Nurse1148593,45791100%9.7
Registered Nurse7072,1378695%11.6
Physical Therapy Aide121131,9858897%7
Other Dietary Services Staff3031,5518088%8.2
Speech Language Pathologist5051,5327684%7.5
Medication Aide/Technician8191,5298998%12.1
Respiratory Therapy Technician5051,1697178%6.6
RN Director of Nursing4041,1046470%8
Qualified Activities Professional2027095763%9.4
Administrator1015126470%8
Mental Health Service Worker1013924954%8
Nurse Practitioner1013844853%8
Qualified Social Worker3032854954%4.8
Physical Therapy Assistant0111211516%8.1
Feeding Assistant011691415%4.9
42 Certified Nursing Assistant
% of Days 100%
59 Licensed Practical Nurse
% of Days 100%
7 Registered Nurse
% of Days 95%
13 Physical Therapy Aide
% of Days 97%
3 Other Dietary Services Staff
% of Days 88%
5 Speech Language Pathologist
% of Days 84%
9 Medication Aide/Technician
% of Days 98%
5 Respiratory Therapy Technician
% of Days 78%
4 RN Director of Nursing
% of Days 70%
2 Qualified Activities Professional
% of Days 63%
1 Administrator
% of Days 70%
1 Mental Health Service Worker
% of Days 54%
1 Nurse Practitioner
% of Days 53%
3 Qualified Social Worker
% of Days 54%
1 Physical Therapy Assistant
% of Days 16%
1 Feeding Assistant
% of Days 15%

Facility Characteristics

Source: CMS Long-Term Care Facility Characteristics (Data as of Jan 2026)

Total census
93 residents
Residents by payment source
Medicare
11 residents (11.8%)
Medicaid
61 residents (65.6%)
Private pay or other
21 residents (22.6%)
Programs & Services
Residents' Group

Residents meet regularly to discuss policies, care quality, and activities

Active Resident Council

Organized group of residents that meets regularly to discuss facility policies, quality of life, and activities.

Quality of care over time

These measures show how residents usually do over time at this home, based on health outcomes and preventive care.

High-risk clinical events score Info A composite score based on pressure ulcers, falls with injury, weight loss, walking ability decline, and activities of daily living decline. 9.5
10% worse than Texas average

Texas average: 8.6

Functional decline score Info A composite score based on activities of daily living decline, walking ability decline, and incontinence. 15.6
In line with Texas average

Texas average: 16.0

Long-stay resident measures
Below average Texas avg: 4.2 Info CMS star rating based on long-stay quality measure performance. 5 stars = significantly above average, 1 star = significantly below average.
Need for Help with Daily Activities Increased Info Percent of long-stay residents whose need for help with daily activities has increased 15.8%
In line with Texas average

Texas average: 16.2%

Walking Ability Worsened Info Percent of long-stay residents whose ability to move independently worsened 13.5%
17% better than Texas average

Texas average: 16.2%

Low Risk Residents with Bowel/Bladder Incontinence Info Percent of low risk long-stay residents who lose control of their bowels or bladder 17.3%
11% worse than Texas average

Texas average: 15.7%

Falls with Major Injury Info Percent of long-stay residents experiencing one or more falls with major injury 6.4%
97% worse than Texas average

Texas average: 3.2%

High Risk Residents with Pressure Ulcers Info Percent of long-stay high risk residents with pressure ulcers 4.9%
11% worse than Texas average

Texas average: 4.4%

Urinary Tract Infection Info Percent of long-stay residents with a urinary tract infection 2.8%
249% worse than Texas average

Texas average: 0.8%

Lost Too Much Weight Info Percent of long-stay residents who lose too much weight 6.8%
96% worse than Texas average

Texas average: 3.5%

Depressive Symptoms Info Percent of long-stay residents who have depressive symptoms 2.7%
8% better than Texas average

Texas average: 2.9%

Antipsychotic Use Info Percent of long-stay residents who received an antipsychotic medication 24.8%
214% worse than Texas average

Texas average: 7.9%

Pneumococcal Vaccine Info Percent of long-stay residents assessed and appropriately given the pneumococcal vaccine 99.4%
In line with Texas average

Texas average: 97.3%

Influenza Vaccine Info Percent of long-stay residents assessed and appropriately given the seasonal influenza vaccine 97.7%
In line with Texas average

Texas average: 97.9%

Hospitalizations per 1,000 days Info Number of hospitalizations per 1,000 long-stay resident days. 2.30
8% worse than Texas average

Texas average: 2.13

ED visits per 1,000 days Info Number of outpatient emergency department visits per 1,000 long-stay resident days. 4.46
115% worse than Texas average

Texas average: 2.07

Short-stay resident measures
Significantly below average Texas avg: 2.9 Info CMS star rating based on short-stay quality measure performance. 5 stars = much above average, 1 star = much below average.
Pneumococcal Vaccine Info Percent of short-stay residents assessed and appropriately given the pneumococcal vaccine 72.6%
20% worse than Texas average

Texas average: 90.4%

Antipsychotic medication increase Info Percent of short-stay residents who newly received an antipsychotic medication 4.6%
214% worse than Texas average

Texas average: 1.4%

Influenza Vaccine Info Percent of short-stay residents assessed and appropriately given the seasonal influenza vaccine 70.0%
20% worse than Texas average

Texas average: 88.0%

Re-hospitalized after SNF stay Info Percentage of short-stay residents who were re-hospitalized after their nursing home admission. 35.6%
37% worse than Texas average

Texas average: 25.9%

Emergency department visits Info Percentage of short-stay residents who had an outpatient emergency department visit. 10.3%
14% better than Texas average

Texas average: 12.0%

Falls with major injury Info Percentage of SNF residents who experience falls with major injury during their stay. 0.0%
100% better than Texas average

Texas average: 0.8%

Penalties and fines

Federal penalties imposed by CMS for regulatory violations, including civil money penalties (fines) and denials of payment for new Medicare/Medicaid admissions.

Source: CMS Penalties Database (Data as of Jan 2026)

Total fines amount $60K
26% lower than Texas average

Texas average: $80K

Number of fines 4
61% more fines than Texas average

Texas average: 2.5

Payment Denials Info Serious action where Medicare and/or Medicaid temporarily stops payments for new residents until issues are fixed. 2
807% more payment denials than Texas average

Texas average: 0.2

Fines amount comparison
This facility $60K
Texas average $80K
Penalty History

Penalties are imposed by CMS for violations of federal nursing home regulations.

Civil Money Penalty Info Fines imposed for noncompliance, which can be assessed per day or per instance of violation. Apr 21, 2025
$13K
Civil Money Penalty Info Fines imposed for noncompliance, which can be assessed per day or per instance of violation. Apr 21, 2025
$14K
Payment Denial Info Serious action where Medicare and/or Medicaid temporarily stops payments for new residents until issues are fixed. Oct 14, 2024
11 days
Civil Money Penalty Info Fines imposed for noncompliance, which can be assessed per day or per instance of violation. Apr 30, 2024
$26K

Last updated: Jan 2026

Guides for Better Senior Living

Care Cost Calculator: See Prices in Your Area

Nursing Home Data Explorer

Don’t Wait Too Long: 7 Red Flag Signs Your Parent Needs Assisted Living Now

The True Cost of Assisted Living in 2025 – And How Families Are Paying For It

Understanding Senior Living Costs: Pricing Models, Discounts & Financial Assistance

Financial Aid for Texas Seniors

Get financial aid guidance

Community Care for the Aged and Disabled (CCAD)

TX Medicaid CCAD

Age 65+ or disabled, Texas resident, Medicaid-eligible, care need (not always nursing home level).

~$2,829/month (300% FBR, individual).

$2,000 (individual), $3,000 (couple).

Large state; rural access challenges.

Texas Community Care Services

TX CCS

Age 60+, Texas resident, at risk of decline.

~$2,000/month (individual, varies).

$5,000 (individual).

Limited funding; high demand in urban areas.

Area Agency on Aging (AAA) Services

Texas AAA Services

Age 60+, TX resident; no income/asset limits.

None; donations encouraged.

Not assessed.

28 AAAs; includes Meals on Wheels in some areas.

Medicare Savings Program (MSP)

Texas Medicare Savings Program

Age 65+ or disabled, TX resident, Medicare Part A/B.

~$2,510/month (QMB), ~$3,380/month (SLMB), ~$3,598/month (QI)—individual.

$9,430 (individual), $14,130 (couple).

Includes Extra Help for Part D; no waitlist.

Low-Income Home Energy Assistance Program (LIHEAP)

Texas Comprehensive Energy Assistance Program (CEAP)

Age 60+ prioritized, TX resident, low-income.

~$3,970/month (185% FPL).

Not assessed.

Priority for elderly/disabled; covers gas, electric, propane.

Family Caregiver Support Program (FCSP)

Texas Family Caregiver Support Program

Caregivers of 60+ needing care or 55+ caregivers of others; TX resident; 2+ ADLs.

No strict cap; prioritizes low-income (~$24,980/year).

Not assessed.

High rural demand; includes grandparent caregivers.

Senior Community Service Employment Program (SCSEP)

Texas SCSEP

Age 55+, unemployed, low-income, TX resident.

~$1,983/month (125% FPL).

Not specified.

Priority for veterans, rural residents; AARP partnership.

VA Aid and Attendance (A&A) and Housebound Benefits

Texas VA Aid and Attendance/Housebound

Age 65+ or disabled veteran/spouse, TX resident, wartime service, ADL help (A&A) or homebound.

Net income < ~$1,984/month (veteran with dependent, A&A); pension offsets income.

~$155,356 (net worth).

High veteran population; supports rural/urban needs.

Property Tax Exemption for Seniors

Texas Senior Property Tax Exemption

Age 65+, TX resident, homeowner (homestead).

None; tax-based eligibility.

Not assessed.

$25,000+ exemption; optional freeze in some counties; saves ~$500-$1,000/year.

Senior Farmers’ Market Nutrition Program (SFMNP)

Texas SFMNP

Age 60+, TX resident, low-income.

~$2,322/month (185% FPL).

Not assessed.

Vouchers (~$50/season); serves ~20,000 via 28 AAAs.

Tour Icon
Planning a tour? Check our touring checklist.
Chat Icon
Thinking of living here? We can help you speak to a current resident