Guardian Care Nursing & Rehabilitation Center
Nursing Home, Adult Day Care, Memory Care & Respite Care · Orlando, FL
CMS overall rating Info CMS (the Centers for Medicare & Medicaid Services) is the federal agency that rates nursing home quality. Its Overall Rating runs from 1 to 5 stars, combining health inspections, staffing, and quality measures, with inspections weighted most heavily.

Guardian Care Nursing & Rehabilitation Center

Nursing Home, Adult Day Care, Memory Care & Respite Care · Orlando, FL
CMS overall rating Info CMS (the Centers for Medicare & Medicaid Services) is the federal agency that rates nursing home quality. Its Overall Rating runs from 1 to 5 stars, combining health inspections, staffing, and quality measures, with inspections weighted most heavily.
Calculator: See prices in your area
Guardian Care Nursing & Rehabilitation Center accepts Medicare, Medicaid, and private pay.

Overview of Guardian Care Nursing & Rehabilitation Center

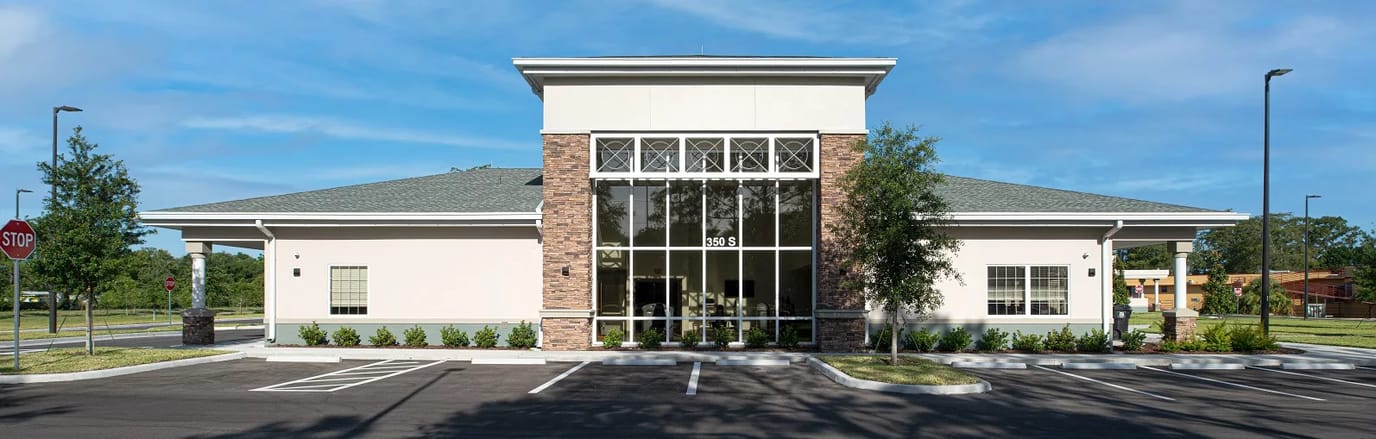
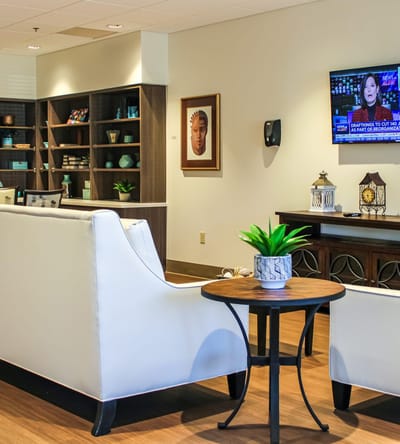
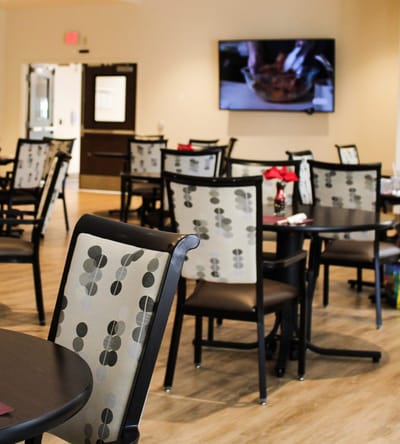
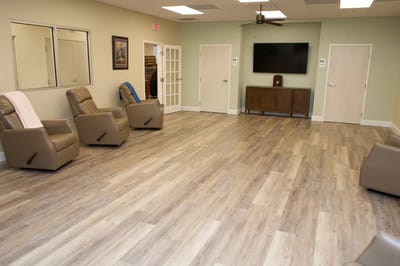
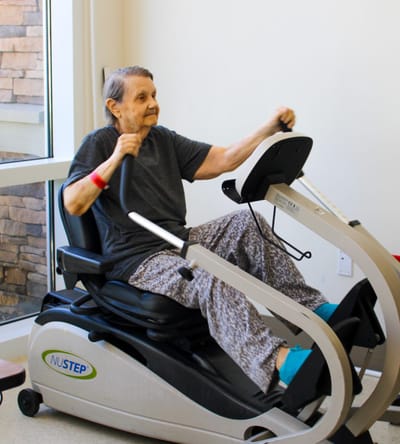
Seniors have the chance to live in elegance at the Guardian Care Nursing and Rehabilitation Center while they cherish their golden years. The facility offers subacute nursing care, with nurses available to support residents until they regain their strength. Disease management, enteral feeding, wound care, IV therapies, tracheotomy, congestive heart failure, and more are just some of the services offered to help residents recover. With a spacious layout and a lot of beautifully curated common areas, the 99-bed facility is the perfect place for seniors to call home. The private bathroom and shower, along with amenities like WiFi, cable TV, and telephones, make the living space even more entertaining.

 
The facility now caters to a diverse group of individuals who seek comfort, care, and compassion in their later years. Guardian Care also contracts with hospice agencies to provide palliative care for those in need. The staff members work in perfect harmony, always putting the patient’s needs first, which makes the facility a great choice for those looking for a secure and supportive atmosphere as they age.

Quality ratings

Measured by Centers for Medicare & Medicaid Services (CMS)

Overall rating Info The Overall CMS Rating combines results from health inspections, staffing levels and quality measures. Health inspections carry the most weight. Staffing and quality scores can increase or decrease the final rating based on performance compared to state and national standards.
▼ 5.5% Below FL avg. ▼ 5.5% Below FL avg.FL average: 3.2Click the badge to see the full State ranking.Click here to see the full State ranking.
Health Inspection Info Based on the results of the facility's three most recent standard inspections and any complaint investigations. CMS reviews the number, scope, and severity of deficiencies, with more recent findings weighted more heavily.
▼ 28.9% Below FL avg. ▼ 28.9% Below FL avg.FL average: 2.8Click the badge to see the full State ranking.Click here to see the full State ranking.
Staffing Info Measures average nursing staff hours per resident per day, including Registered Nurses (RNs) and total nursing staff. Ratings are adjusted based on the level of care residents require and are compared to state and national benchmarks.
▼ 40.9% Below FL avg. ▼ 40.9% Below FL avg.FL average: 3.4Click the badge to see the full State ranking.Click here to see the full State ranking.
Quality Measures Info Based on clinical and physical health indicators reported to CMS, such as hospital readmissions, falls, pressure ulcers, and improvements in mobility. These measures reflect how well residents' health needs are being managed.
▲ 23.2% Above FL avg. ▲ 23.2% Above FL avg.FL average: 4.1Click the badge to see the full State ranking.Click here to see the full State ranking.

Staffing hours breakdown

Info Daily nursing hours per resident by staff type, reported to CMS. Higher is generally better — compare this facility to state and national averages to see where staffing stands.

Hours per resident per day — compared to Florida state averages

Total nursing care / resident Info This home is ranked 126th out of 253 homes in Florida for nurse hours. Total adjusted nursing hours per resident per day, combining RN, LPN, and aide time. CMS adjusts this for case-mix so facilities can be fairly compared.
3h 55m per day
Rank #126 / 253Nurse hours — State benchmarkedThis home is ranked 126th out of 253 homes in Florida. Shows adjusted nurse hours per resident per day benchmarked to the Florida average, with a ranking across 253 Florida facilities. More hours mean more direct care. The national average is about 3.5 hrs; below 3.0 is a red flag.Rankings are based only on facilities in Florida that report data for that category. Facilities without available data are excluded from the ranking.Click the rank badge to see the full State ranking.Click here to see the full State ranking.
This facility Florida avg (4h 2m per day)
vs Florida avg
-3%

5 of 6 metrics below state avg

Standout metric Weekend RN is +18% above state avg
Staff typeHours / Day / Residentvs state avg
Registered Nurse (RN) Info RNs hold the highest nursing license and can assess residents, interpret test results, and direct care plans. More RN hours per day often signals stronger clinical oversight and faster response to health changes. 41m per day ▼ 7% State avg: 44m per day · National avg: 41m per day
LPN / LVN Info Licensed Practical Nurses (LPNs) or Licensed Vocational Nurses (LVNs) deliver routine hands-on care — medication administration, wound dressing, and monitoring vital signs. They work under RN supervision and make up a large share of daily bedside care. 34m per day ▼ 29% State avg: 47m per day · National avg: 52m per day
Nurse Aide Info Certified Nurse Aides (CNAs) provide the most direct day-to-day assistance: bathing, dressing, feeding, and mobility. Nurse aide hours are typically the largest staffing category and directly affect residents' quality of life. 2h 15m per day ▼ 3% State avg: 2h 20m per day · National avg: 2h 21m per day
Weekend Total Nursing Info Combined nursing hours (RN + LPN + Nurse Aide) per resident per day on weekends. Staffing often drops on weekends — this figure reveals whether the facility maintains adequate coverage outside of weekday hours. 3h 20m per day ▼ 5% State avg: 3h 31m per day · National avg: 3h 26m per day
Physical Therapist Info Hours per resident per day provided by licensed Physical Therapists (PTs) or PT Assistants. PT services help residents recover mobility after injury or illness and are especially important for post-acute (short-stay) rehabilitation. 3m per day ▼ 40% State avg: 5m per day · National avg: 4m per day
Weekend RN Info Registered nurse hours specifically on weekends. Facilities sometimes reduce RN presence on Saturdays and Sundays — a low weekend RN figure compared to weekday hours can indicate reduced clinical oversight when most administrative staff are absent. 38m per day ▲ 18% State avg: 32m per day · National avg: 29m per day

Capacity and availability

This home usually has limited availability

Higher occupancy than the Florida average: 84.3%
Occupancy rate
93.1% Rank #63 / 258Occupancy rate — State benchmarkedThis home is ranked 63rd out of 258 homes in Florida. Shows this facility's occupancy rate versus the Florida average, with its Statewide rank out of 258. Higher occupancy signals strong local demand and financial stability.Rankings are based only on facilities in Florida that report data for that category. Facilities without available data are excluded from the ranking.Click the rank badge to see the full State ranking.Click here to see the full State ranking.
Avg. Length of Stay
191 days
Bed community size
120-bed community Rank #256 / 1074Bed count — State benchmarkedThis home is ranked 256th out of 1074 homes in Florida. Shows this facility's certified or reported bed count compared to other Florida facilities. Larger communities may offer more amenities, programs, and on-site services for residents and families.Rankings are based only on facilities in Florida that report data for that category. Facilities without available data are excluded from the ranking.Click the rank badge to see the full State ranking.Click here to see the full State ranking.
A larger shared setting that may offer more common spaces and organized community services.
Walk Score
Walk Score: 39 / 100 Rank #743 / 1486Walk Score — State benchmarkedThis home is ranked 743rd out of 1486 homes in Florida. Shows how walkable this facility's neighborhood is compared to the average Walk Score across Florida facilities. Higher scores benefit residents, families, and staff.Rankings are based only on facilities in Florida that report data for that category. Facilities without available data are excluded from the ranking.Click the rank badge to see the full State ranking.Click here to see the full State ranking.
Somewhat walkable. A few nearby services may be reachable on foot, but most trips require transportation.

Therapy & Rehabilitation

1 service
Rehabilitation Services

Staffing & Medical

1 service
24-Hour Staffing

Amenities & Lifestyle

Specific ProgramsDietary Services, Residential Care, Special Needs Care, Exercise Care, Health Care
Touring Hours9:00am to 5:00Pm

Contact Guardian Care Nursing & Rehabilitation Center

Staffing Data

Reporting period: October 1 – December 31, 2025 (Q4 2025). Source: CMS Payroll-Based Journal report.

Total staff 130
Employees 110
Contractors 20
Staff to resident ratio 1.40 : 1
5% fewer staff per resident than Florida average
Florida average ratio: 1.47 : 1 Florida average ratio: 1.47 : 1See full Florida ranking
Avg staff/day 45
Average shift 8.2 hours
0% compared with Florida average
Florida average: 7.9 hours Florida average shift: 7.9 hoursSee full Florida ranking
Total staff hours (quarter) 33,743

Nursing staff breakdown

Q4 2025 · Oct 1 – Dec 31 More info This data comes from the CMS Payroll-Based Journal report covering October 1 – December 31, 2025.
Registered Nurse

Manages medical care and health needs.

RN Staff Info 21 total: 19 full-time employees and 2 contractors. 21
Average shift length Info Average shift length. Calculated as total hours divided by days worked and average staff per day. 9.3 hours
Licensed Practical Nurse

Assists with medical care and medications.

LPN Staff Info 16 total: 9 full-time employees and 7 contractors. 16
Average shift length Info Average shift length. Calculated as total hours divided by days worked and average staff per day. 9.1 hours
Certified Nursing Assistant

Helps with daily care and mobility.

CNA Staff Info 67 total: 60 full-time employees and 7 contractors. 67
Average shift length Info Average shift length. Calculated as total hours divided by days worked and average staff per day. 8.4 hours

Contractor staffing

Q4 2025 · Oct 1 – Dec 31 More info This data comes from the CMS Payroll-Based Journal report covering October 1 – December 31, 2025.

Total hours from contractors

1.4%

461 contractor hours this quarter

Certified Nursing Assistant: 7 Licensed Practical Nurse: 7 Registered Nurse: 2 Occupational Therapy Aide: 2 Medical Director: 1 Occupational Therapy Assistant: 1

Staff by category

Q4 2025 · Oct 1 – Dec 31 More info This data comes from the CMS Payroll-Based Journal report covering October 1 – December 31, 2025.
Certified Nursing Assistant6076718,64292100%8.4
Registered Nurse192215,17292100%9.3
Licensed Practical Nurse97162,78492100%9.1
RN Director of Nursing4041,8379199%7.5
Qualified Social Worker2028056975%7.2
Other Dietary Services Staff2027768795%7.8
Speech Language Pathologist2026506874%5.5
Physical Therapy Assistant5055818188%4.2
Mental Health Service Worker1015046368%8
Respiratory Therapist1014615964%7.8
Nurse Practitioner1014485661%8
Respiratory Therapy Technician2024166065%6.5
Administrator1013844852%8
Occupational Therapy Aide0221061617%6.6
Medical Director011961213%8
Occupational Therapy Assistant011631415%4.5
Physical Therapy Aide1012067%3.3
67 Certified Nursing Assistant
% of Days 100%
21 Registered Nurse
% of Days 100%
16 Licensed Practical Nurse
% of Days 100%
4 RN Director of Nursing
% of Days 99%
2 Qualified Social Worker
% of Days 75%
2 Other Dietary Services Staff
% of Days 95%
2 Speech Language Pathologist
% of Days 74%
5 Physical Therapy Assistant
% of Days 88%
1 Mental Health Service Worker
% of Days 68%
1 Respiratory Therapist
% of Days 64%
1 Nurse Practitioner
% of Days 61%
2 Respiratory Therapy Technician
% of Days 65%
1 Administrator
% of Days 52%
2 Occupational Therapy Aide
% of Days 17%
1 Medical Director
% of Days 13%
1 Occupational Therapy Assistant
% of Days 15%
1 Physical Therapy Aide
% of Days 7%

Penalties and fines

Includes penalties issued in 2023

Federal penalties imposed by CMS for regulatory violations, including civil money penalties (fines) and denials of payment for new Medicare/Medicaid admissions.

Source: CMS Penalties Database (Data as of Jan 2026)

Total fines amount $16K Rank #188 / 258Federal fines — State benchmarkedThis home is ranked 188th out of 258 homes in Florida. Shows this facility's cumulative CMS federal fine dollars versus the Florida average among facilities with fines, and where it ranks among 258 facilities in the pool. Lower total dollars mean a better rank.Rankings are based only on facilities in Florida that report data for that category. Facilities without available data are excluded from the ranking.Click the rank badge to see the full State ranking.Click here to see the full State ranking.
78% lower than Florida average

Florida average: $72K

Number of fines 1
62% fewer fines than Florida average

Florida average: 2.6

Payment Denials Info Serious action where Medicare and/or Medicaid temporarily stops payments for new residents until issues are fixed. 0
100% fewer payment denials than Florida average

Florida average: 0.1

Fines amount comparison
This facility $16K
Florida average $72K
Penalty History

Penalties are imposed by CMS for violations of federal nursing home regulations.

1 penalty in the past 3 years

Jul 29, 2023 · $16K

Civil Money Penalty Info Fines imposed for noncompliance, which can be assessed per day or per instance of violation. Jul 29, 2023
$16K

Last updated: Jan 2026

Quality of care over time

These measures show how residents usually do over time at this home, based on health outcomes and preventive care.

High-risk clinical events score Info A composite score based on pressure ulcers, falls with injury, weight loss, walking ability decline, and activities of daily living decline. 11.1
50% worse than Florida average

Florida average: 7.4

Functional decline score Info A composite score based on activities of daily living decline, walking ability decline, and incontinence. 19.6
58% worse than Florida average

Florida average: 12.4

Long-stay resident measures
Significantly above average Florida avg: 4.5 Info CMS star rating based on long-stay quality measure performance. 5 stars = significantly above average, 1 star = significantly below average.
Need for Help with Daily Activities Increased Info Percent of long-stay residents whose need for help with daily activities has increased 21.2%
102% worse than Florida average

Florida average: 10.5%

Walking Ability Worsened Info Percent of long-stay residents whose ability to move independently worsened 24.2%
87% worse than Florida average

Florida average: 12.9%

Low Risk Residents with Bowel/Bladder Incontinence Info Percent of low risk long-stay residents who lose control of their bowels or bladder 13.4%
In line with Florida average

Florida average: 13.5%

Falls with Major Injury Info Percent of long-stay residents experiencing one or more falls with major injury 1.8%
31% better than Florida average

Florida average: 2.6%

High Risk Residents with Pressure Ulcers Info Percent of long-stay high risk residents with pressure ulcers 4.3%
20% better than Florida average

Florida average: 5.4%

Urinary Tract Infection Info Percent of long-stay residents with a urinary tract infection 0.3%
64% better than Florida average

Florida average: 0.9%

Lost Too Much Weight Info Percent of long-stay residents who lose too much weight 4.0%
33% better than Florida average

Florida average: 6.0%

Depressive Symptoms Info Percent of long-stay residents who have depressive symptoms 1.0%
71% better than Florida average

Florida average: 3.3%

Antipsychotic Use Info Percent of long-stay residents who received an antipsychotic medication 13.5%
68% worse than Florida average

Florida average: 8.0%

Pneumococcal Vaccine Info Percent of long-stay residents assessed and appropriately given the pneumococcal vaccine 94.6%
In line with Florida average

Florida average: 97.7%

Influenza Vaccine Info Percent of long-stay residents assessed and appropriately given the seasonal influenza vaccine 86.1%
13% worse than Florida average

Florida average: 99.2%

Hospitalizations per 1,000 days Info Number of hospitalizations per 1,000 long-stay resident days. 1.90
10% better than Florida average

Florida average: 2.10

ED visits per 1,000 days Info Number of outpatient emergency department visits per 1,000 long-stay resident days. 0.44
63% better than Florida average

Florida average: 1.18

Short-stay resident measures
Significantly above average Florida avg: 3.1 Info CMS star rating based on short-stay quality measure performance. 5 stars = much above average, 1 star = much below average.
Pneumococcal Vaccine Info Percent of short-stay residents assessed and appropriately given the pneumococcal vaccine 97.9%
In line with Florida average

Florida average: 94.0%

Antipsychotic medication increase Info Percent of short-stay residents who newly received an antipsychotic medication 0.6%
60% better than Florida average

Florida average: 1.5%

Influenza Vaccine Info Percent of short-stay residents assessed and appropriately given the seasonal influenza vaccine 100.0%
6% better than Florida average

Florida average: 94.7%

Re-hospitalized after SNF stay Info Percentage of short-stay residents who were re-hospitalized after their nursing home admission. 23.0%
12% better than Florida average

Florida average: 26.2%

Emergency department visits Info Percentage of short-stay residents who had an outpatient emergency department visit. 2.4%
74% better than Florida average

Florida average: 9.3%

Falls with major injury Info Percentage of SNF residents who experience falls with major injury during their stay. 0.0%
100% better than Florida average

Florida average: 0.8%

Ability to care for self at discharge Info Percentage of residents at or above expected ability to care for themselves at discharge. 75.0%
40% better than Florida average

Florida average: 53.7%

Successful return to home or community Info Rate of successful return to home or community from a skilled nursing facility. 47.6%
6% worse than Florida average

Florida average: 50.6%

Breakdown by payment type

Medicare

45% of new residents, usually for short-term rehab.

Typical stay 1 - 2 months

Private pay

44% of new residents, often for short stays.

Typical stay 5 - 6 months

Medicaid

10% of new residents, often for long-term daily care.

Typical stay 5 - 6 years

Facility Characteristics

Source: CMS Long-Term Care Facility Characteristics (Data as of Jan 2026)

Total residents 93
Medicare
7
7.5% of residents
Medicaid
49
52.7% of residents
Private pay or other
37
39.8% of residents
Programs & Services
Residents Group

Residents meet regularly to discuss policies, care quality, and activities

Family Member Group

Family members meet regularly to discuss policies, care quality, and activities

Active Family Council

Organized group of family members that meets regularly to discuss facility policies, resident care, and activities.

Active Resident Council

Organized group of residents that meets regularly to discuss facility policies, quality of life, and activities.

Finances and operations

Based on CMS SNF Cost Report for fiscal year ending in 06/2024.

Nonprofit
Nonprofit Corporation
Net patient revenue Info Net patient revenue — what the home actually collects for resident care, after contractual allowances, bad debt and discounts are subtracted from its gross charges (CMS cost report, Worksheet G-3). It covers resident care only; money the home earns from other sources is shown separately as "Other income."
$10.6M
Net patient income Info Net patient income: net patient revenue minus the home's total operating expenses. A positive figure means it earns more from resident care than it spends to deliver it; a negative figure means the opposite. It excludes non-operating "other income."
-$463.6K
Nonprofit Nonprofit Corporation
Net patient revenue Info Net patient revenue — what the home actually collects for resident care, after contractual allowances, bad debt and discounts are subtracted from its gross charges (CMS cost report, Worksheet G-3). It covers resident care only; money the home earns from other sources is shown separately as "Other income."
$10.6M Rank #214 / 257Revenue — State benchmarkedThis home is ranked 214th out of 257 homes in Florida. Shows this facility's annual revenue compared to the Florida average. Higher revenue generally means more resources for staffing and capital — read alongside Payroll %.Rankings are based only on facilities in Florida that report data for that category. Facilities without available data are excluded from the ranking.Click the rank badge to see the full State ranking.Click here to see the full State ranking.
Net patient income Info Net patient income: net patient revenue minus the home's total operating expenses. A positive figure means it earns more from resident care than it spends to deliver it; a negative figure means the opposite. It excludes non-operating "other income."
-$463.6K
Other income Info Money the home earns outside of resident care — such as investments, grants, rentals and other non-operating sources (CMS cost report, Worksheet G-3). It is tracked separately from net patient revenue: it is not part of that figure, and it is not included in net patient income.
$13.6K
Payroll costs Info Staff salaries plus wage-related costs — benefits such as payroll taxes, health insurance and retirement — from the home's own accounting records (CMS cost report, Worksheet A). Contract or agency labor is counted separately, under other operating costs. Rank #193 / 257Payroll — State benchmarkedThis home is ranked 193rd out of 257 homes in Florida. Shows total annual staff payroll benchmarked to the Florida average. Higher payroll investment relative to peers often signals better staffing and less reliance on cheaper contract labor.Rankings are based only on facilities in Florida that report data for that category. Facilities without available data are excluded from the ranking.Click the rank badge to see the full State ranking.Click here to see the full State ranking.
$6.1M 56.9% of net patient revenue Info Payroll as a share of revenue: staff salaries and wage-related benefits divided by net patient revenue. A higher figure means more of each revenue dollar goes to staff pay. Rank #34 / 257Payroll % — State benchmarkedThis home is ranked 34th out of 257 homes in Florida. Shows payroll as a percentage of revenue versus the Florida average. Well-run Florida facilities typically land around 49–56% — the top third Statewide. Below 25% may signal understaffing or heavy agency use — read with Staffing ratings.Rankings are based only on facilities in Florida that report data for that category. Facilities without available data are excluded from the ranking.Click the rank badge to see the full State ranking.Click here to see the full State ranking.
Other operating costs Info Everything it costs to run the home apart from payroll — food, utilities, supplies, maintenance, contract labor and administration. Calculated as total operating expense minus payroll (staff salaries and wage-related benefits).
$5.0M
Total costs Info The home's total operating expense for the year — all the costs of running it, salaries included (CMS cost report, Worksheet G-3).
$11.1M

Who this home usually serves

TYPE OF STAY

Mostly short-term rehab stays

Most residents typically stay for a few weeks or months before returning home or moving on.

New residents most often arrive under Medicare (45% of admissions), and a typical Medicare stay runs around 1 - 2 months.

Admissions
115 total

Coverage residents most often arrive under.

Medicare 45%
Private pay 44%
Medicaid 10%
Discharges
177 total

Coverage residents most often leave under.

Medicare 20%
Private pay 47%
Medicaid 32%

Places of interest near Guardian Care Nursing & Rehabilitation Center

Address 2.1 miles from city center Info Estimated distance in miles from Orlando's city center to Guardian Care Nursing & Rehabilitation Center's address, calculated via Google Maps.

Calculate Travel Distance to Guardian Care Nursing & Rehabilitation Center

Add your location

Address

Compare Nursing Homes around Orlando

The information below is reported by the Florida Agency for Health Care Administration (AHCA).

5 facilities compared · CMS & FL Dept. of Health data

Westminster Baldwin Park
NH
AL
IL
MC
Orlando (Northeast Orlando)
24
Facility 24
FL AVG 89
Rank #875 / 1074
55.4%
Facility 55.4%
FL AVG 84.3%
Rank #246 / 258
-34%
4.90
Facility 4.90
FL AVG 4.04
Rank #32 / 253
+80%+21%
$0
Facility $0
FL AVG $78.9k
Rank #1 / 258
-
15
Facility 15
FL AVG 19.7
Rank #93 / 252
5.0
Facility 5.0
FL AVG 4.5
Rank #164 / 252
-18-
26
Facility 26
FL AVG 40
Rank #976 / 1486
Presbyterian Retirement Communities, Inc
$4.7M
Facility $4.7M
FL AVG $15.7M
Rank #216 / 257
$3.5M
Facility $3.5M
FL AVG $6.1M
Rank #230 / 257
73.9%
Facility 73.9%
FL AVG 39.8%
Rank #213 / 257
106118
The Towers Orlando
NH
AL
IL
NC
Orlando (Central Business District)
168
Facility 168
FL AVG 89
Rank #99 / 1074
71.4%
Facility 71.4%
FL AVG 84.3%
Rank #219 / 258
-15%
4.09
Facility 4.09
FL AVG 4.04
Rank #91 / 253
+71%+1%
$0
Facility $0
FL AVG $78.9k
Rank #1 / 258
-
11
Facility 11
FL AVG 19.7
Rank #53 / 252
2.8
Facility 2.8
FL AVG 4.5
Rank #45 / 252
-148-
96
Facility 96
FL AVG 40
Rank #11 / 1486
Orlando Lutheran Towers, Inc
$15.9M
Facility $15.9M
FL AVG $15.7M
Rank #88 / 257
$11.1M
Facility $11.1M
FL AVG $6.1M
Rank #55 / 257
70%
Facility 70%
FL AVG 39.8%
Rank #81 / 257
105731
Guardian Care Nursing & Rehabilitation Center
NH
ADC
MC
RC
Orlando (Southwest Orlando)
120
Facility 120
FL AVG 89
Rank #256 / 1074
93.1%
Facility 93.1%
FL AVG 84.3%
Rank #63 / 258
+10%
3.91
Facility 3.91
FL AVG 4.04
Rank #126 / 253
+34%-3%
$15.7k
Facility $15.7k
FL AVG $78.9k
Rank #188 / 258
-
19
Facility 19
FL AVG 19.7
Rank #135 / 252
6.3
Facility 6.3
FL AVG 4.5
Rank #206 / 252
190-
39
Facility 39
FL AVG 40
Rank #743 / 1486
Eloise Abrahams
$10.6M
Facility $10.6M
FL AVG $15.7M
Rank #214 / 257
$6.1M
Facility $6.1M
FL AVG $6.1M
Rank #193 / 257
56.9%
Facility 56.9%
FL AVG 39.8%
Rank #34 / 257
105797
Westminster Towers
NH
AL
IL
Orlando (Southeast Orlando)
60
Facility 60
FL AVG 89
Rank #695 / 1074
88.6%
Facility 88.6%
FL AVG 84.3%
Rank #139 / 258
+5%
3.78
Facility 3.78
FL AVG 4.04
Rank #145 / 253
+18%-6%
$22.1k
Facility $22.1k
FL AVG $78.9k
Rank #202 / 258
82
Facility 82
FL AVG 83
Rank #530 / 876
22
Facility 22
FL AVG 19.7
Rank #161 / 252
3.7
Facility 3.7
FL AVG 4.5
Rank #94 / 252
196-
65
Facility 65
FL AVG 40
Rank #275 / 1486
Westminster Services Inc
$13.5M
Facility $13.5M
FL AVG $15.7M
Rank #40 / 257
$13.2M
Facility $13.2M
FL AVG $6.1M
Rank #37 / 257
97.8%
Facility 97.8%
FL AVG 39.8%
Rank #149 / 257
105757
The Rose Garden of Orlando
NH
AL
IL
MC
Orlando (South Division)
120
Facility 120
FL AVG 89
Rank #256 / 1074
90.9%
Facility 90.9%
FL AVG 84.3%
Rank #100 / 258
+8%
3.86
Facility 3.86
FL AVG 4.04
Rank #126 / 253
-20%-4%
$117.4k
Facility $117.4k
FL AVG $78.9k
Rank #239 / 258
-
34
Facility 34
FL AVG 19.7
Rank #225 / 252
5.7
Facility 5.7
FL AVG 4.5
Rank #194 / 252
2113-
32
Facility 32
FL AVG 40
Rank #888 / 1486
-
$9.3M
Facility $9.3M
FL AVG $15.7M
Rank #207 / 257
$4.5M
Facility $4.5M
FL AVG $6.1M
Rank #246 / 257
48%
Facility 48%
FL AVG 39.8%
Rank #249 / 257
105471

Financial Assistance for
Nursing Home in Florida

Guardian Care Nursing & Rehabilitation Center is located in Orlando, Florida.
Here are the financial assistance programs available to residents in Florida.

Get Financial aid guidance

Long-Term Care Waiver

Florida Medicaid LTC Waiver

Age 65+ or 21+ disabled
General Florida resident, Medicaid- eligible, nursing home-level care need.
Income Limits (2025) ~$2,829/month 300% FBR, individual
Asset Limits $2,000 (individual), $3,000 (couple).
FL

High demand; waitlists common.

Benefits
In-home care (6-8 hours/day) Assisted living Respite (240 hours/year) Case management

Community Care for the Elderly (CCE)

Florida CCE

Age 60+
General Florida resident, at risk of nursing home.
Income Limits ~$2,000/month varies
Asset Limits $5,000 individual
FL

Limited funding; regional variation.

Benefits
Homemaker services (3-5 hours/week) Adult day care (~$60/day) Respite (up to 10 days/year)

Home Care for the Elderly (HCE)

Florida Home Care for the Elderly

Age 60+
General Florida resident, at risk of nursing home placement; caregiver must be approved.
Income Limits (2025) ~$2,829/month individual, aligned with Medicaid thresholds
Asset Limits ~$2,000 (individual); varies by case manager discretion.
FL

Limited funding (~3,500 served annually); prioritizes low-income frail seniors.

Benefits
Basic subsidy (~$160/month) for housing/medical costs; special subsidies for supplies/services (e.g., incontinence supplies, ~$50-$200/month)

Program of All-Inclusive Care for the Elderly (PACE)

Florida Medicaid PACE

Age 55+
General Florida resident, nursing home-level care need, safe with PACE support.
Income Limits (2025) ~$2,829/month 300% FBR
Asset Limits $2,000 (individual), $3,000 (couple).
FL

Limited to specific counties (e.g., Hillsborough, Miami-Dade); ~10 sites statewide.

Benefits
Personal care (5-7 hours/day) Medical care Meals Transportation Therapy

Optional State Supplementation (OSS)

Florida Optional State Supplementation

Age 65+ or disabled
General Florida resident, living in approved facility, receiving SSI or low-income.
Income Limits (2025) ~$1,004/month individual, including SSI
Asset Limits $2,000 (individual), $3,000 (couple).
FL

Limited to specific facility types; ~$78.40/month max supplement.

Benefits
Cash payment (~$78.40/month) for room/board or personal needs in facilities

Frequently Asked Questions about Guardian Care Nursing & Rehabilitation Center

What neighborhood is Guardian Care Nursing & Rehabilitation Center in?

Guardian Care Nursing & Rehabilitation Center is in the Southwest Orlando neighborhood.

Is Guardian Care Nursing & Rehabilitation Center in a walkable area?

Guardian Care Nursing & Rehabilitation Center has a walk score of 39. Somewhat walkable. A few nearby services may be reachable on foot, but most trips require transportation.

What is the occupancy rate at Guardian Care Nursing & Rehabilitation Center?

Guardian Care Nursing & Rehabilitation Center's occupancy is 93.1%.

Does Guardian Care Nursing & Rehabilitation Center operate as a for-profit or non-profit?

Guardian Care Nursing & Rehabilitation Center is registered as a non-profit.

Are there photos of Guardian Care Nursing & Rehabilitation Center?

Yes — there are 6 photos of Guardian Care Nursing & Rehabilitation Center in the photo gallery on this page.

What is the address of Guardian Care Nursing & Rehabilitation Center?

Guardian Care Nursing & Rehabilitation Center is located at 350 S John Young Pkwy, Orlando, FL 32805.

What is the phone number of Guardian Care Nursing & Rehabilitation Center?

(407) 295-5371 will put you in contact with the team at Guardian Care Nursing & Rehabilitation Center.

Guides for Better Senior Living

Care Cost Calculator: See Prices in Your Area

Nursing Home Data Explorer

Don’t Wait Too Long: 7 Red Flag Signs Your Parent Needs Assisted Living Now

The True Cost of Assisted Living in 2025 – And How Families Are Paying For It

Understanding Senior Living Costs: Pricing Models, Discounts & Financial Assistance