• Home
  • Nursing Home in Florida
Hampton Manor at 24th Road
Nursing Home, Assisted Living, Independent Living & Memory Care · Ocala, FL
CMS overall rating Info CMS (the Centers for Medicare & Medicaid Services) is the federal agency that rates nursing home quality. Its Overall Rating runs from 1 to 5 stars, combining health inspections, staffing, and quality measures, with inspections weighted most heavily.

Hampton Manor at 24th Road

Nursing Home, Assisted Living, Independent Living & Memory Care · Ocala, FL
CMS overall rating Info CMS (the Centers for Medicare & Medicaid Services) is the federal agency that rates nursing home quality. Its Overall Rating runs from 1 to 5 stars, combining health inspections, staffing, and quality measures, with inspections weighted most heavily.
Calculator: See prices in your area
Hampton Manor at 24th Road accepts Medicare, Medicaid, and private pay.

Overview of Hampton Manor at 24th Road

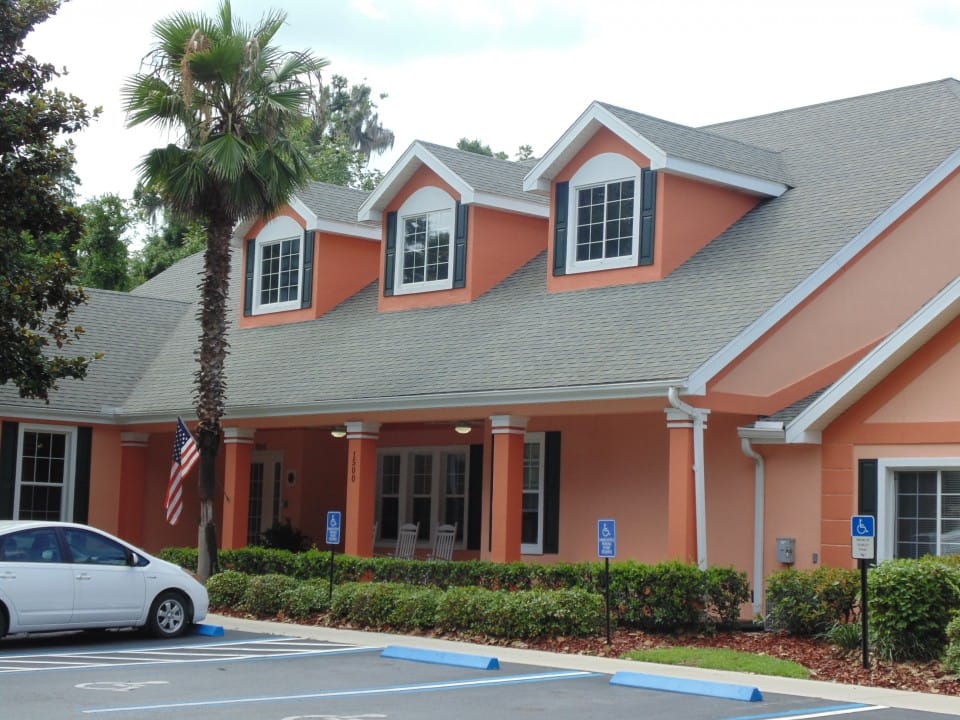
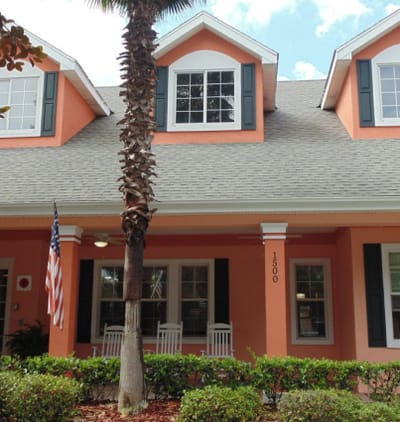
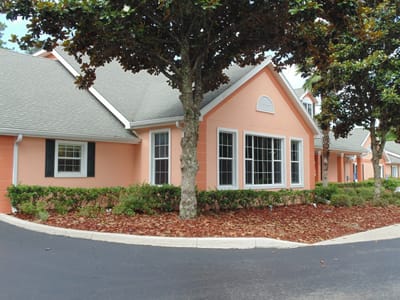
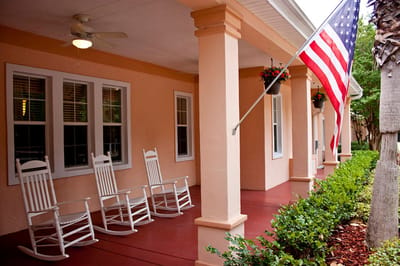
Set in the peaceful residential area of SE 24th Road, Ocala, FL, Hampton Manor at 24th Road is a prominent senior living community focusing on memory care. The community features snug and spacious studio and one-bedroom floor plans, purposely crafted to maximize seniors’ comfort and convenience. With a team of compassionate and qualified professionals delivering exceptional care and support around the clock, seniors let go of their worries and lead inspiring lives.

The community fosters a bright and welcoming environment, providing residents with opportunities to create lasting moments with their surroundings. Have a delightful dining experience with delicious and well-balanced meals that satisfy dietary needs and preferences. Hampton Manor at 24th Road is a haven for seniors to live a peaceful retirement with its stunning spaces and incredible amenities.

Quality ratings

Measured by Centers for Medicare & Medicaid Services (CMS)

Overall rating Info The Overall CMS Rating combines results from health inspections, staffing levels and quality measures. Health inspections carry the most weight. Staffing and quality scores can increase or decrease the final rating based on performance compared to state and national standards.
Health Inspection Info Based on the results of the facility's three most recent standard inspections and any complaint investigations. CMS reviews the number, scope, and severity of deficiencies, with more recent findings weighted more heavily.
Staffing Info Measures average nursing staff hours per resident per day, including Registered Nurses (RNs) and total nursing staff. Ratings are adjusted based on the level of care residents require and are compared to state and national benchmarks.
Quality Measures Info Based on clinical and physical health indicators reported to CMS, such as hospital readmissions, falls, pressure ulcers, and improvements in mobility. These measures reflect how well residents' health needs are being managed.

Staffing hours breakdown

Info Daily nursing hours per resident by staff type, reported to CMS. Higher is generally better — compare this facility to state and national averages to see where staffing stands.

Hours per resident per day — compared to state averages

Total nursing care / resident Info Total adjusted nursing hours per resident per day, combining RN, LPN, and aide time. CMS adjusts this for case-mix so facilities can be fairly compared.
3h 38m per day
Rank #198 / 253Nurse hours — State benchmarkedThis home is ranked 198th out of 253 homes in Florida. Shows adjusted nurse hours per resident per day benchmarked to the Florida average, with a ranking across 253 Florida facilities. More hours mean more direct care. The national average is about 3.5 hrs; below 3.0 is a red flag.Rankings are based only on facilities in Florida that report data for that category. Facilities without available data are excluded from the ranking.Click the rank badge to see the full State ranking.Click here to see the full State ranking.
vs avg
Staff typeHours / Day / Residentvs state avg
Registered Nurse (RN) Info RNs hold the highest nursing license and can assess residents, interpret test results, and direct care plans. More RN hours per day often signals stronger clinical oversight and faster response to health changes. 21m per day
LPN / LVN Info Licensed Practical Nurses (LPNs) or Licensed Vocational Nurses (LVNs) deliver routine hands-on care — medication administration, wound dressing, and monitoring vital signs. They work under RN supervision and make up a large share of daily bedside care. 1h 9m per day
Nurse Aide Info Certified Nurse Aides (CNAs) provide the most direct day-to-day assistance: bathing, dressing, feeding, and mobility. Nurse aide hours are typically the largest staffing category and directly affect residents' quality of life. 2h 5m per day
Weekend Total Nursing Info Combined nursing hours (RN + LPN + Nurse Aide) per resident per day on weekends. Staffing often drops on weekends — this figure reveals whether the facility maintains adequate coverage outside of weekday hours. 3h 17m per day
Physical Therapist Info Hours per resident per day provided by licensed Physical Therapists (PTs) or PT Assistants. PT services help residents recover mobility after injury or illness and are especially important for post-acute (short-stay) rehabilitation. 2m per day
Weekend RN Info Registered nurse hours specifically on weekends. Facilities sometimes reduce RN presence on Saturdays and Sundays — a low weekend RN figure compared to weekday hours can indicate reduced clinical oversight when most administrative staff are absent. 17m per day

Capacity and availability

This home usually has availability

Lower occupancy than the state average
Occupancy rate
77.1% Rank #201 / 258Occupancy rate — State benchmarkedThis home is ranked 201st out of 258 homes in Florida. Shows this facility's occupancy rate versus the Florida average, with its Statewide rank out of 258. Higher occupancy signals strong local demand and financial stability.Rankings are based only on facilities in Florida that report data for that category. Facilities without available data are excluded from the ranking.Click the rank badge to see the full State ranking.Click here to see the full State ranking.
Avg. Length of Stay
88 days
Bed community size
180-bed community Rank #56 / 1074Bed count — State benchmarkedThis home is ranked 56th out of 1074 homes in Florida. Shows this facility's certified or reported bed count compared to other Florida facilities. Larger communities may offer more amenities, programs, and on-site services for residents and families.Rankings are based only on facilities in Florida that report data for that category. Facilities without available data are excluded from the ranking.Click the rank badge to see the full State ranking.Click here to see the full State ranking.
A large-scale community that may provide a wide range of amenities, services, and structured programs.
Walk Score
Walk Score: 13 / 100 Rank #1203 / 1486Walk Score — State benchmarkedThis home is ranked 1203rd out of 1486 homes in Florida. Shows how walkable this facility's neighborhood is compared to the average Walk Score across Florida facilities. Higher scores benefit residents, families, and staff.Rankings are based only on facilities in Florida that report data for that category. Facilities without available data are excluded from the ranking.Click the rank badge to see the full State ranking.Click here to see the full State ranking.
Car-dependent. Most errands require a car, with limited nearby walkable options.

Contact Hampton Manor at 24th Road

Staffing Data

Reporting period: October 1 – December 31, 2025 (Q4 2025). Source: CMS Payroll-Based Journal report.

Total staff 236
Employees 215
Contractors 21
Staff to resident ratio 1.48 : 1
0% compared with State average

State average ratio: 0 : 0

Avg staff/day 83
Average shift 8 hours
0% compared with State average

State average: 0 hours

Total staff hours (quarter) 61,212

Nursing staff breakdown

Q4 2025 · Oct 1 – Dec 31 More info This data comes from the CMS Payroll-Based Journal report covering October 1 – December 31, 2025.
Registered Nurse

Manages medical care and health needs.

RN Staff Info All 9 RN Staff are full-time employees. No contractors work on this role. 9
Average shift length Info Average shift length. Calculated as total hours divided by days worked and average staff per day. 9.9 hours
Licensed Practical Nurse

Assists with medical care and medications.

LPN Staff Info All 43 LPN Staff are full-time employees. No contractors work on this role. 43
Average shift length Info Average shift length. Calculated as total hours divided by days worked and average staff per day. 9.4 hours
Certified Nursing Assistant

Helps with daily care and mobility.

CNA Staff Info All 133 CNA Staff are full-time employees. No contractors work on this role. 133
Average shift length Info Average shift length. Calculated as total hours divided by days worked and average staff per day. 7.7 hours

Contractor staffing

Q4 2025 · Oct 1 – Dec 31 More info This data comes from the CMS Payroll-Based Journal report covering October 1 – December 31, 2025.

Total hours from contractors

8.5%

5,221 contractor hours this quarter

Physical Therapy Aide: 7 Speech Language Pathologist: 5 Physical Therapy Assistant: 3 Respiratory Therapy Technician: 3 Qualified Social Worker: 2 Medical Director: 1

Staff by category

Q4 2025 · Oct 1 – Dec 31 More info This data comes from the CMS Payroll-Based Journal report covering October 1 – December 31, 2025.
Certified Nursing Assistant133013330,66892100%7.7
Licensed Practical Nurse4304314,07792100%9.4
Registered Nurse9092,9919199%9.9
RN Director of Nursing7072,7367784%8
Physical Therapy Aide0771,9758188%7.2
Speech Language Pathologist0551,6459098%6.9
Dietitian3031,58192100%8
Clinical Nurse Specialist3031,5577683%8.2
Mental Health Service Worker7078585964%7.9
Qualified Social Worker0226947379%6.4
Other Dietary Services Staff8086765257%7.8
Respiratory Therapy Technician0335295459%9.1
Nurse Practitioner1015126470%8
Physical Therapy Assistant0333377582%3.4
Administrator1013364246%8
Medical Director011421718%2.4
133 Certified Nursing Assistant
% of Days 100%
43 Licensed Practical Nurse
% of Days 100%
9 Registered Nurse
% of Days 99%
7 RN Director of Nursing
% of Days 84%
7 Physical Therapy Aide
% of Days 88%
5 Speech Language Pathologist
% of Days 98%
3 Dietitian
% of Days 100%
3 Clinical Nurse Specialist
% of Days 83%
7 Mental Health Service Worker
% of Days 64%
2 Qualified Social Worker
% of Days 79%
8 Other Dietary Services Staff
% of Days 57%
3 Respiratory Therapy Technician
% of Days 59%
1 Nurse Practitioner
% of Days 70%
3 Physical Therapy Assistant
% of Days 82%
1 Administrator
% of Days 46%
1 Medical Director
% of Days 18%

Penalties and fines

Federal penalties imposed by CMS for regulatory violations, including civil money penalties (fines) and denials of payment for new Medicare/Medicaid admissions.

Source: CMS Penalties Database

No penalties in the past 3 years

No civil money penalties or payment denials were reported in the last 3 years.

Quality of care over time

These measures show how residents usually do over time at this home, based on health outcomes and preventive care.

High-risk clinical events score Info A composite score based on pressure ulcers, falls with injury, weight loss, walking ability decline, and activities of daily living decline. 6.3
15% better than State average

State average: 7.4

Functional decline score Info A composite score based on activities of daily living decline, walking ability decline, and incontinence. 13.0
In line with State average

State average: 12.4

Long-stay resident measures
Need for Help with Daily Activities Increased Info Percent of long-stay residents whose need for help with daily activities has increased 4.9%
53% better than State average

State average: 10.5%

Walking Ability Worsened Info Percent of long-stay residents whose ability to move independently worsened 10.2%
21% better than State average

State average: 12.9%

Low Risk Residents with Bowel/Bladder Incontinence Info Percent of low risk long-stay residents who lose control of their bowels or bladder 23.8%
75% worse than State average

State average: 13.5%

Falls with Major Injury Info Percent of long-stay residents experiencing one or more falls with major injury 3.1%
17% worse than State average

State average: 2.6%

High Risk Residents with Pressure Ulcers Info Percent of long-stay high risk residents with pressure ulcers 4.9%
9% better than State average

State average: 5.4%

Urinary Tract Infection Info Percent of long-stay residents with a urinary tract infection 2.3%
158% worse than State average

State average: 0.9%

Lost Too Much Weight Info Percent of long-stay residents who lose too much weight 8.3%
39% worse than State average

State average: 6.0%

Depressive Symptoms Info Percent of long-stay residents who have depressive symptoms 45.2%
1251% worse than State average

State average: 3.3%

Antipsychotic Use Info Percent of long-stay residents who received an antipsychotic medication 4.2%
47% better than State average

State average: 8.0%

Pneumococcal Vaccine Info Percent of long-stay residents assessed and appropriately given the pneumococcal vaccine 99.6%
In line with State average

State average: 97.7%

Influenza Vaccine Info Percent of long-stay residents assessed and appropriately given the seasonal influenza vaccine 99.4%
In line with State average

State average: 99.2%

Short-stay resident measures
Pneumococcal Vaccine Info Percent of short-stay residents assessed and appropriately given the pneumococcal vaccine 98.6%
5% better than State average

State average: 94.0%

Antipsychotic medication increase Info Percent of short-stay residents who newly received an antipsychotic medication 2.3%
51% worse than State average

State average: 1.5%

Influenza Vaccine Info Percent of short-stay residents assessed and appropriately given the seasonal influenza vaccine 98.2%
In line with State average

State average: 94.7%

Breakdown by payment type

Medicare

16% of new residents, usually for short-term rehab.

Typical stay 2 - 3 months

Private pay

77% of new residents, often for short stays.

Typical stay 1 - 2 months

Medicaid

7% of new residents, often for long-term daily care.

Typical stay 5 years

Facility Characteristics

Source: CMS Long-Term Care Facility Characteristics (Data as of Jan 2026)

Total residents 159
Medicare
53
33.3% of residents
Medicaid
53
33.3% of residents
Private pay or other
53
33.3% of residents
Programs & Services
Residents Group

Residents meet regularly to discuss policies, care quality, and activities

Active Resident Council

Organized group of residents that meets regularly to discuss facility policies, quality of life, and activities.

Finances and operations

Based on CMS SNF Cost Report for fiscal year ending in 11/2023.

For-profit
Operated by a single business entity.
Net patient revenue Info Net patient revenue — what the home actually collects for resident care, after contractual allowances, bad debt and discounts are subtracted from its gross charges (CMS cost report, Worksheet G-3). It covers resident care only; money the home earns from other sources is shown separately as "Other income."
$12.6M
Net patient income Info Net patient income: net patient revenue minus the home's total operating expenses. A positive figure means it earns more from resident care than it spends to deliver it; a negative figure means the opposite. It excludes non-operating "other income."
-$718.0K
For-profit Operated by a single business entity.
Net patient revenue Info Net patient revenue — what the home actually collects for resident care, after contractual allowances, bad debt and discounts are subtracted from its gross charges (CMS cost report, Worksheet G-3). It covers resident care only; money the home earns from other sources is shown separately as "Other income."
$12.6M Rank #194 / 257Revenue — State benchmarkedThis home is ranked 194th out of 257 homes in Florida. Shows this facility's annual revenue compared to the Florida average. Higher revenue generally means more resources for staffing and capital — read alongside Payroll %.Rankings are based only on facilities in Florida that report data for that category. Facilities without available data are excluded from the ranking.Click the rank badge to see the full State ranking.Click here to see the full State ranking.
Net patient income Info Net patient income: net patient revenue minus the home's total operating expenses. A positive figure means it earns more from resident care than it spends to deliver it; a negative figure means the opposite. It excludes non-operating "other income."
-$718.0K
Other income Info Money the home earns outside of resident care — such as investments, grants, rentals and other non-operating sources (CMS cost report, Worksheet G-3). It is tracked separately from net patient revenue: it is not part of that figure, and it is not included in net patient income.
-$532.2K
Payroll costs Info Staff salaries plus wage-related costs — benefits such as payroll taxes, health insurance and retirement — from the home's own accounting records (CMS cost report, Worksheet A). Contract or agency labor is counted separately, under other operating costs. Rank #189 / 257Payroll — State benchmarkedThis home is ranked 189th out of 257 homes in Florida. Shows total annual staff payroll benchmarked to the Florida average. Higher payroll investment relative to peers often signals better staffing and less reliance on cheaper contract labor.Rankings are based only on facilities in Florida that report data for that category. Facilities without available data are excluded from the ranking.Click the rank badge to see the full State ranking.Click here to see the full State ranking.
$5.1M 40.1% of net patient revenue Info Payroll as a share of revenue: staff salaries and wage-related benefits divided by net patient revenue. A higher figure means more of each revenue dollar goes to staff pay. Rank #94 / 257Payroll % — State benchmarkedThis home is ranked 94th out of 257 homes in Florida. Shows payroll as a percentage of revenue versus the Florida average. Well-run Florida facilities typically land around 49–56% — the top third Statewide. Below 25% may signal understaffing or heavy agency use — read with Staffing ratings.Rankings are based only on facilities in Florida that report data for that category. Facilities without available data are excluded from the ranking.Click the rank badge to see the full State ranking.Click here to see the full State ranking.
Other operating costs Info Everything it costs to run the home apart from payroll — food, utilities, supplies, maintenance, contract labor and administration. Calculated as total operating expense minus payroll (staff salaries and wage-related benefits).
$8.3M
Total costs Info The home's total operating expense for the year — all the costs of running it, salaries included (CMS cost report, Worksheet G-3).
$13.4M

What does this home offer?

Housing options icon

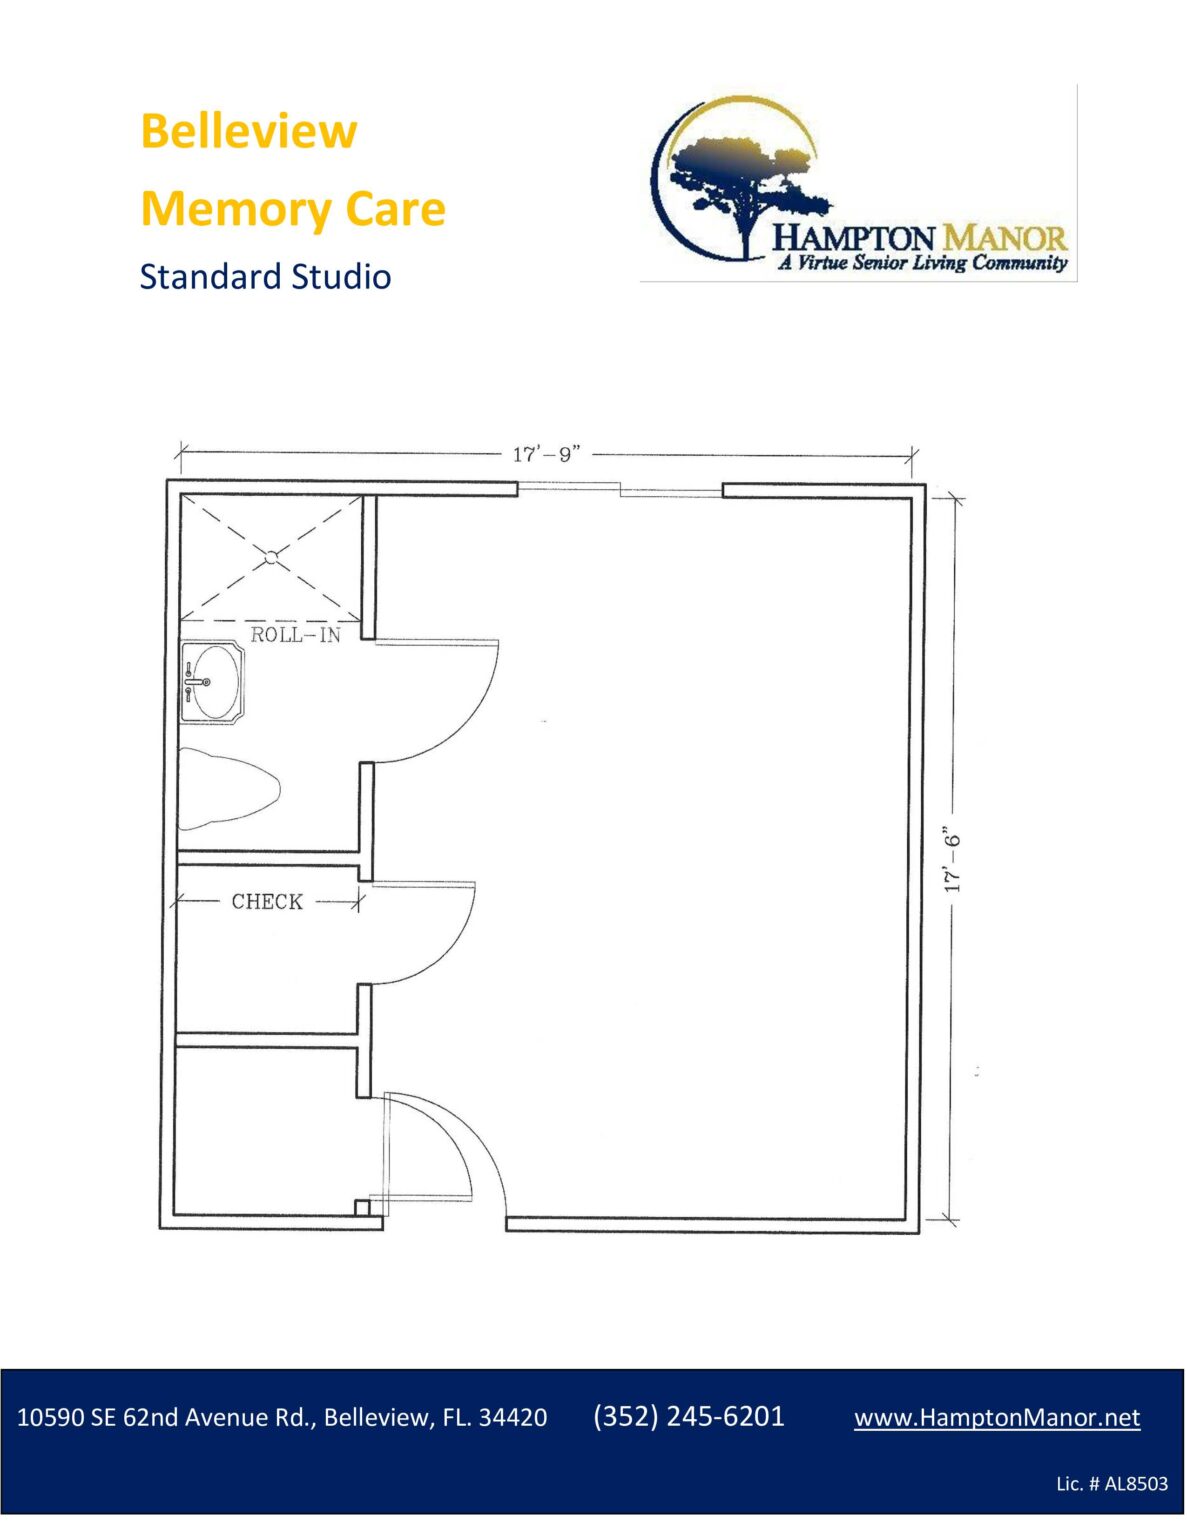
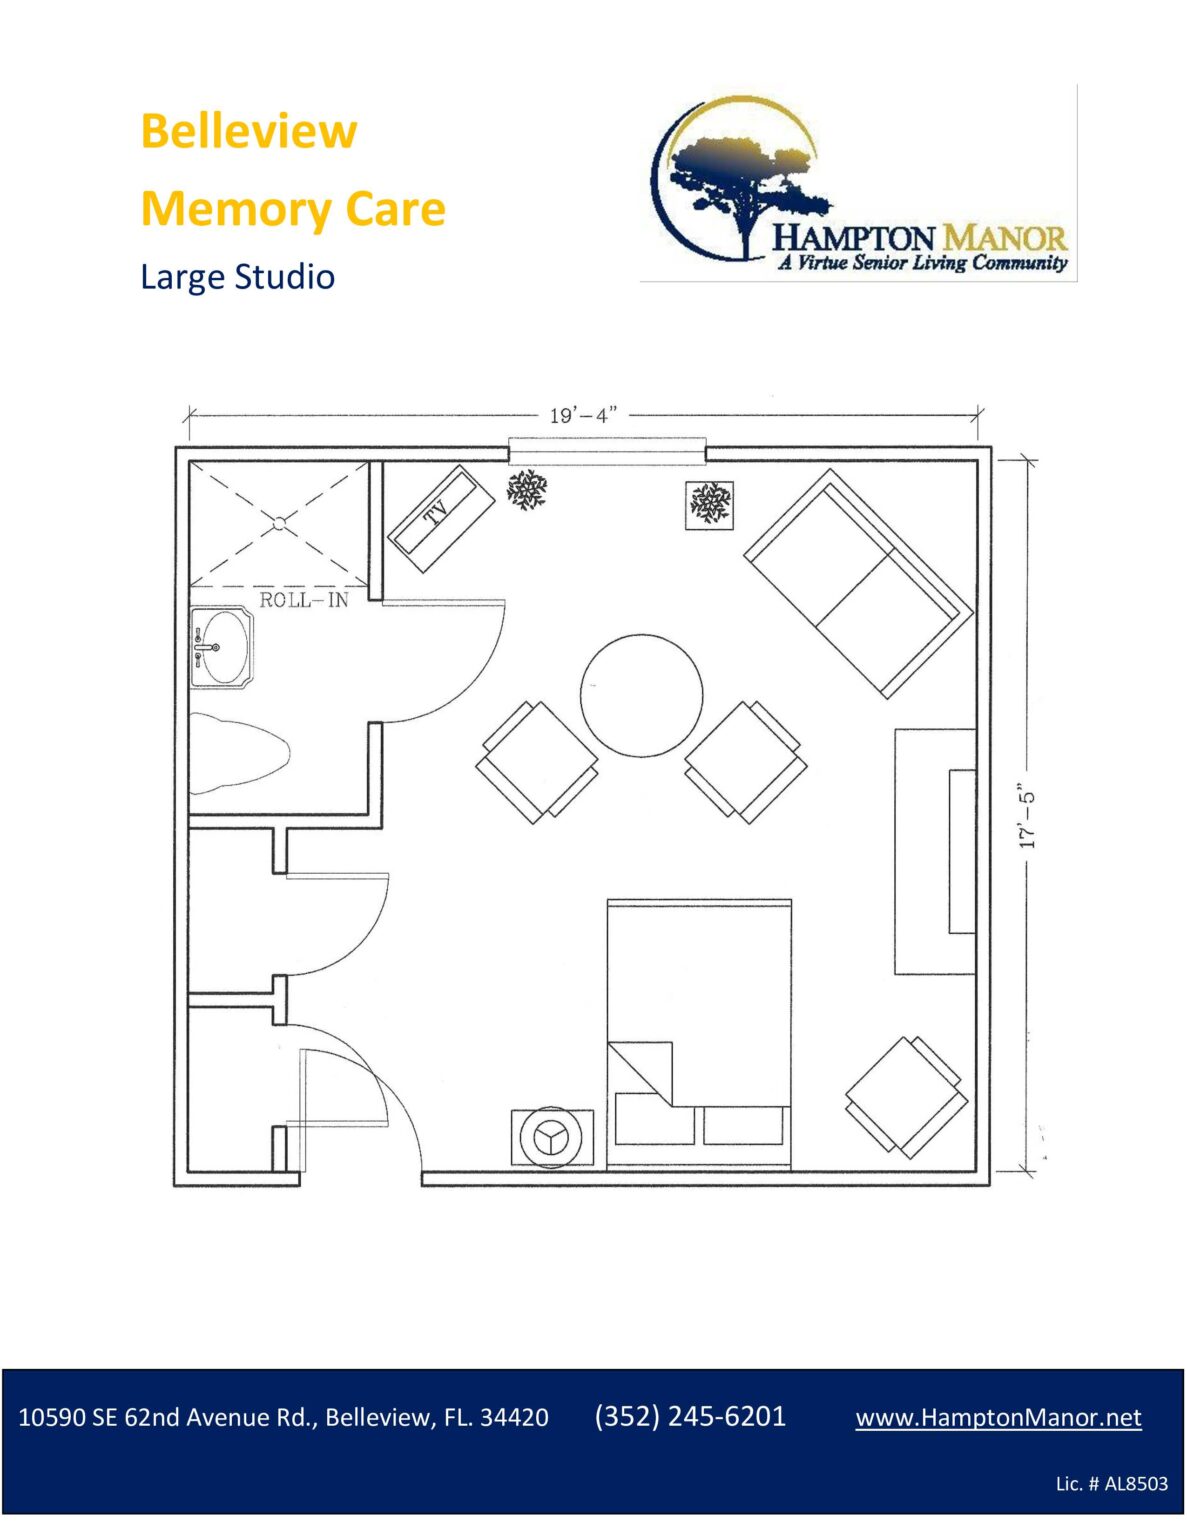
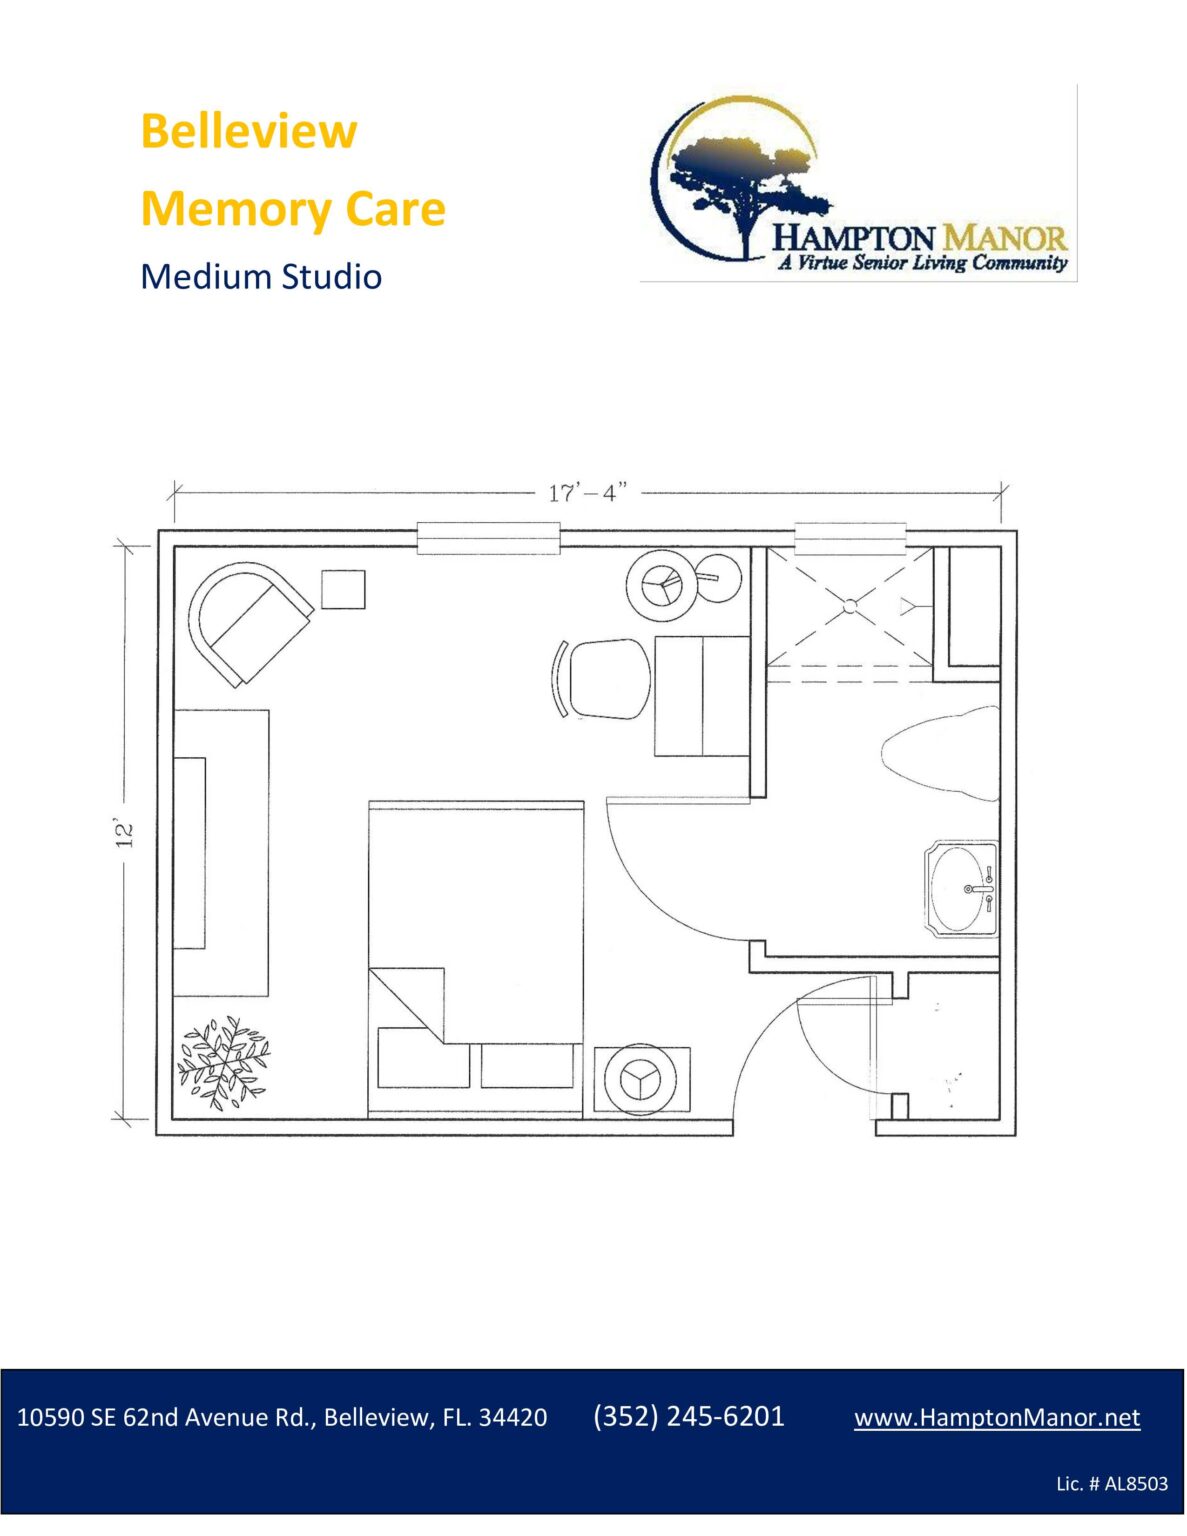
Housing Options: Studio

Who this home usually serves

TYPE OF STAY

Primarily short stays

Residents typically stay for brief periods, with frequent admissions and discharges throughout the year.

Most new residents arrive under private pay (77% of admissions), and a typical private pay stay runs around 1 - 2 months.

Admissions
237 total

Coverage residents most often arrive under.

Medicare 16%
Private pay 77%
Medicaid 7%
Discharges
503 total

Coverage residents most often leave under.

Medicare 9%
Private pay 51%
Medicaid 40%

Living Spaces & Floor Plans for Hampton Manor at 24th Road

Places of interest near Hampton Manor at 24th Road

Address 2.8 miles from city center Info Estimated distance in miles from Ocala's city center to Hampton Manor at 24th Road's address, calculated via Google Maps.

Calculate Travel Distance to Hampton Manor at 24th Road

Add your location

Address

Compare Nursing Homes around the area

The information below is reported by the Florida Agency for Health Care Administration (AHCA).

Hampton Manor at 24th Road
NH
AL
IL
MC
Ocala -180 - 13 Studio
Terracina Grand
NH
AL
IL
MC
RC
Naples -200 A+ 12 Studio / 1 Bed / 2 Bed
Brookdale DeLand
NH
AL
MC
Deland (Scarlett) -89 A+ 14 Studio / Suite

Frequently Asked Questions about Hampton Manor at 24th Road

Is Hampton Manor at 24th Road in a walkable area?

Hampton Manor at 24th Road has a walk score of 13. Car-dependent. Most errands require a car, with limited nearby walkable options.

What is the occupancy rate at Hampton Manor at 24th Road?

Hampton Manor at 24th Road's occupancy is 77.1%.

Does Hampton Manor at 24th Road operate as a for-profit or non-profit?

Hampton Manor at 24th Road is registered as a for-profit.

Are there photos of Hampton Manor at 24th Road?

Yes — there are 4 photos of Hampton Manor at 24th Road in the photo gallery on this page.

What is the address of Hampton Manor at 24th Road?

Hampton Manor at 24th Road is located at 1500 Se 24Th Rd, Ocala, FL 34471.

What is the phone number of Hampton Manor at 24th Road?

(855) 430-0035 will put you in contact with the team at Hampton Manor at 24th Road.

Is Hampton Manor at 24th Road Medicare or Medicaid certified?

Yes — Hampton Manor at 24th Road is a CMS-certified provider of Medicare and Medicaid.

Guides for Better Senior Living

Care Cost Calculator: See Prices in Your Area

Nursing Home Data Explorer

Don’t Wait Too Long: 7 Red Flag Signs Your Parent Needs Assisted Living Now

The True Cost of Assisted Living in 2025 – And How Families Are Paying For It

Understanding Senior Living Costs: Pricing Models, Discounts & Financial Assistance