Haven Post Acute

Nursing Home
Overview of Haven Post Acute

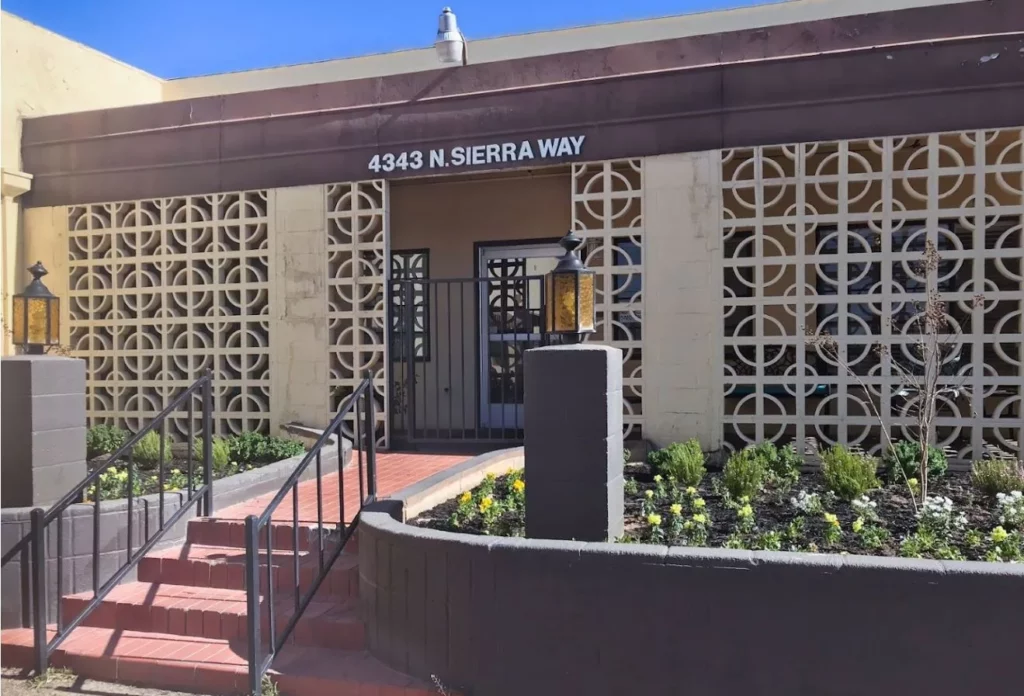
Haven Post Acute, is a facility in San Bernardino, CA that provides skilled nursing and rehabilitation services to its residents. Their quality of care is evident through the services they offer; from diabetic management and education, dementia care, pain management, and restorative nursing among others. The residents of Haven Post Acute are also provided 24/7 supervision, assistance with daily activities such as bathing and dining, and medication management and administration.

In this skilled nursing facility, residents also enjoy a variety of amenities and services that helps boost their overall well being.  Weekly and monthly height and weight monitoring ensure that residents are getting enough nutrition they need, meal provisions and oral supplements are provided with consideration to their dietary needs, and exercises are regularly scheduled to improve the residents’ range of motion.

(909) 882-3316

Managed by Kyle Dahl

Administrator

Kyle Dahl serves as the Administrator at Haven Post Acute, providing leadership and oversight to ensure quality care and operational excellence within the community. He is dedicated to fostering a supportive environment for residents and staff alike.

Quality ratings

Measured by Centers for Medicare & Medicaid Services (CMS)

Overall rating Info Official CMS rating based on health inspections, staffing and quality measures.
4/5
California average: 3.1/5
Health Inspection Info Official CMS rating based on deficiencies found during state health inspections.
4/5
California average: 2.8/5
Staffing Info Official CMS rating based on nurse staffing hours per resident per day.
3/5
California average: 3.1/5
Quality Measures Info Official CMS rating based on clinical outcomes for residents.
4/5
California average: 4.1/5

Nursing care per resident

Info Average daily nursing hours per resident (adjusted for acuity). Higher values indicate more nursing time per resident.
4h 46m per day

This home provides 13% more nursing time per resident than the state average.

California average: 4h 13m per day

Staffing hours breakdown

Info Hours of care per resident per day, broken down by staff type. Data from CMS Medicare.
Staff type Facility State avg National avg
Registered Nurse (RN) Info Registered nurse hours per resident per day. 18m per day 39m per day 41m per day
LPN / LVN Info Licensed Practical Nurse / Licensed Vocational Nurse hours per resident per day. 1h 11m per day 1h 13m per day 52m per day
Nurse Aide Info Nurse aide hours per resident per day. 2h 39m per day 2h 39m per day 2h 21m per day
Total Nursing (Weekend) Info Total number of nurse staff hours per resident per day on weekends. 3h 45m per day 4h 5m per day 3h 26m per day
RN (Weekend) Info Registered nurse hours per resident per day on weekends. 15m per day 30m per day 29m per day

Capacity and availability

Smaller home

May offer a more intimate, personalized care environment.

Total beds 99

This home usually has limited availability

Occupancy is moderate, suggesting balanced demand.

Similar demand to the California average
Occupancy rate 93.2%
Residents per day (avg) 92
Occupancy rate
93.2%
Residents per day (avg)
92

Who this home usually serves

TYPE OF STAY

Mostly long-term care residents

Most residents stay for extended periods and receive ongoing daily care.

Might be optimal for
Long-term daily care Ongoing support needs

Breakdown by payment type

Medicare

10% of new residents, usually for short-term rehab.

Typical stay 1 - 2 months

Private pay

1% of new residents, often for short stays.

Typical stay 25 years

Medicaid

89% of new residents, often for long-term daily care.

Typical stay 15 days

Finances and operations

Proprietary home
Other
Home revenue
$15.8M
Operating loss
-$84.2K
Proprietary home Other
Home revenue
$15,769,041.00
Operating loss
$-84,178.00
Payroll costs Info The portion of the home's budget spent on staff, including nurses, caregivers, and other employees who support care and operations.
$6.1M
38.5% of revenue
Other operating costs Info All remaining costs needed to run the home, such as food, utilities, building maintenance, supplies and administrative expenses.
$9.8M
Total costs $15.9M
Walk Score
Walk Score: 67 / 100
Moderately walkable. Some errands can be accomplished on foot, with a mix of nearby amenities.

About this community

Care Services

Accepts Medicaid
Nursing Services
Rehabilitation Services
Skilled Nursing

Amenities & Lifestyle

Televisions in every room
telephones at every bedside

Programs & Activities

Specific Programs
Skilled Nursing, Rehabilitation, Post-Acute Care, Activities, Social Services
Operating Hours
24 hours a day

Types of Care at Haven Post Acute

Skilled Nursing
Contact Haven Post Acute

Compare Nursing Homes around San Bernardino

The information below is reported by the California Department of Social Services and Department of Public Health.
Arrowhead Healthcare Center
AL

Assisted Living For seniors needing help with daily tasks but not full-time nursing.

SNF

Nursing Homes 24/7 care needed

San Bernardino (Wildwood Park)
58
No
-
79
ARROWHEAD HEALTHCARE CENTER LLC
96.5%
$12,421,097.00
$6,513,570.00
52.4%
55.60
5/5
4.8497
4/5
4/5
5/5
-
21
-
-22%
+15%
+14%
Haven Post Acute
AL

Assisted Living For seniors needing help with daily tasks but not full-time nursing.

SNF

Nursing Homes 24/7 care needed

San Bernardino (Del Rosa)
99
No
-
67
-
93.2%
$15,757,223.00
$6,063,777.00
38.5%
92.00
4/5
4.7702
4/5
3/5
4/5
3
25
1
-50%
+13%
+10%
Waterman Canyon Post Acute
AL

Assisted Living For seniors needing help with daily tasks but not full-time nursing.

SNF

Nursing Homes 24/7 care needed

San Bernardino
166
No
A+
63
JENKINS, NICOLETTA
93.6%
$33,616,309.00
$11,333,305.00
33.7%
158.70
4/5
3.5266
4/5
3/5
4/5
-
46
-
-30%
-16%
+11%
Del Rosa Villa Post Acute
AL

Assisted Living For seniors needing help with daily tasks but not full-time nursing.

SNF

Nursing Homes 24/7 care needed

San Bernardino (Pacific)
104
No
-
74
ESKANDER, ASHRAF
87.8%
$23,642,888.00
$7,322,906.00
31%
93.80
1/5
3.1480
2/5
1/5
4/5
1
31
1
-68%
-25%
+4%

Places of interest near Haven Post Acute

Address 4.1 miles from city center — 1.13 miles to nearest hospital (St. Bernardine Medical Center)

Address 1311 E Date St, San Bernardino, CA 92404

Calculate Travel Distance to Haven Post Acute

Add your location

Address

Staffing Data

Source: CMS Payroll-Based Journal (Q2 2025)

139
Total Staff
138
Employees
1
Contractors
37,400
Total Hours (Quarter)
55
Avg Staff/Day
7.5
Avg Shift (hrs)
Nursing Staff Breakdown
Role Count Avg Shift (hrs) Uses Contractors?
Registered Nurse 6 7.3 No
Licensed Practical Nurse 28 7.7 Yes
Certified Nursing Assistant 93 7.4 No
Staff by Category
Administration
1 staff
8hs shift avg
Nursing Staff
130 staff
7.4hs shift avg
Physicians & Practitioners
1 staff
8hs shift avg
Therapy Services
0 staff
0hs shift avg
Activities & Recreation
0 staff
0hs shift avg
Social Services
0 staff
0hs shift avg
Dietary Services
5 staff
7.8hs shift avg
Other Services
2 staff
7.7hs shift avg
Contractor Analysis
0.1%
of total hours from contractors
46 contractor hours this quarter
Licensed Practical Nurse: 1
Role Employees Contractors Total Staff Total Hours Days Worked % of Days Avg Shift (hrs)
Certified Nursing Assistant 93 0 93 22,930 91 100% 7.4
Licensed Practical Nurse 27 1 28 9,048 91 100% 7.7
Registered Nurse 6 0 6 1,973 91 100% 7.3
RN Director of Nursing 3 0 3 914 68 75% 7.6
Other Dietary Services Staff 4 0 4 760 79 87% 7.8
Nurse Practitioner 1 0 1 512 64 70% 8
Mental Health Service Worker 1 0 1 496 62 68% 8
Dental Services Staff 1 0 1 386 52 57% 7.4
Dietitian 1 0 1 205 26 29% 7.9
Administrator 1 0 1 176 22 24% 8

Health Inspection History

Inspections
Total health inspections 10

California average 12.5


Last Health inspection on Mar 2025

Total health citations 25
Citations per inspection
2.5

Health citations are formal notices following inspections when they fail to comply with safety and care standards.

16 of 25 citations resulted from standard inspections; and 9 of 25 resulted from complaint investigations.

Breakdown of citation severity (last 3 years)
Critical Health citations More info 1
150% worse than California average

California average: 0.4


Serious Health citations More info 0
100% better than California average

California average: 1

1 critical citation More info California average: 0.4

0 serious citations More info California average: 1

24 moderate citations More info California average: 47.2

0 minor citations More info California average: 1.5
Citations history (last 3 years)
Nutrition moderate citation Mar 06, 2025
Corrected

Pharmacy moderate citation Mar 06, 2025
Corrected

Pharmacy moderate citation Mar 06, 2025
Corrected

Pharmacy moderate citation Mar 06, 2025
Corrected

Facility Characteristics

Source: CMS Long-Term Care Facility Characteristics (Data as of Jan 2026)

Ownership: For-Profit LLC
Part of: Buena Vista Healthdare
Resident Census by Payment Source
89 Total Residents
Medicare 7 (7.9%)
Medicaid 54 (60.7%)
Private Pay/Other 28 (31.5%)
Programs & Services
Residents' Group
Nurse Aide Training
Family Engagement

Active councils help families stay involved in care decisions and facility operations.

Quality of care over time

These measures show how residents usually do over time at this home, based on health outcomes and preventive care.

High-risk clinical events score Info A composite score based on pressure ulcers, falls with injury, weight loss, walking ability decline, and activities of daily living decline. 6.9
In line with California average

California average: 6.6

Functional decline score Info A composite score based on activities of daily living decline, walking ability decline, and incontinence. 11.8
In line with California average

California average: 11.3

Long-stay resident measures
Need for Help with Daily Activities Increased Info Percent of long-stay residents whose need for help with daily activities has increased 7.9%
29% better than California average

California average: 11.1%

Walking Ability Worsened Info Percent of long-stay residents whose ability to move independently worsened 14.7%
23% worse than California average

California average: 12.0%

Low Risk Residents with Bowel/Bladder Incontinence Info Percent of low risk long-stay residents who lose control of their bowels or bladder 13.0%
15% worse than California average

California average: 11.3%

Falls with Major Injury Info Percent of long-stay residents experiencing one or more falls with major injury 0.0%
100% better than California average

California average: 1.7%

High Risk Residents with Pressure Ulcers Info Percent of long-stay high risk residents with pressure ulcers 5.3%
6% worse than California average

California average: 5.0%

Urinary Tract Infection Info Percent of long-stay residents with a urinary tract infection 0.0%
100% better than California average

California average: 1.2%

Lost Too Much Weight Info Percent of long-stay residents who lose too much weight 6.9%
63% worse than California average

California average: 4.2%

Depressive Symptoms Info Percent of long-stay residents who have depressive symptoms 0.0%
100% better than California average

California average: 6.7%

Antipsychotic Use Info Percent of long-stay residents who received an antipsychotic medication 8.2%
19% better than California average

California average: 10.1%

Pneumococcal Vaccine Info Percent of long-stay residents assessed and appropriately given the pneumococcal vaccine 100.0%
In line with California average

California average: 98.5%

Influenza Vaccine Info Percent of long-stay residents assessed and appropriately given the seasonal influenza vaccine 100.0%
In line with California average

California average: 98.2%

Hospitalizations per 1,000 days Info Number of hospitalizations per 1,000 long-stay resident days. 1.77
21% better than California average

California average: 2.25

ED visits per 1,000 days Info Number of outpatient emergency department visits per 1,000 long-stay resident days. 0.65
59% better than California average

California average: 1.59

Short-stay resident measures
Pneumococcal Vaccine Info Percent of short-stay residents assessed and appropriately given the pneumococcal vaccine 100.0%
6% better than California average

California average: 94.0%

Antipsychotic medication increase Info Percent of short-stay residents who newly received an antipsychotic medication 0.5%
65% better than California average

California average: 1.5%

Influenza Vaccine Info Percent of short-stay residents assessed and appropriately given the seasonal influenza vaccine 98.5%
6% better than California average

California average: 93.2%

Re-hospitalized after SNF stay Info Percentage of short-stay residents who were re-hospitalized after their nursing home admission. 26.8%
16% worse than California average

California average: 23.2%

Emergency department visits Info Percentage of short-stay residents who had an outpatient emergency department visit. 19.0%
70% worse than California average

California average: 11.2%

Falls with major injury Info Percentage of SNF residents who experience falls with major injury during their stay. 0.0%
100% better than California average

California average: 0.8%

Ability to care for self at discharge Info Percentage of residents at or above expected ability to care for themselves at discharge. 71.1%
32% better than California average

California average: 53.7%

Successful return to home or community Info Rate of successful return to home or community from a skilled nursing facility. 35.8%
29% worse than California average

California average: 50.6%

Penalties and fines

Federal penalties imposed by CMS for regulatory violations, including civil money penalties (fines) and denials of payment for new Medicare/Medicaid admissions.

Source: CMS Penalties Database (Data as of Jan 2026)

Total fines amount $56K
In line with California average

California average: $55K

Number of fines 3
27% more fines than California average

California average: 2.4

Payment Denials Info Serious action where Medicare and/or Medicaid temporarily stops payments for new residents until issues are fixed. 1
102% more payment denials than California average

California average: 0.5

Fines amount comparison
This facility $56K
California average $55K
Penalty History

Penalties are imposed by CMS for violations of federal nursing home regulations.

Civil Money Penalty Info Fines imposed for noncompliance, which can be assessed per day or per instance of violation. Mar 10, 2024
$38K
Payment Denial Info Serious action where Medicare and/or Medicaid temporarily stops payments for new residents until issues are fixed. Mar 10, 2024
16 days
Civil Money Penalty Info Fines imposed for noncompliance, which can be assessed per day or per instance of violation. Aug 7, 2023
$5K
Civil Money Penalty Info Fines imposed for noncompliance, which can be assessed per day or per instance of violation. Jul 17, 2023
$14K

Last updated: Jan 2026

Guides for Better Senior Living

Care Cost Calculator: See Prices in Your Area

Nursing Home Data Explorer

Don’t Wait Too Long: 7 Red Flag Signs Your Parent Needs Assisted Living Now

The True Cost of Assisted Living in 2025 – And How Families Are Paying For It

Understanding Senior Living Costs: Pricing Models, Discounts & Financial Assistance

Financial Aid for California Seniors

Get financial aid guidance

Multipurpose Senior Services Program

MSSP (Medi-Cal Waiver)

Age 65+, California resident, Medi-Cal eligible, nursing home risk.

~$2,829/month (300% FBR, individual).

$2,000 (individual), $3,000 (couple).

County-managed; waitlists possible.

In-Home Supportive Services (IHSS)

California IHSS

Age 65+, California resident, Medicaid-eligible or low-income.

~$1,732/month (individual, Medi-Cal threshold).

$2,000 (individual).

Can hire family as caregivers.

Multipurpose Senior Services Program (MSSP)

CA MSSP

Age 65+, California resident, Medi-Cal-eligible, nursing home-eligible but community-capable.

~$2,829/month (300% FBR, individual).

$2,000 (individual).

Available in 38 counties; waitlists common.

Property Tax Postponement Program (PTP)

CA PTP

Age 62+, California resident, own and live in home, 40% equity.

~$51,500/year (household, adjusted annually).

Equity-based; no strict asset cap.

Deferred taxes accrue interest (5% as of 2024); repaid upon sale/death.

Assisted Living Waiver (ALW)

CA ALW

Age 65+ or disabled, California resident, Medi-Cal-eligible, nursing home-eligible.

~$2,829/month (300% FBR, individual).

$2,000 (individual).

Available in 15 counties (e.g., LA, Sacramento); waitlists common.

California CARES Program

CA CARES

Caregivers of California residents 60+ needing help with 3+ daily activities; no caregiver age limit.

No strict limit; cost-sharing above ~$2,500/month threshold.

Not applicable; need-based.

High demand in urban areas; complements IHSS respite.

Low-Income Home Energy Assistance Program (LIHEAP)

CA LIHEAP

Age 60+ priority, California resident, low-income, utility/heating need.

~$2,510/month (200% of poverty level, individual).

Not applicable; income-focused.

High demand in inland/coastal extremes; weatherization capped at $5,000/home.

Who we are

Your Senior Care Partner, Every Step of the Way

We help families find affordable senior communities and unlock same day discounts, Medicaid, and Medicare options tailored to your needs.

Contact us Today
Tour Icon
Planning a tour? Check our touring checklist.
Chat Icon
Thinking of living here? We can help you speak to a current resident