Arrowhead Healthcare Center
Nursing Home & Skilled Nursing · San Bernardino, CA
CMS overall rating Info CMS (the Centers for Medicare & Medicaid Services) is the federal agency that rates nursing home quality. Its Overall Rating runs from 1 to 5 stars, combining health inspections, staffing, and quality measures, with inspections weighted most heavily.

Arrowhead Healthcare Center

Nursing Home & Skilled Nursing · San Bernardino, CA
CMS overall rating Info CMS (the Centers for Medicare & Medicaid Services) is the federal agency that rates nursing home quality. Its Overall Rating runs from 1 to 5 stars, combining health inspections, staffing, and quality measures, with inspections weighted most heavily.
Calculator: See prices in your area
Arrowhead Healthcare Center accepts Medicare, Medicaid, and private pay.

Overview of Arrowhead Healthcare Center

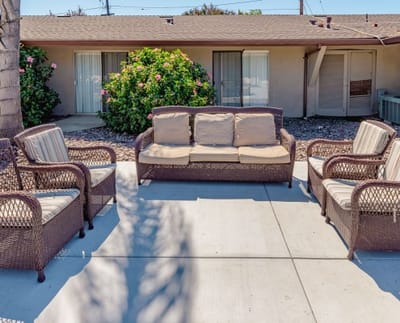
Arrowhead Healthcare Center, located in San Bernardino, CA, is a skilled nursing facility with a CMS four-star rating for over two years. This skilled nursing facility is dedicated to providing top quality care for over 40 years, employing well trained and certified staff to ensure the residents physical and psychosocial well being. At Arrowhead, residents may receive care for cardiac rehabilitation, diabetic care, stroke rehabilitation, post surgical recovery, and pain management.

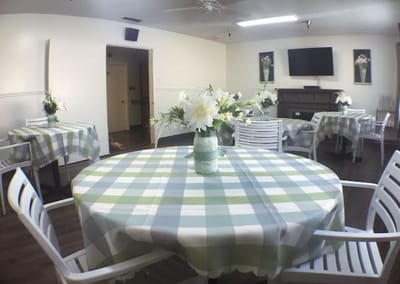
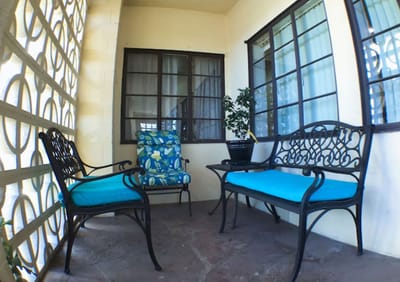
Part of their services also include comfortable rooms featuring smart TV’s, on-site barber and beauty services, as well as a rich array of activities to keep the residents engaged and energized. Their meal selections are also prepared according to the residents dietary needs, to ensure that they receive proper nutrition to heal, as well as live a happy, fulfilling life.

Quality ratings

Measured by Centers for Medicare & Medicaid Services (CMS)

Overall rating Info The Overall CMS Rating combines results from health inspections, staffing levels and quality measures. Health inspections carry the most weight. Staffing and quality scores can increase or decrease the final rating based on performance compared to state and national standards.
▲ 38.9% Above CA avg. ▲ 38.9% Above CA avg.Click the badge to see the full State ranking.Click here to see the full State ranking.
Health Inspection Info Based on the results of the facility's three most recent standard inspections and any complaint investigations. CMS reviews the number, scope, and severity of deficiencies, with more recent findings weighted more heavily.
▲ 27.0% Above CA avg. ▲ 27.0% Above CA avg.Click the badge to see the full State ranking.Click here to see the full State ranking.
Staffing Info Measures average nursing staff hours per resident per day, including Registered Nurses (RNs) and total nursing staff. Ratings are adjusted based on the level of care residents require and are compared to state and national benchmarks.
▲ 15.9% Above CA avg. ▲ 15.9% Above CA avg.Click the badge to see the full State ranking.Click here to see the full State ranking.
Quality Measures Info Based on clinical and physical health indicators reported to CMS, such as hospital readmissions, falls, pressure ulcers, and improvements in mobility. These measures reflect how well residents' health needs are being managed.
▲ 17.4% Above CA avg. ▲ 17.4% Above CA avg.Click the badge to see the full State ranking.Click here to see the full State ranking.

Staffing hours breakdown

Info Daily nursing hours per resident by staff type, reported to CMS. Higher is generally better — compare this facility to state and national averages to see where staffing stands.

Hours per resident per day — compared to California state averages

Total nursing care / resident Info This home is ranked 59th out of 345 homes in California for nurse hours. Total adjusted nursing hours per resident per day, combining RN, LPN, and aide time. CMS adjusts this for case-mix so facilities can be fairly compared.
4h 51m per day
Rank #59 / 345Nurse hours — State benchmarkedThis home is ranked 59th out of 345 homes in California. Shows adjusted nurse hours per resident per day benchmarked to the California average, with a ranking across 345 California facilities. More hours mean more direct care. The national average is about 3.5 hrs; below 3.0 is a red flag.Click the rank badge to see the full State ranking.Click here to see the full State ranking.
This facility California avg (4h 23m per day)
vs California avg
+11%

4 of 6 metrics below state avg

Standout metric Nurse Aide is +14% above state avg
Staff typeHours / Day / Residentvs state avg
Registered Nurse (RN) Info RNs hold the highest nursing license and can assess residents, interpret test results, and direct care plans. More RN hours per day often signals stronger clinical oversight and faster response to health changes. 25m per day ▼ 35% State avg: 39m per day · National avg: 41m per day
LPN / LVN Info Licensed Practical Nurses (LPNs) or Licensed Vocational Nurses (LVNs) deliver routine hands-on care — medication administration, wound dressing, and monitoring vital signs. They work under RN supervision and make up a large share of daily bedside care. 1h 14m per day ■ Avg State avg: 1h 13m per day · National avg: 52m per day
Nurse Aide Info Certified Nurse Aides (CNAs) provide the most direct day-to-day assistance: bathing, dressing, feeding, and mobility. Nurse aide hours are typically the largest staffing category and directly affect residents' quality of life. 3h 1m per day ▲ 14% State avg: 2h 39m per day · National avg: 2h 21m per day
Weekend Total Nursing Info Combined nursing hours (RN + LPN + Nurse Aide) per resident per day on weekends. Staffing often drops on weekends — this figure reveals whether the facility maintains adequate coverage outside of weekday hours. 3h 55m per day ▼ 4% State avg: 4h 5m per day · National avg: 3h 26m per day
Physical Therapist Info Hours per resident per day provided by licensed Physical Therapists (PTs) or PT Assistants. PT services help residents recover mobility after injury or illness and are especially important for post-acute (short-stay) rehabilitation. 1m per day ▼ 88% State avg: 5m per day · National avg: 4m per day
Weekend RN Info Registered nurse hours specifically on weekends. Facilities sometimes reduce RN presence on Saturdays and Sundays — a low weekend RN figure compared to weekday hours can indicate reduced clinical oversight when most administrative staff are absent. 15m per day ▼ 50% State avg: 30m per day · National avg: 29m per day

Capacity and availability

This home is often near full

Higher occupancy than the California average: 84.7%
Occupancy rate
100% Rank #1 / 1530Occupancy rate — State benchmarkedThis home is ranked 1st out of 1530 homes in California. Shows this facility's occupancy rate versus the California average, with its Statewide rank out of 1530. Higher occupancy signals strong local demand and financial stability.Click the rank badge to see the full State ranking.Click here to see the full State ranking.
Avg. Length of Stay
305 days
Walk Score
Walk Score: 79 / 100 Rank #451 / 2092Walk Score — State benchmarkedThis home is ranked 451st out of 2092 homes in California. Shows how walkable this facility's neighborhood is compared to the average Walk Score across California facilities. Higher scores benefit residents, families, and staff.Click the rank badge to see the full State ranking.Click here to see the full State ranking.
Very walkable. Most errands can be accomplished on foot, and many essentials are within a short walk.

About this community

License Details

CMS Certification Number555896

Staffing

Key information about the people who lead and staff this community.

Leadership

ContactMarylynn Mahan

Therapy & Rehabilitation

1 service
Rehabilitation Services

Amenities & Lifestyle

Specific ProgramsIn-house Therapy

Contact Arrowhead Healthcare Center

Inspection History

In California, the Department of Social Services (for assisted living facilities) and the Department of Public Health (for nursing homes) conduct inspections to ensure resident safety and regulatory compliance.

Health Inspection History

Inspections since 2021
Total health inspections 4

California average 12.5


Last Health inspection on Apr 2025

Total health citations
21 Rank #46 / 352Health citations — State benchmarkedThis home is ranked 46th out of 352 homes in California. Shows this facility's total health deficiency citations benchmarked to the California State average, with a ranking across all 352 CA facilities. Lower citation counts earn a better rank.Click the rank badge to see the full State ranking.Click here to see the full State ranking.

California average 50.2

Citations per inspection
5.25 Rank #258 / 352Citations per inspection — State benchmarkedThis home is ranked 258th out of 352 homes in California. Shows average deficiency citations per CMS inspection for this facility versus the California mean across 352 facilities with citation data. Lower is better.Click the rank badge to see the full State ranking.Click here to see the full State ranking.

California average 4.65


Health citations are formal notices following inspections when they fail to comply with safety and care standards.

20 of 21 citations resulted from standard inspections; and 1 of 21 resulted from complaint investigations.

Breakdown of citation severity (last 5 years)
Critical health citations
0
100% better than California average

California average: 0.4


Serious health citations
0
100% better than California average

California average: 1

0 critical citations California average: 0.4

0 serious citations California average: 1

18 moderate citations California average: 47.2

3 minor citations California average: 1.5
Citations history (last 5 years)
Nursing Services moderate citation Apr 10, 2025
Corrected

Environmental moderate citation Dec 19, 2024
Corrected

Environmental moderate citation Dec 19, 2024
Corrected

Infection Control moderate citation Dec 19, 2024
Corrected

Staffing Data

Reporting period: October 1 – December 31, 2025 (Q4 2025). Source: CMS Payroll-Based Journal report.

Total staff 77
Employees 68
Contractors 9
Staff to resident ratio 1.35 : 1
25% fewer staff per resident than California average
California average ratio: 1.81 : 1 California average ratio: 1.81 : 1See full California ranking
Avg staff/day 41
Average shift 6.8 hours
12% worse than California average
California average: 7.7 hours California average shift: 7.7 hoursSee full California ranking
Total staff hours (quarter) 25,718

Nursing staff breakdown

Q4 2025 · Oct 1 – Dec 31 More info This data comes from the CMS Payroll-Based Journal report covering October 1 – December 31, 2025.
Registered Nurse

Manages medical care and health needs.

RN Staff Info All 4 RN Staff are full-time employees. No contractors work on this role. 4
Average shift length Info Average shift length. Calculated as total hours divided by days worked and average staff per day. 7.2 hours
Licensed Practical Nurse

Assists with medical care and medications.

LPN Staff Info All 14 LPN Staff are full-time employees. No contractors work on this role. 14
Average shift length Info Average shift length. Calculated as total hours divided by days worked and average staff per day. 8 hours
Certified Nursing Assistant

Helps with daily care and mobility.

CNA Staff Info All 43 CNA Staff are full-time employees. No contractors work on this role. 43
Average shift length Info Average shift length. Calculated as total hours divided by days worked and average staff per day. 7.1 hours

Contractor staffing

Q4 2025 · Oct 1 – Dec 31 More info This data comes from the CMS Payroll-Based Journal report covering October 1 – December 31, 2025.

Total hours from contractors

2.9%

746 contractor hours this quarter

Physical Therapy Assistant: 1 Speech Language Pathologist: 1 Respiratory Therapy Technician: 1 Physical Therapy Aide: 1 Medical Director: 1 Occupational Therapy Assistant: 1 Occupational Therapy Aide: 1 Dietitian: 1 Qualified Social Worker: 1

Staff by category

Q4 2025 · Oct 1 – Dec 31 More info This data comes from the CMS Payroll-Based Journal report covering October 1 – December 31, 2025.
Certified Nursing Assistant4304315,31292100%7.1
Licensed Practical Nurse140145,76792100%8
Registered Nurse4041,64392100%7.2
Other Dietary Services Staff2027667480%6.1
Nurse Practitioner1015076368%8
RN Director of Nursing1014956267%8
Physical Therapy Aide0112897076%4.1
Administrator2022453134%7.7
Dental Services Staff1012386166%3.9
Speech Language Pathologist0112016571%3.1
Physical Therapy Assistant011885358%1.7
Respiratory Therapy Technician011514145%1.2
Occupational Therapy Aide011471213%3.9
Qualified Social Worker0113189%3.9
Occupational Therapy Assistant0112133%7
Medical Director011151516%1
Dietitian011311%3
43 Certified Nursing Assistant
% of Days 100%
14 Licensed Practical Nurse
% of Days 100%
4 Registered Nurse
% of Days 100%
2 Other Dietary Services Staff
% of Days 80%
1 Nurse Practitioner
% of Days 68%
1 RN Director of Nursing
% of Days 67%
1 Physical Therapy Aide
% of Days 76%
2 Administrator
% of Days 34%
1 Dental Services Staff
% of Days 66%
1 Speech Language Pathologist
% of Days 71%
1 Physical Therapy Assistant
% of Days 58%
1 Respiratory Therapy Technician
% of Days 45%
1 Occupational Therapy Aide
% of Days 13%
1 Qualified Social Worker
% of Days 9%
1 Occupational Therapy Assistant
% of Days 3%
1 Medical Director
% of Days 16%
1 Dietitian
% of Days 1%

Penalties and fines

Federal penalties imposed by CMS for regulatory violations, including civil money penalties (fines) and denials of payment for new Medicare/Medicaid admissions.

Source: CMS Penalties Database

No penalties in the past 3 years

No civil money penalties or payment denials were reported in the last 3 years.

Quality of care over time

These measures show how residents usually do over time at this home, based on health outcomes and preventive care.

High-risk clinical events score Info A composite score based on pressure ulcers, falls with injury, weight loss, walking ability decline, and activities of daily living decline. 5.1
23% better than California average

California average: 6.6

Functional decline score Info A composite score based on activities of daily living decline, walking ability decline, and incontinence. 8.0
30% better than California average

California average: 11.3

Long-stay resident measures
Significantly above average California avg: 4.2 Info CMS star rating based on long-stay quality measure performance. 5 stars = significantly above average, 1 star = significantly below average.
Need for Help with Daily Activities Increased Info Percent of long-stay residents whose need for help with daily activities has increased 9.6%
13% better than California average

California average: 11.1%

Walking Ability Worsened Info Percent of long-stay residents whose ability to move independently worsened 9.5%
21% better than California average

California average: 12.0%

Low Risk Residents with Bowel/Bladder Incontinence Info Percent of low risk long-stay residents who lose control of their bowels or bladder 4.9%
57% better than California average

California average: 11.3%

Falls with Major Injury Info Percent of long-stay residents experiencing one or more falls with major injury 0.4%
74% better than California average

California average: 1.7%

High Risk Residents with Pressure Ulcers Info Percent of long-stay high risk residents with pressure ulcers 3.6%
27% better than California average

California average: 5.0%

Urinary Tract Infection Info Percent of long-stay residents with a urinary tract infection 1.4%
15% worse than California average

California average: 1.2%

Lost Too Much Weight Info Percent of long-stay residents who lose too much weight 2.5%
41% better than California average

California average: 4.2%

Depressive Symptoms Info Percent of long-stay residents who have depressive symptoms 5.7%
15% better than California average

California average: 6.7%

Antipsychotic Use Info Percent of long-stay residents who received an antipsychotic medication 9.4%
7% better than California average

California average: 10.1%

Pneumococcal Vaccine Info Percent of long-stay residents assessed and appropriately given the pneumococcal vaccine 100.0%
In line with California average

California average: 98.5%

Influenza Vaccine Info Percent of long-stay residents assessed and appropriately given the seasonal influenza vaccine 100.0%
In line with California average

California average: 98.2%

Hospitalizations per 1,000 days Info Number of hospitalizations per 1,000 long-stay resident days. 1.00
56% better than California average

California average: 2.25

ED visits per 1,000 days Info Number of outpatient emergency department visits per 1,000 long-stay resident days. 1.29
19% better than California average

California average: 1.59

Breakdown by payment type

Medicare

20% of new residents, usually for short-term rehab.

Typical stay 1 - 2 months

Private pay

31% of new residents, often for short stays.

Typical stay 1 - 2 months

Medicaid

48% of new residents, often for long-term daily care.

Typical stay 2 years

Facility Characteristics

Source: CMS Long-Term Care Facility Characteristics (Data as of Jan 2026)

Total residents 57
Medicaid
55
96.5% of residents
Private pay or other
2
3.5% of residents
Programs & Services
Residents Group

Residents meet regularly to discuss policies, care quality, and activities

Active Resident Council

Organized group of residents that meets regularly to discuss facility policies, quality of life, and activities.

Finances and operations

Privately-owned community
Operated by a single business entity.
Home revenue
$12.5M
Operating loss
-$1.2M
Privately-owned community Operated by a single business entity.
Home revenue
$12.5M Rank #245 / 346Revenue — State benchmarkedThis home is ranked 245th out of 346 homes in California. Shows this facility's annual revenue compared to the California average. Higher revenue generally means more resources for staffing and capital — read alongside Payroll %.Click the rank badge to see the full State ranking.Click here to see the full State ranking.
Operating loss
-$1.2M
Payroll costs Info The portion of the home's budget spent on staff, including nurses, caregivers, and other employees who support care and operations. Rank #187 / 346Payroll — State benchmarkedThis home is ranked 187th out of 346 homes in California. Shows total annual staff payroll benchmarked to the California average. Higher payroll investment relative to peers often signals better staffing and less reliance on cheaper contract labor.Click the rank badge to see the full State ranking.Click here to see the full State ranking.
$8.1M
65% of revenue Rank #40 / 346Payroll % — State benchmarkedThis home is ranked 40th out of 346 homes in California. Shows payroll as a percentage of revenue versus the California average. Well-run California facilities typically land around 56–67% — the top third Statewide. Below 25% may signal understaffing or heavy agency use — read with Staffing ratings.Click the rank badge to see the full State ranking.Click here to see the full State ranking.
Other operating costs Info All remaining costs needed to run the home, such as food, utilities, building maintenance, supplies and administrative expenses.
$5.6M
Total costs $13.7M

Who this home usually serves

TYPE OF STAY

Mostly long-term care residents

Most residents stay for extended periods and receive ongoing daily care.

Places of interest near Arrowhead Healthcare Center

Address 4.4 miles from city center Info Estimated distance in miles from San Bernardino's city center to Arrowhead Healthcare Center's address, calculated via Google Maps. — 2.33 miles to nearest hospital (St. Bernardine Medical Center)

Calculate Travel Distance to Arrowhead Healthcare Center

Add your location

Address

Financial Assistance for
Nursing Home in California

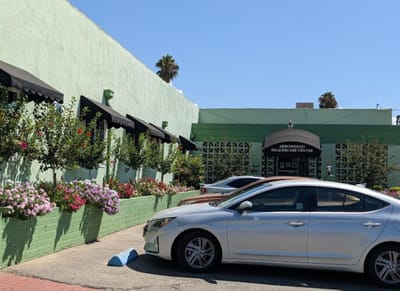
Arrowhead Healthcare Center is located in San Bernardino, California.
Here are the financial assistance programs available to residents in California.

Get Financial aid guidance

Multipurpose Senior Services Program

MSSP (Medi-Cal Waiver)

Age 65+
General California resident, Medi-Cal eligible, nursing home risk.
Income Limits (2025) ~$2,829/month 300% FBR, individual
Asset Limits $2,000 (individual), $3,000 (couple).
CA

County-managed; waitlists possible.

Benefits
In-home support (4-6 hours/day) Respite care (14 days/year) Meals (~$6/meal) Transportation (8 trips/month) Care management

In-Home Supportive Services (IHSS)

California IHSS

Age 65+
General California resident, Medicaid-eligible or low-income.
Income Limits ~$1,732/month individual, Medi-Cal threshold
Asset Limits $2,000 individual
CA

Can hire family as caregivers.

Benefits
Personal care (up to 283 hours/month) Homemaker services Respite (varies)

Multipurpose Senior Services Program (MSSP)

CA MSSP

Age 65+
General California resident, Medi-Cal-eligible, nursing home-eligible but community-capable.
Income Limits ~$2,829/month 300% FBR, individual
Asset Limits $2,000 individual
CA

Available in 38 counties; waitlists common.

Benefits
Case management Respite care (up to 10 days/year) Minor home mods (avg. $500) Adult day care (~$50/day)

Property Tax Postponement Program (PTP)

CA PTP

Age 62+
General California resident, own and live in home, 40% equity.
Income Limits (2025) ~$51,500/year household, adjusted annually
Asset Limits Equity-based; no strict asset cap.
CA

Deferred taxes accrue interest (5% as of 2024); repaid upon sale/death.

Benefits
Property tax deferral (avg. $1,000-$3,000/year, varies by county)

Assisted Living Waiver (ALW)

CA ALW

Age 65+ or disabled
General California resident, Medi-Cal-eligible, nursing home-eligible.
Income Limits ~$2,829/month 300% FBR, individual
Asset Limits $2,000 individual
CA

Available in 15 counties (e.g., LA, Sacramento); waitlists common.

Benefits
Personal care in ALFs (5-7 hours/day) Medication management Social services

California CARES Program

CA CARES

Age
General Caregivers of California residents 60+ needing help with 3+ daily activities; no caregiver age limit.
Income Limits No strict limit; cost-sharing above ~$2,500/month threshold.
Asset Limits Not applicable; need-based.
CA

High demand in urban areas; complements IHSS respite.

Benefits
Respite care (up to 10 days/year) Counseling (4-6 sessions/year) Training (2-3 workshops/year) Supplies (~$200/year)

Compare Nursing Home around San Bernardino

The information below is reported by the California Department of Social Services and Department of Public Health.

4 facilities compared · CMS & CA Dept. of Health data

Arrowhead Healthcare Center
NH

Nursing Home Licensed facility providing 24/7 skilled nursing care for residents with complex, ongoing medical needs. Staffed by RNs, LPNs, and CNAs. Inspected and star-rated annually by CMS. Accepts Medicare (short-term rehab) and Medicaid (long-term care).

AL

Assisted Living A licensed, long-term care setting for seniors or individuals with disabilities who need help with daily activities — like bathing, dressing, and medication management — but not 24-hour skilled nursing. Offers housing, meals, and around-the-clock support while aiming to maximize resident independence.

San Bernardino (Wildwood Park)
58
Facility 58
CA AVG 103
Rank #1102 / 1657
100.0%
Facility 100.0%
CA AVG 84.7%
Rank #1 / 1530
+18%
4.85
Facility 4.85
CA AVG 4.22
Rank #59 / 345
-42%+15%
$0
Facility $0
CA AVG $56.5k
Rank #1 / 352
-
21
Facility 21
CA AVG 50.2
Rank #46 / 352
5.3
Facility 5.3
CA AVG 4.6
Rank #258 / 352
-55-
79
Facility 79
CA AVG 57
Rank #451 / 2092
Arrowhead Healthcare Center LLC
$12.5M
Facility $12.5M
CA AVG $17.0M
Rank #245 / 346
$8.1M
Facility $8.1M
CA AVG $7.0M
Rank #187 / 346
65%
Facility 65%
CA AVG 45.2%
Rank #40 / 346
555896
Haven Post Acute
NH

Nursing Home Licensed facility providing 24/7 skilled nursing care for residents with complex, ongoing medical needs. Staffed by RNs, LPNs, and CNAs. Inspected and star-rated annually by CMS. Accepts Medicare (short-term rehab) and Medicaid (long-term care).

AL

Assisted Living A licensed, long-term care setting for seniors or individuals with disabilities who need help with daily activities — like bathing, dressing, and medication management — but not 24-hour skilled nursing. Offers housing, meals, and around-the-clock support while aiming to maximize resident independence.

San Bernardino (Del Rosa)
99
Facility 99
CA AVG 103
Rank #725 / 1657
93.2%
Facility 93.2%
CA AVG 84.7%
Rank #237 / 1530
+10%
4.77
Facility 4.77
CA AVG 4.22
Rank #59 / 345
-39%+13%
$55.7k
Facility $55.7k
CA AVG $56.5k
Rank #311 / 352
-
25
Facility 25
CA AVG 50.2
Rank #74 / 352
2.5
Facility 2.5
CA AVG 4.6
Rank #30 / 352
196-
67
Facility 67
CA AVG 57
Rank #830 / 2092
-
$15.8M
Facility $15.8M
CA AVG $17.0M
Rank #196 / 346
$8.1M
Facility $8.1M
CA AVG $7.0M
Rank #189 / 346
51.3%
Facility 51.3%
CA AVG 45.2%
Rank #152 / 346
56053
Waterman Canyon Post Acute
NH

Nursing Home Licensed facility providing 24/7 skilled nursing care for residents with complex, ongoing medical needs. Staffed by RNs, LPNs, and CNAs. Inspected and star-rated annually by CMS. Accepts Medicare (short-term rehab) and Medicaid (long-term care).

AL

Assisted Living A licensed, long-term care setting for seniors or individuals with disabilities who need help with daily activities — like bathing, dressing, and medication management — but not 24-hour skilled nursing. Offers housing, meals, and around-the-clock support while aiming to maximize resident independence.

San Bernardino (North Waterman Avenue)
166
Facility 166
CA AVG 103
Rank #270 / 1657
93.6%
Facility 93.6%
CA AVG 84.7%
Rank #224 / 1530
+11%
3.53
Facility 3.53
CA AVG 4.22
Rank #288 / 345
-38%-16%
$0
Facility $0
CA AVG $56.5k
Rank #1 / 352
-
46
Facility 46
CA AVG 50.2
Rank #204 / 352
2.4
Facility 2.4
CA AVG 4.6
Rank #23 / 352
-159A+
63
Facility 63
CA AVG 57
Rank #951 / 2092
Nicoletta Jenkins
$33.6M
Facility $33.6M
CA AVG $17.0M
Rank #34 / 346
$13.0M
Facility $13.0M
CA AVG $7.0M
Rank #57 / 346
38.7%
Facility 38.7%
CA AVG 45.2%
Rank #284 / 346
55565
Del Rosa Villa Post Acute
NH

Nursing Home Licensed facility providing 24/7 skilled nursing care for residents with complex, ongoing medical needs. Staffed by RNs, LPNs, and CNAs. Inspected and star-rated annually by CMS. Accepts Medicare (short-term rehab) and Medicaid (long-term care).

AL

Assisted Living A licensed, long-term care setting for seniors or individuals with disabilities who need help with daily activities — like bathing, dressing, and medication management — but not 24-hour skilled nursing. Offers housing, meals, and around-the-clock support while aiming to maximize resident independence.

San Bernardino (Pacific)
104
Facility 104
CA AVG 103
Rank #684 / 1657
--
3.15
Facility 3.15
CA AVG 4.22
Rank #336 / 345
-31%-25%
$43.9k
Facility $43.9k
CA AVG $56.5k
Rank #295 / 352
-
31
Facility 31
CA AVG 50.2
Rank #114 / 352
2.8
Facility 2.8
CA AVG 4.6
Rank #45 / 352
195-
74
Facility 74
CA AVG 57
Rank #598 / 2092
Ashraf Eskander
$23.7M
Facility $23.7M
CA AVG $17.0M
Rank #99 / 346
$8.4M
Facility $8.4M
CA AVG $7.0M
Rank #177 / 346
35.5%
Facility 35.5%
CA AVG 45.2%
Rank #310 / 346
555195

Frequently Asked Questions about Arrowhead Healthcare Center

What neighborhood is Arrowhead Healthcare Center in?

Arrowhead Healthcare Center is in the Wildwood Park neighborhood of San Bernardino.

Is Arrowhead Healthcare Center in a walkable area?

Arrowhead Healthcare Center has a walk score of 79. Very walkable. Most errands can be accomplished on foot, and many essentials are within a short walk.

What is the occupancy rate at Arrowhead Healthcare Center?

Arrowhead Healthcare Center's occupancy is 96.5%.

Are there photos of Arrowhead Healthcare Center?

Yes — there are 6 photos of Arrowhead Healthcare Center in the photo gallery on this page.
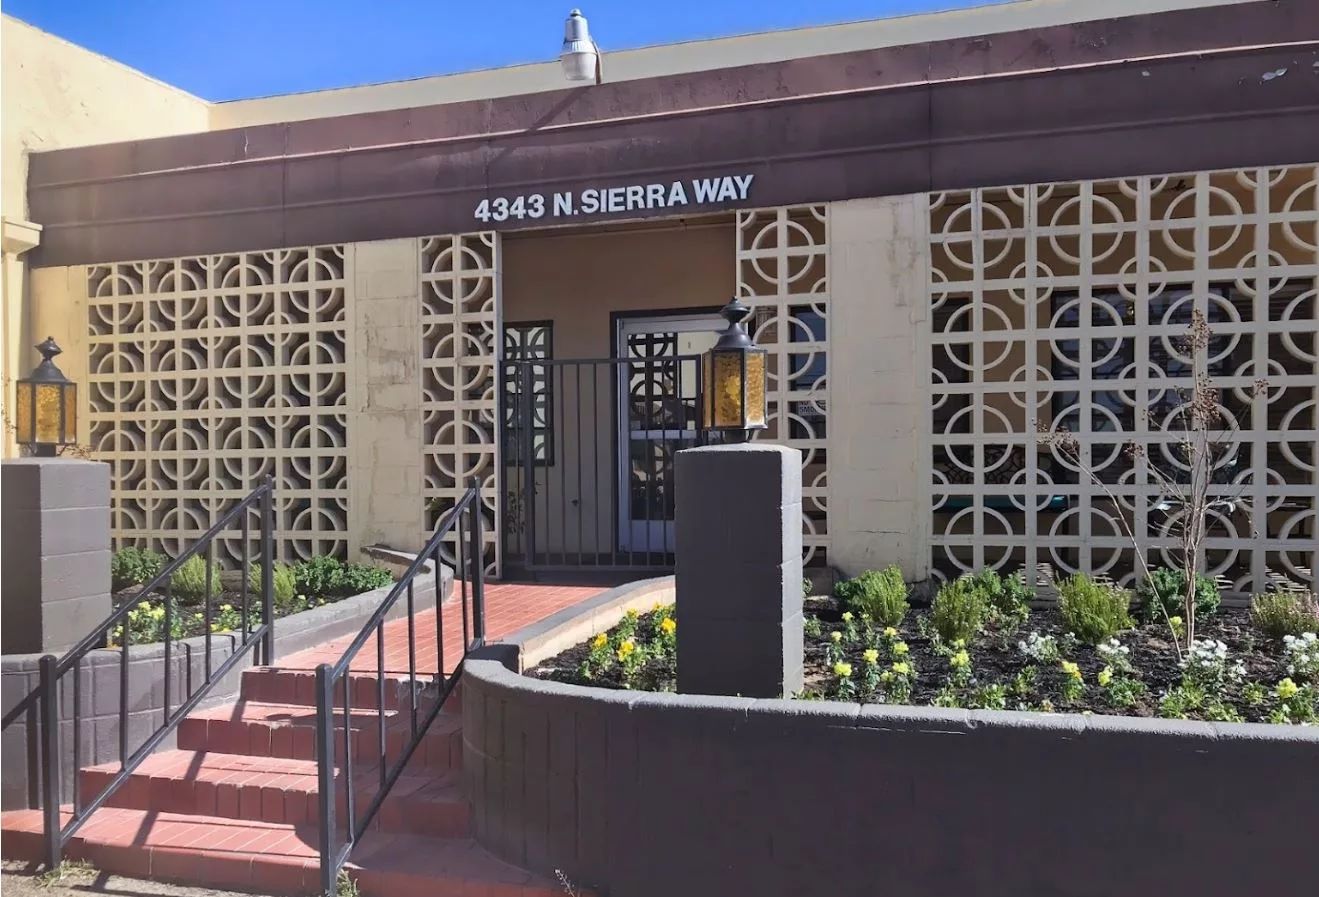
What is the phone number of Arrowhead Healthcare Center?

(909) 886-4731 will put you in contact with the team at Arrowhead Healthcare Center.

Is Arrowhead Healthcare Center Medicare or Medicaid certified?

Yes — Arrowhead Healthcare Center is a CMS-certified provider of Medicare and Medicaid.

Guides for Better Senior Living

Care Cost Calculator: See Prices in Your Area

Nursing Home Data Explorer

Don’t Wait Too Long: 7 Red Flag Signs Your Parent Needs Assisted Living Now

The True Cost of Assisted Living in 2025 – And How Families Are Paying For It

Understanding Senior Living Costs: Pricing Models, Discounts & Financial Assistance

Explore Open Rooms
1 Contact details
2 What type of senior care service are you looking for?
3 What budget do you have in mind for senior care?
4 How soon do you need to find care?
5 Additional details

Thank you for your interest!

Our team will be in touch shortly to help with next steps.