Total health inspections
3
Kentucky average 2.9
Last Health inspection on Dec 2024

We arrange tours, appointments, and even moving support so you don’t have to
Thank you for your interest!
Our team will be in touch shortly to help with next steps.


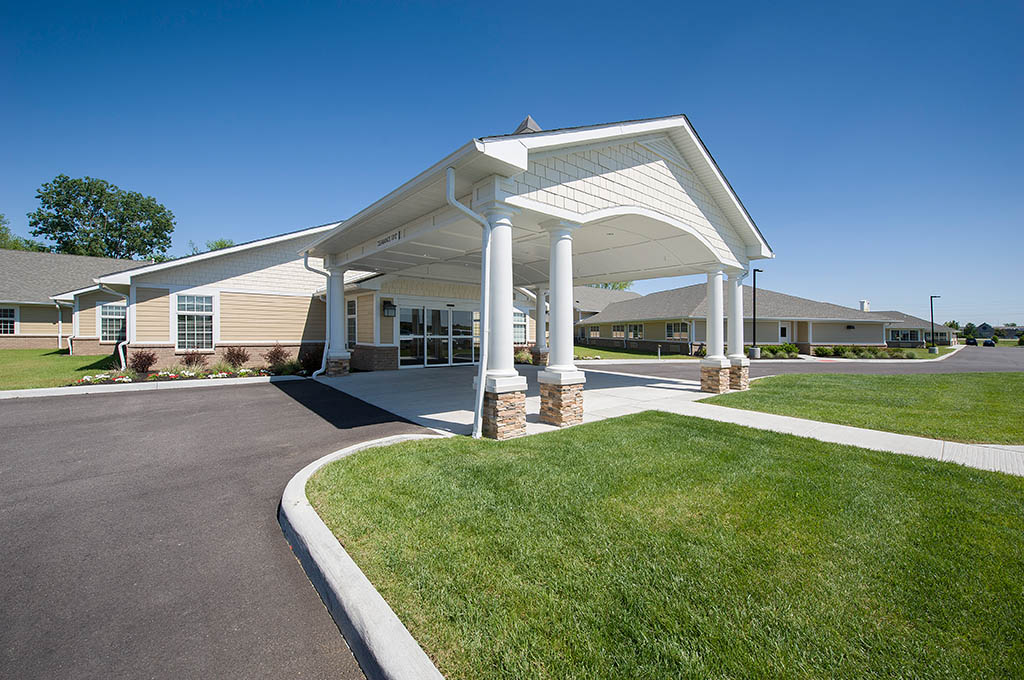
Heartland Villa Center is a captivating skilled care nursing and rehabilitation facility, equipped to accommodate up to 45 clients at a time. Tucked away near the serene Ohio River, just east of Owensboro, Kentucky, this seven-acre campus boasts scenic walking paths, a shaded park, and a play area.
Heartland’s reputation for providing exceptional care and warm hospitality speaks volumes, as they proudly hold the My Innerview Excellence in Action award three times and have received the National Health Care Association’s Bronze Commitment to Quality award. Alongside their skilled services, they extend outpatient rehabilitation services to the local community and offer a 24-unit apartment complex.
May offer a more intimate, personalized care environment.
Occupancy is moderate, suggesting balanced demand.
Most residents typically stay for a few weeks or months before returning home or moving on.
49% of new residents, usually for short-term rehab.
40% of new residents, often for short stays.
11% of new residents, often for long-term daily care.
Pets Allowed: Yes, Pets Allowed
Building Type: Single-story
Fitness and Recreation
Kentucky average 2.9
Last Health inspection on Dec 2024
Kentucky average 13.5
Kentucky average 4.4
Health citations are formal notices following inspections when they fail to comply with safety and care standards.
5 of 6 citations resulted from standard inspections; and 1 of 6 resulted from complaint investigations.
Kentucky average: 1.1
Kentucky average: 0.6
Data sourced from CMS Health Deficiencies reports. Citation severity codes range from A (least serious) to L (most serious). Immediate Jeopardy (J-L) citations indicate situations where the facility's noncompliance has placed residents at risk of death or serious harm.
Nursing Home Licensed facility providing 24/7 skilled nursing care for residents with complex, ongoing medical needs. Staffed by RNs, LPNs, and CNAs. Inspected and star-rated annually by CMS. Accepts Medicare (short-term rehab) and Medicaid (long-term care).
Assisted Living A licensed, long-term care setting for seniors or individuals with disabilities who need help with daily activities — like bathing, dressing, and medication management — but not 24-hour skilled nursing. Offers housing, meals, and around-the-clock support while aiming to maximize resident independence.
Independent Living Lifestyle-focused communities for older adults offering dining, activities, and transportation with minimal personal care. Best for active, independent seniors who want community without medical support.
Memory Care Secured, specialized care for people living with Alzheimer's or dementia. Staff trained in cognitive impairment, with higher staff-to-resident ratios and an environment designed to reduce confusion and wandering risk.
Nursing Home Licensed facility providing 24/7 skilled nursing care for residents with complex, ongoing medical needs. Staffed by RNs, LPNs, and CNAs. Inspected and star-rated annually by CMS. Accepts Medicare (short-term rehab) and Medicaid (long-term care).
Home Care Professional care delivered in the person's own home — from companionship and errands to skilled nursing and therapy. Allows seniors to age in place. Medicare covers skilled home health when medically necessary.
Memory Care Secured, specialized care for people living with Alzheimer's or dementia. Staff trained in cognitive impairment, with higher staff-to-resident ratios and an environment designed to reduce confusion and wandering risk.
Respite Care Short-term temporary care — days to weeks — to give family caregivers a break. Full care provided during the stay. Often used after hospitalization or to trial a facility before a permanent placement decision.
Nursing Home Licensed facility providing 24/7 skilled nursing care for residents with complex, ongoing medical needs. Staffed by RNs, LPNs, and CNAs. Inspected and star-rated annually by CMS. Accepts Medicare (short-term rehab) and Medicaid (long-term care).
Assisted Living A licensed, long-term care setting for seniors or individuals with disabilities who need help with daily activities — like bathing, dressing, and medication management — but not 24-hour skilled nursing. Offers housing, meals, and around-the-clock support while aiming to maximize resident independence.
Home Care Professional care delivered in the person's own home — from companionship and errands to skilled nursing and therapy. Allows seniors to age in place. Medicare covers skilled home health when medically necessary.
Independent Living Lifestyle-focused communities for older adults offering dining, activities, and transportation with minimal personal care. Best for active, independent seniors who want community without medical support.
Independent Living Lifestyle-focused communities for older adults offering dining, activities, and transportation with minimal personal care. Best for active, independent seniors who want community without medical support.
Independent Living Lifestyle-focused communities for older adults offering dining, activities, and transportation with minimal personal care. Best for active, independent seniors who want community without medical support.
![]() 19.1 miles from city center — 7 miles to nearest hospital (DaVita Tell City Dialysis Center)
19.1 miles from city center — 7 miles to nearest hospital (DaVita Tell City Dialysis Center)
![]() 8005 US-60, Lewisport, KY 42351
8005 US-60, Lewisport, KY 42351
Add your location
This data corresponds to Q2 2025 and is based on CMS Payroll-Based Journal.
Kentucky average ratio: 1.75:1
Kentucky average: 8.5 hours
Manages medical care and health needs.
No contractors work on this role.
Assists with medical care and medications.
No contractors work on this role.
Helps with daily care and mobility.
No contractors work on this role.
Total hours from contractors
80 contractor hours this quarter
| Certified Nursing Assistant | 27 | 0 | 27 | 7,936 | 91 | 100% | 9.1 |
| Licensed Practical Nurse | 5 | 0 | 5 | 2,208 | 91 | 100% | 7.8 |
| Medication Aide/Technician | 5 | 0 | 5 | 939 | 87 | 96% | 7.9 |
| RN Director of Nursing | 2 | 0 | 2 | 777 | 80 | 88% | 6.9 |
| Physical Therapy Aide | 3 | 0 | 3 | 680 | 71 | 78% | 6.2 |
| Other Dietary Services Staff | 2 | 0 | 2 | 652 | 75 | 82% | 5.3 |
| Registered Nurse | 6 | 0 | 6 | 614 | 55 | 60% | 6.6 |
| Nurse Practitioner | 1 | 0 | 1 | 512 | 64 | 70% | 8 |
| Administrator | 1 | 0 | 1 | 478 | 63 | 69% | 7.6 |
| Clinical Nurse Specialist | 1 | 0 | 1 | 456 | 57 | 63% | 8 |
| Dental Services Staff | 1 | 0 | 1 | 430 | 61 | 67% | 7 |
| Qualified Social Worker | 4 | 0 | 4 | 369 | 67 | 74% | 5 |
| Speech Language Pathologist | 3 | 0 | 3 | 348 | 65 | 71% | 5.2 |
| Physical Therapy Assistant | 4 | 0 | 4 | 151 | 31 | 34% | 4.9 |
| Respiratory Therapy Technician | 3 | 0 | 3 | 86 | 24 | 26% | 3.2 |
| Occupational Therapy Aide | 0 | 1 | 1 | 43 | 7 | 8% | 6.1 |
| Medical Director | 0 | 2 | 2 | 26 | 12 | 13% | 2 |
| Occupational Therapy Assistant | 0 | 1 | 1 | 11 | 3 | 3% | 3.7 |
Source: CMS Long-Term Care Facility Characteristics (Data as of Jan 2026)
Residents meet regularly to discuss policies, care quality, and activities
Organized group of residents that meets regularly to discuss facility policies, quality of life, and activities.
Data sourced from CMS Long-Term Care Facility Characteristics quarterly report. Payer mix reflects the current resident census by primary payment source.
These measures show how residents usually do over time at this home, based on health outcomes and preventive care.
Kentucky average: 10.5
Kentucky average: 18.9
Kentucky average: 16.8%
Kentucky average: 19.6%
Kentucky average: 20.5%
Kentucky average: 3.8%
Kentucky average: 5.8%
Kentucky average: 1.9%
Kentucky average: 6.8%
Kentucky average: 14.3%
Kentucky average: 15.6%
Kentucky average: 93.9%
Kentucky average: 96.2%
Kentucky average: 83.7%
Kentucky average: 1.9%
Kentucky average: 83.6%
Quality measures are calculated from Minimum Data Set (MDS) assessments. For most measures, lower percentages indicate better care quality.
Federal penalties imposed by CMS for regulatory violations, including civil money penalties (fines) and denials of payment for new Medicare/Medicaid admissions.
Source: CMS Penalties Database (Data as of Jan 2026)
Kentucky average: $63K
Kentucky average: 2.3
Kentucky average: 0.3
Penalties are imposed by CMS for violations of federal nursing home regulations.
Last updated: Jan 2026
Historical financial and operational data for Heartland Villa Center based on CMS SNF Cost Reports.
Loading trend charts...
Care Cost Calculator: See Prices in Your Area
Nursing Home Data Explorer
Don’t Wait Too Long: 7 Red Flag Signs Your Parent Needs Assisted Living Now
The True Cost of Assisted Living in 2025 – And How Families Are Paying For It
Understanding Senior Living Costs: Pricing Models, Discounts & Financial Assistance

Touring a community? Use this expert-backed checklist to stay organized, ask the right questions, and find the perfect fit.
We'll send you a PDF version of the touring checklist.