Heartland Villa Center
CMS overall rating Info CMS (the Centers for Medicare & Medicaid Services) is the federal agency that rates nursing home quality. Its Overall Rating runs from 1 to 5 stars, combining health inspections, staffing, and quality measures, with inspections weighted most heavily.

Heartland Villa Center

CMS overall rating Info CMS (the Centers for Medicare & Medicaid Services) is the federal agency that rates nursing home quality. Its Overall Rating runs from 1 to 5 stars, combining health inspections, staffing, and quality measures, with inspections weighted most heavily.
Calculator: See prices in your area
Heartland Villa Center accepts Medicare, Medicaid, and private pay.

Overview of Heartland Villa Center

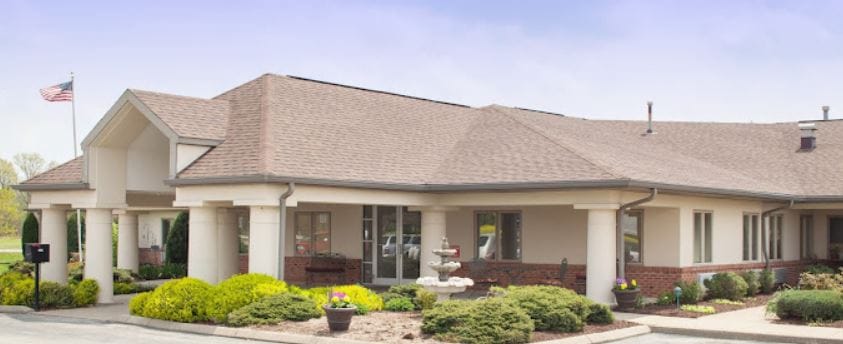
Heartland Villa Center is a captivating skilled care nursing and rehabilitation facility, equipped to accommodate up to 45 clients at a time. Tucked away near the serene Ohio River, just east of Owensboro, Kentucky, this seven-acre campus boasts scenic walking paths, a shaded park, and a play area.

Heartland’s reputation for providing exceptional care and warm hospitality speaks volumes, as they proudly hold the My Innerview Excellence in Action award three times and have received the National Health Care Association’s Bronze Commitment to Quality award. Alongside their skilled services, they extend outpatient rehabilitation services to the local community and offer a 24-unit apartment complex. 

(270) 295-6756

Quality ratings

Measured by Centers for Medicare & Medicaid Services (CMS)

Overall rating Info The Overall CMS Rating combines results from health inspections, staffing levels and quality measures. Health inspections carry the most weight. Staffing and quality scores can increase or decrease the final rating based on performance compared to state and national standards.
▲ 42.1% Above KY avg. ▲ 42.1% Above KY avg.KY average: 2.8Click the badge to see the full State ranking.Click here to see the full State ranking.
Health Inspection Info Based on the results of the facility's three most recent standard inspections and any complaint investigations. CMS reviews the number, scope, and severity of deficiencies, with more recent findings weighted more heavily.
▲ 37.1% Above KY avg. ▲ 37.1% Above KY avg.KY average: 2.9Click the badge to see the full State ranking.Click here to see the full State ranking.
Staffing Info Measures average nursing staff hours per resident per day, including Registered Nurses (RNs) and total nursing staff. Ratings are adjusted based on the level of care residents require and are compared to state and national benchmarks.
▼ 25.1% Below KY avg. ▼ 25.1% Below KY avg.KY average: 2.7Click the badge to see the full State ranking.Click here to see the full State ranking.
Quality Measures Info Based on clinical and physical health indicators reported to CMS, such as hospital readmissions, falls, pressure ulcers, and improvements in mobility. These measures reflect how well residents' health needs are being managed.
▲ 3.6% Above KY avg. ▲ 3.6% Above KY avg.KY average: 2.9Click the badge to see the full State ranking.Click here to see the full State ranking.

Staffing hours breakdown

Info Daily nursing hours per resident by staff type, reported to CMS. Higher is generally better — compare this facility to state and national averages to see where staffing stands.

Hours per resident per day — compared to Kentucky state averages

Total nursing care / resident Info This home is ranked 117th out of 193 homes in Kentucky for nurse hours. Total adjusted nursing hours per resident per day, combining RN, LPN, and aide time. CMS adjusts this for case-mix so facilities can be fairly compared.
3h 12m per day
Rank #117 / 193Nurse hours — State benchmarkedThis home is ranked 117th out of 193 homes in Kentucky. Shows adjusted nurse hours per resident per day benchmarked to the Kentucky average, with a ranking across 193 Kentucky facilities. More hours mean more direct care. The national average is about 3.5 hrs; below 3.0 is a red flag.Rankings are based only on facilities in Kentucky that report data for that category. Facilities without available data are excluded from the ranking.Click the rank badge to see the full State ranking.Click here to see the full State ranking.
This facility Kentucky avg (3h 45m per day)
vs Kentucky avg
-15%

6 of 6 metrics below state avg

Staff typeHours / Day / Residentvs state avg
Registered Nurse (RN) Info RNs hold the highest nursing license and can assess residents, interpret test results, and direct care plans. More RN hours per day often signals stronger clinical oversight and faster response to health changes. 34m per day ▼ 27% State avg: 46m per day · National avg: 41m per day
LPN / LVN Info Licensed Practical Nurses (LPNs) or Licensed Vocational Nurses (LVNs) deliver routine hands-on care — medication administration, wound dressing, and monitoring vital signs. They work under RN supervision and make up a large share of daily bedside care. 34m per day ▼ 30% State avg: 48m per day · National avg: 52m per day
Nurse Aide Info Certified Nurse Aides (CNAs) provide the most direct day-to-day assistance: bathing, dressing, feeding, and mobility. Nurse aide hours are typically the largest staffing category and directly affect residents' quality of life. 2h 6m per day ▼ 13% State avg: 2h 24m per day · National avg: 2h 20m per day
Weekend Total Nursing Info Combined nursing hours (RN + LPN + Nurse Aide) per resident per day on weekends. Staffing often drops on weekends — this figure reveals whether the facility maintains adequate coverage outside of weekday hours. 2h 43m per day ▼ 23% State avg: 3h 32m per day · National avg: 3h 27m per day
Physical Therapist Info Hours per resident per day provided by licensed Physical Therapists (PTs) or PT Assistants. PT services help residents recover mobility after injury or illness and are especially important for post-acute (short-stay) rehabilitation. 2m per day ▼ 40% State avg: 4m per day · National avg: 4m per day
Weekend RN Info Registered nurse hours specifically on weekends. Facilities sometimes reduce RN presence on Saturdays and Sundays — a low weekend RN figure compared to weekday hours can indicate reduced clinical oversight when most administrative staff are absent. 24m per day ▼ 21% State avg: 31m per day · National avg: 29m per day

Capacity and availability

This home usually has limited availability

Higher occupancy than the Kentucky average: 81.3%
Occupancy rate
90.9% Rank #64 / 209Occupancy rate — State benchmarkedThis home is ranked 64th out of 209 homes in Kentucky. Shows this facility's occupancy rate versus the Kentucky average, with its Statewide rank out of 209. Higher occupancy signals strong local demand and financial stability.Rankings are based only on facilities in Kentucky that report data for that category. Facilities without available data are excluded from the ranking.Click the rank badge to see the full State ranking.Click here to see the full State ranking.
Avg. Length of Stay
178 days
Bed community size
45-bed community Rank #269 / 341Bed count — State benchmarkedThis home is ranked 269th out of 341 homes in Kentucky. Shows this facility's certified or reported bed count compared to other Kentucky facilities. Larger communities may offer more amenities, programs, and on-site services for residents and families.Rankings are based only on facilities in Kentucky that report data for that category. Facilities without available data are excluded from the ranking.Click the rank badge to see the full State ranking.Click here to see the full State ranking.
A moderately sized community that may balance personal attention with shared amenities and social activities.
Walk Score
Walk Score: 29 / 100 Rank #289 / 423Walk Score — State benchmarkedThis home is ranked 289th out of 423 homes in Kentucky. Shows how walkable this facility's neighborhood is compared to the average Walk Score across Kentucky facilities. Higher scores benefit residents, families, and staff.Rankings are based only on facilities in Kentucky that report data for that category. Facilities without available data are excluded from the ranking.Click the rank badge to see the full State ranking.Click here to see the full State ranking.
Somewhat walkable. A few nearby services may be reachable on foot, but most trips require transportation.

Contact Heartland Villa Center

Staffing Data

Reporting period: October 1 – December 31, 2025 (Q4 2025). Source: CMS Payroll-Based Journal report.

Total staff 89
Employees 80
Contractors 9
Staff to resident ratio 2.02 : 1
18% more staff per resident than Kentucky average
Kentucky average ratio: 1.72 : 1 Kentucky average ratio: 1.72 : 1See full Kentucky ranking
Avg staff/day 23
Average shift 7.4 hours
13% worse than Kentucky average
Kentucky average: 8.5 hours Kentucky average shift: 8.5 hoursSee full Kentucky ranking
Total staff hours (quarter) 15,724

Nursing staff breakdown

Q4 2025 · Oct 1 – Dec 31 More info This data comes from the CMS Payroll-Based Journal report covering October 1 – December 31, 2025.
Registered Nurse

Manages medical care and health needs.

RN Staff Info 12 total: 11 full-time employees and 1 contractor. 12
Average shift length Info Average shift length. Calculated as total hours divided by days worked and average staff per day. 6.4 hours
Licensed Practical Nurse

Assists with medical care and medications.

LPN Staff Info 9 total: 7 full-time employees and 2 contractors. 9
Average shift length Info Average shift length. Calculated as total hours divided by days worked and average staff per day. 7.9 hours
Certified Nursing Assistant

Helps with daily care and mobility.

CNA Staff Info All 32 CNA Staff are full-time employees. No contractors work on this role. 32
Average shift length Info Average shift length. Calculated as total hours divided by days worked and average staff per day. 9 hours

Contractor staffing

Q4 2025 · Oct 1 – Dec 31 More info This data comes from the CMS Payroll-Based Journal report covering October 1 – December 31, 2025.

Total hours from contractors

2.8%

441 contractor hours this quarter

Occupational Therapy Assistant: 3 Licensed Practical Nurse: 2 Medical Director: 2 Registered Nurse: 1 Occupational Therapy Aide: 1

Staff by category

Q4 2025 · Oct 1 – Dec 31 More info This data comes from the CMS Payroll-Based Journal report covering October 1 – December 31, 2025.
Certified Nursing Assistant320327,08092100%9
Licensed Practical Nurse7291,6169199%7.9
Registered Nurse111121,2789199%6.4
Medication Aide/Technician60698592100%7.9
Other Dietary Services Staff3037177784%5.5
Physical Therapy Aide3035886773%6.3
RN Director of Nursing2025606065%6.4
Administrator1014725964%8
Clinical Nurse Specialist1014485661%8
Dental Services Staff1014476368%7.1
Nurse Practitioner1014215358%7.9
Speech Language Pathologist3033906672%5.7
Qualified Social Worker2023897177%5.1
Respiratory Therapy Technician3031483639%4
Physical Therapy Assistant4041353942%3.5
Medical Director022281314%2.2
Occupational Therapy Assistant033161921%0.8
Occupational Therapy Aide011822%4
32 Certified Nursing Assistant
% of Days 100%
9 Licensed Practical Nurse
% of Days 99%
12 Registered Nurse
% of Days 99%
6 Medication Aide/Technician
% of Days 100%
3 Other Dietary Services Staff
% of Days 84%
3 Physical Therapy Aide
% of Days 73%
2 RN Director of Nursing
% of Days 65%
1 Administrator
% of Days 64%
1 Clinical Nurse Specialist
% of Days 61%
1 Dental Services Staff
% of Days 68%
1 Nurse Practitioner
% of Days 58%
3 Speech Language Pathologist
% of Days 72%
2 Qualified Social Worker
% of Days 77%
3 Respiratory Therapy Technician
% of Days 39%
4 Physical Therapy Assistant
% of Days 42%
2 Medical Director
% of Days 14%
3 Occupational Therapy Assistant
% of Days 21%
1 Occupational Therapy Aide
% of Days 2%

Penalties and fines

Includes penalties issued in 2024

Federal penalties imposed by CMS for regulatory violations, including civil money penalties (fines) and denials of payment for new Medicare/Medicaid admissions.

Source: CMS Penalties Database (Data as of Jan 2026)

Total fines amount $9K Rank #145 / 199Federal fines — State benchmarkedThis home is ranked 145th out of 199 homes in Kentucky. Shows this facility's cumulative CMS federal fine dollars versus the Kentucky average among facilities with fines, and where it ranks among 199 facilities in the pool. Lower total dollars mean a better rank.Rankings are based only on facilities in Kentucky that report data for that category. Facilities without available data are excluded from the ranking.Click the rank badge to see the full State ranking.Click here to see the full State ranking.
86% lower than Kentucky average

Kentucky average: $63K

Number of fines 1
57% fewer fines than Kentucky average

Kentucky average: 2.3

Payment Denials Info Serious action where Medicare and/or Medicaid temporarily stops payments for new residents until issues are fixed. 0
100% fewer payment denials than Kentucky average

Kentucky average: 0.3

Fines amount comparison
This facility $9K
Kentucky average $63K
Penalty History

Penalties are imposed by CMS for violations of federal nursing home regulations.

1 penalty in the past 3 years

Dec 16, 2024 · $9K

Civil Money Penalty Info Fines imposed for noncompliance, which can be assessed per day or per instance of violation. Dec 16, 2024
$9K

Last updated: Jan 2026

Quality of care over time

These measures show how residents usually do over time at this home, based on health outcomes and preventive care.

High-risk clinical events score Info A composite score based on pressure ulcers, falls with injury, weight loss, walking ability decline, and activities of daily living decline. 11.1
6% worse than Kentucky average

Kentucky average: 10.5

Functional decline score Info A composite score based on activities of daily living decline, walking ability decline, and incontinence. 26.0
37% worse than Kentucky average

Kentucky average: 18.9

Long-stay resident measures
Need for Help with Daily Activities Increased Info Percent of long-stay residents whose need for help with daily activities has increased 18.4%
10% worse than Kentucky average

Kentucky average: 16.8%

Walking Ability Worsened Info Percent of long-stay residents whose ability to move independently worsened 24.4%
24% worse than Kentucky average

Kentucky average: 19.6%

Low Risk Residents with Bowel/Bladder Incontinence Info Percent of low risk long-stay residents who lose control of their bowels or bladder 35.1%
71% worse than Kentucky average

Kentucky average: 20.5%

Falls with Major Injury Info Percent of long-stay residents experiencing one or more falls with major injury 1.3%
65% better than Kentucky average

Kentucky average: 3.8%

High Risk Residents with Pressure Ulcers Info Percent of long-stay high risk residents with pressure ulcers 3.6%
37% better than Kentucky average

Kentucky average: 5.8%

Urinary Tract Infection Info Percent of long-stay residents with a urinary tract infection 0.7%
64% better than Kentucky average

Kentucky average: 1.9%

Lost Too Much Weight Info Percent of long-stay residents who lose too much weight 7.9%
17% worse than Kentucky average

Kentucky average: 6.8%

Depressive Symptoms Info Percent of long-stay residents who have depressive symptoms 42.6%
198% worse than Kentucky average

Kentucky average: 14.3%

Antipsychotic Use Info Percent of long-stay residents who received an antipsychotic medication 6.1%
61% better than Kentucky average

Kentucky average: 15.6%

Pneumococcal Vaccine Info Percent of long-stay residents assessed and appropriately given the pneumococcal vaccine 99.4%
6% better than Kentucky average

Kentucky average: 93.9%

Influenza Vaccine Info Percent of long-stay residents assessed and appropriately given the seasonal influenza vaccine 97.6%
In line with Kentucky average

Kentucky average: 96.2%

Short-stay resident measures
Pneumococcal Vaccine Info Percent of short-stay residents assessed and appropriately given the pneumococcal vaccine 99.1%
18% better than Kentucky average

Kentucky average: 83.7%

Antipsychotic medication increase Info Percent of short-stay residents who newly received an antipsychotic medication 2.8%
46% worse than Kentucky average

Kentucky average: 1.9%

Influenza Vaccine Info Percent of short-stay residents assessed and appropriately given the seasonal influenza vaccine 83.9%
In line with Kentucky average

Kentucky average: 83.6%

Breakdown by payment type

Medicare

49% of new residents, usually for short-term rehab.

Typical stay 2 months

Private pay

40% of new residents, often for short stays.

Typical stay 1 - 2 months

Medicaid

11% of new residents, often for long-term daily care.

Typical stay 3 - 4 years

Facility Characteristics

Source: CMS Long-Term Care Facility Characteristics (Data as of Jan 2026)

Total residents 44
Medicare
5
11.4% of residents
Medicaid
29
65.9% of residents
Private pay or other
10
22.7% of residents
Programs & Services
Residents Group

Residents meet regularly to discuss policies, care quality, and activities

Active Resident Council

Organized group of residents that meets regularly to discuss facility policies, quality of life, and activities.

Finances and operations

Based on CMS SNF Cost Report for fiscal year ending in 12/2023.

Privately-owned community
Operated by a single business entity.
Net patient revenue Info Net patient revenue — what the home actually collects for resident care, after contractual allowances, bad debt and discounts are subtracted from its gross charges (CMS cost report, Worksheet G-3). It covers resident care only; money the home earns from other sources is shown separately as "Other income."
$5.3M
Net patient income Info Net patient income: net patient revenue minus the home's total operating expenses. A positive figure means it earns more from resident care than it spends to deliver it; a negative figure means the opposite. It excludes non-operating "other income."
$368.8K
Privately-owned community Operated by a single business entity.
Net patient revenue Info Net patient revenue — what the home actually collects for resident care, after contractual allowances, bad debt and discounts are subtracted from its gross charges (CMS cost report, Worksheet G-3). It covers resident care only; money the home earns from other sources is shown separately as "Other income."
$5.3M Rank #165 / 197Revenue — State benchmarkedThis home is ranked 165th out of 197 homes in Kentucky. Shows this facility's annual revenue compared to the Kentucky average. Higher revenue generally means more resources for staffing and capital — read alongside Payroll %.Rankings are based only on facilities in Kentucky that report data for that category. Facilities without available data are excluded from the ranking.Click the rank badge to see the full State ranking.Click here to see the full State ranking.
Net patient income Info Net patient income: net patient revenue minus the home's total operating expenses. A positive figure means it earns more from resident care than it spends to deliver it; a negative figure means the opposite. It excludes non-operating "other income."
$368.8K
Other income Info Money the home earns outside of resident care — such as investments, grants, rentals and other non-operating sources (CMS cost report, Worksheet G-3). It is tracked separately from net patient revenue: it is not part of that figure, and it is not included in net patient income.
$3.9K
Payroll costs Info Staff salaries plus wage-related costs — benefits such as payroll taxes, health insurance and retirement — from the home's own accounting records (CMS cost report, Worksheet A). Contract or agency labor is counted separately, under other operating costs. Rank #168 / 197Payroll — State benchmarkedThis home is ranked 168th out of 197 homes in Kentucky. Shows total annual staff payroll benchmarked to the Kentucky average. Higher payroll investment relative to peers often signals better staffing and less reliance on cheaper contract labor.Rankings are based only on facilities in Kentucky that report data for that category. Facilities without available data are excluded from the ranking.Click the rank badge to see the full State ranking.Click here to see the full State ranking.
$2.1M 39.9% of net patient revenue Info Payroll as a share of revenue: staff salaries and wage-related benefits divided by net patient revenue. A higher figure means more of each revenue dollar goes to staff pay. Rank #109 / 197Payroll % — State benchmarkedThis home is ranked 109th out of 197 homes in Kentucky. Shows payroll as a percentage of revenue versus the Kentucky average. Well-run Kentucky facilities typically land around 51–61% — the top third Statewide. Below 25% may signal understaffing or heavy agency use — read with Staffing ratings.Rankings are based only on facilities in Kentucky that report data for that category. Facilities without available data are excluded from the ranking.Click the rank badge to see the full State ranking.Click here to see the full State ranking.
Other operating costs Info Everything it costs to run the home apart from payroll — food, utilities, supplies, maintenance, contract labor and administration. Calculated as total operating expense minus payroll (staff salaries and wage-related benefits).
$2.8M
Total costs Info The home's total operating expense for the year — all the costs of running it, salaries included (CMS cost report, Worksheet G-3).
$4.9M

What does this home offer?

Pets allowed icon
Pets allowed icon

Pets Allowed

Building type icon
Building type icon

Building Type: Single-story

Fitness and recreation icon

Fitness and Recreation

Who this home usually serves

TYPE OF STAY

Mostly short-term rehab stays

Most residents typically stay for a few weeks or months before returning home or moving on.

New residents most often arrive under Medicare (49% of admissions), and a typical Medicare stay runs around 2 months.

Admissions
80 total

Coverage residents most often arrive under.

Medicare 49%
Private pay 40%
Medicaid 11%
Discharges
84 total

Coverage residents most often leave under.

Medicare 43%
Private pay 30%
Medicaid 27%

Places of interest near Heartland Villa Center

Address 19.1 miles from city center Info Estimated distance in miles from Lewisport's city center to Heartland Villa Center's address, calculated via Google Maps. — 13.92 miles to nearest hospital (Owensboro Health Regional Hospital)

Calculate Travel Distance to Heartland Villa Center

Add your location

Address

Compare Nursing Homes around Owensboro

The information below is reported by the Kentucky Cabinet for Health and Family Services, Office of Inspector General.

5 facilities compared · CMS & KY Dept. of Health data

Hermitage Care & Rehabilitation Center
NH
NC
Owensboro
92
Facility 92
KY AVG 82
Rank #128 / 341
88.0%
Facility 88.0%
KY AVG 81.3%
Rank #89 / 209
+8%
4.18
Facility 4.18
KY AVG 3.75
Rank #26 / 193
+14%+12%
$0
Facility $0
KY AVG $65.4k
Rank #1 / 199
4
Facility 4
KY AVG 13.5
Rank #11 / 195
2.0
Facility 2.0
KY AVG 4.4
Rank #17 / 195
-88A+
49
Facility 49
KY AVG 41
Rank #170 / 423
Matthew Clark
$11.2M
Facility $11.2M
KY AVG $10.5M
Rank #51 / 197
$4.4M
Facility $4.4M
KY AVG $4.0M
Rank #87 / 197
39.3%
Facility 39.3%
KY AVG 40.7%
Rank #176 / 197
185346
Twin Rivers Nursing And Rehab Center
NH
HC
NC
PC
RC
Owensboro
132
Facility 132
KY AVG 82
Rank #36 / 341
72.7%
Facility 72.7%
KY AVG 81.3%
Rank #171 / 209
-11%
3.39
Facility 3.39
KY AVG 3.75
Rank #77 / 193
-6%-10%
$0
Facility $0
KY AVG $65.4k
Rank #1 / 199
18
Facility 18
KY AVG 13.5
Rank #143 / 195
9.0
Facility 9.0
KY AVG 4.4
Rank #187 / 195
-93A+
52
Facility 52
KY AVG 41
Rank #147 / 423
Myra Raymer
$9.7M
Facility $9.7M
KY AVG $10.5M
Rank #124 / 197
$5.5M
Facility $5.5M
KY AVG $4.0M
Rank #50 / 197
57.2%
Facility 57.2%
KY AVG 40.7%
Rank #6 / 197
185087
Signature Healthcare at Hillcrest
NH
MC
RC
Owensboro
156
Facility 156
KY AVG 82
Rank #17 / 341
81.4%
Facility 81.4%
KY AVG 81.3%
Rank #136 / 209
0%
3.57
Facility 3.57
KY AVG 3.75
Rank #55 / 193
+47%-5%
$0
Facility $0
KY AVG $65.4k
Rank #1 / 199
7
Facility 7
KY AVG 13.5
Rank #38 / 195
3.5
Facility 3.5
KY AVG 4.4
Rank #78 / 195
-128-
1
Facility 1
KY AVG 41
Rank #404 / 423
William Conley
$15.0M
Facility $15.0M
KY AVG $10.5M
Rank #12 / 197
$5.7M
Facility $5.7M
KY AVG $4.0M
Rank #38 / 197
38.1%
Facility 38.1%
KY AVG 40.7%
Rank #173 / 197
185120
Heartland Villa Center
NH
Lewisport
45
Facility 45
KY AVG 82
Rank #269 / 341
90.9%
Facility 90.9%
KY AVG 81.3%
Rank #64 / 209
+12%
3.20
Facility 3.20
KY AVG 3.75
Rank #117 / 193
+25%-15%
$8.8k
Facility $8.8k
KY AVG $65.4k
Rank #145 / 199
6
Facility 6
KY AVG 13.5
Rank #29 / 195
2.0
Facility 2.0
KY AVG 4.4
Rank #17 / 195
142-
29
Facility 29
KY AVG 41
Rank #289 / 423
-
$5.3M
Facility $5.3M
KY AVG $10.5M
Rank #165 / 197
$2.1M
Facility $2.1M
KY AVG $4.0M
Rank #168 / 197
39.9%
Facility 39.9%
KY AVG 40.7%
Rank #109 / 197
185399
Woodmont Health Campus
NH
ADC
AL
MC
RC
Boonville99 54.5% -22%3.06 -36%-11%$0202.9-53A+ 19 Robyn Meador$9.1M$4.6M50.6%155682

Financial Assistance for
Nursing Home in Kentucky

Heartland Villa Center is located in Lewisport, Kentucky.
Here are the financial assistance programs available to residents in Kentucky.

Get Financial aid guidance

Home and Community Based Waiver

Kentucky Medicaid HCB Waiver

Age 65+ or disabled
General Kentucky resident, Medicaid-eligible, nursing home-level care need.
Income Limits (2025) ~$2,829/month 300% FBR, individual
Asset Limits $2,000 (individual), $3,000 (couple).
KY

Rural focus; waitlists possible.

Benefits
Personal care (5-7 hours/day) Respite (240 hours/year) Homemaker services Home modifications

Hart-Supported Living Program

KY Hart-Supported Living

Age 65+ or disabled
General Kentucky resident.
Income Limits No strict limit; prioritizes low-income.
Asset Limits Not applicable.
KY

Competitive grants; limited availability.

Benefits
In-home support (up to 10 hours/week) Respite (varies) Adaptive equipment (~$500 avg.)

Kentucky Homecare Program

Kentucky Homecare Program

Age 60+
General Kentucky resident, at risk of nursing home placement, not eligible for Medicaid waivers.
Income Limits (2025) No strict limit; prioritizes low-income ~$24,980/year individual
Asset Limits Not assessed; need-based focus.
KY

15 AAAs; rural focus; not in nursing homes.

Benefits
Personal care (4-6 hours/day) Respite (5 days/year) Chore services Meal delivery ($7/meal) Minor home repairs

Medicare Savings Program (MSP)

Kentucky Medicare Savings Program

Age 65+ or disabled
General Kentucky resident, Medicare Part A/B.
Income Limits (2025) ~$2,510/month (QMB), ~$3,380/month (SLMB), ~$3,598/month (QI)—individual.
Asset Limits $9,430 (individual), $14,130 (couple).
KY

Three tiers; no waitlist; auto Extra Help for Part D.

Benefits
Covers Part B premiums ($174.70/month) Deductibles ($240/year) Copays (~20%)

National Family Caregiver Support Program (NFCSP) Respite

Kentucky NFCSP Respite Care

Age
General Caregivers of 60+ needing care or 55+ caregivers of others; Kentucky resident; functional needs (2+ ADLs).
Income Limits (2025) Prioritizes ~$24,980/year (individual); no strict cap.
Asset Limits Not assessed; need-based.
KY

15 AAAs; prioritizes low-income, rural caregivers.

Benefits
Respite (4-6 hours/week or 5 days/year) Adult day care ($55/day) Caregiver training Supplies (~$500/year)

Kentucky Family Caregiver Program

Kentucky Family Caregiver Program

Age
General Grandparents (often 55+) as primary caregivers to grandchildren under 18, Kentucky resident, not on Kinship Care.
Income Limits (2025) ~$31,225/year (individual); varies by AAA.
Asset Limits Not strictly assessed; need-based.
KY

Max $1,500/year; statewide via AAAs.

Benefits
Grants (~$500-$1,500/year) for respite Supplies Care costs; counseling Training

VA Aid and Attendance (A&A) and Housebound Benefits

Kentucky VA Aid and Attendance/Housebound

Age 65+ or disabled veteran/spouse
General Kentucky resident, wartime service, need for ADL help (A&A) or homebound.
Income Limits (2025) Net income < ~$1,984/month (veteran with dependent, A&A); pension offsets income.
Asset Limits ~$155,356 net worth limit
KY

High veteran demand in rural areas.

Benefits
Cash (~$1,433-$2,642/month veteran, ~$951-$1,318 spouse) for care costs (e.g., in-home, assisted living)

Frequently Asked Questions about Heartland Villa Center

What neighborhood is Heartland Villa Center in?

Heartland Villa Center is in the Lewisport neighborhood.

Is Heartland Villa Center in a walkable area?

Heartland Villa Center has a walk score of 29. Somewhat walkable. A few nearby services may be reachable on foot, but most trips require transportation.

What is the occupancy rate at Heartland Villa Center?

Heartland Villa Center's occupancy is 90.9%.

Are there photos of Heartland Villa Center?

Yes — there are 4 photos of Heartland Villa Center in the photo gallery on this page.

What is the address of Heartland Villa Center?

Heartland Villa Center is located at 8005 Us-60, Lewisport, KY 42351.

What is the phone number of Heartland Villa Center?

(270) 295-6756 will put you in contact with the team at Heartland Villa Center.

Is Heartland Villa Center Medicare or Medicaid certified?

Yes — Heartland Villa Center is a CMS-certified provider of Medicare and Medicaid.

Guides for Better Senior Living

Care Cost Calculator: See Prices in Your Area

Nursing Home Data Explorer

Don’t Wait Too Long: 7 Red Flag Signs Your Parent Needs Assisted Living Now

The True Cost of Assisted Living in 2025 – And How Families Are Paying For It

Understanding Senior Living Costs: Pricing Models, Discounts & Financial Assistance