Henry County Health and Rehabilitation
Nursing Home · Paris, TN
CMS overall rating Info The Overall CMS Rating is scored from 1 to 5 stars and combines results from health inspections, staffing levels, and quality measures. Health inspections carry the most weight. Staffing and quality scores can increase or decrease the final rating based on performance compared to state and national standards.

Henry County Health and Rehabilitation

Nursing Home · Paris, TN
CMS overall rating Info The Overall CMS Rating is scored from 1 to 5 stars and combines results from health inspections, staffing levels, and quality measures. Health inspections carry the most weight. Staffing and quality scores can increase or decrease the final rating based on performance compared to state and national standards.
Calculator: See prices in your area
Henry County Health and Rehabilitation accepts Medicare, Medicaid, and private pay.

Overview of Henry County Health and Rehabilitation

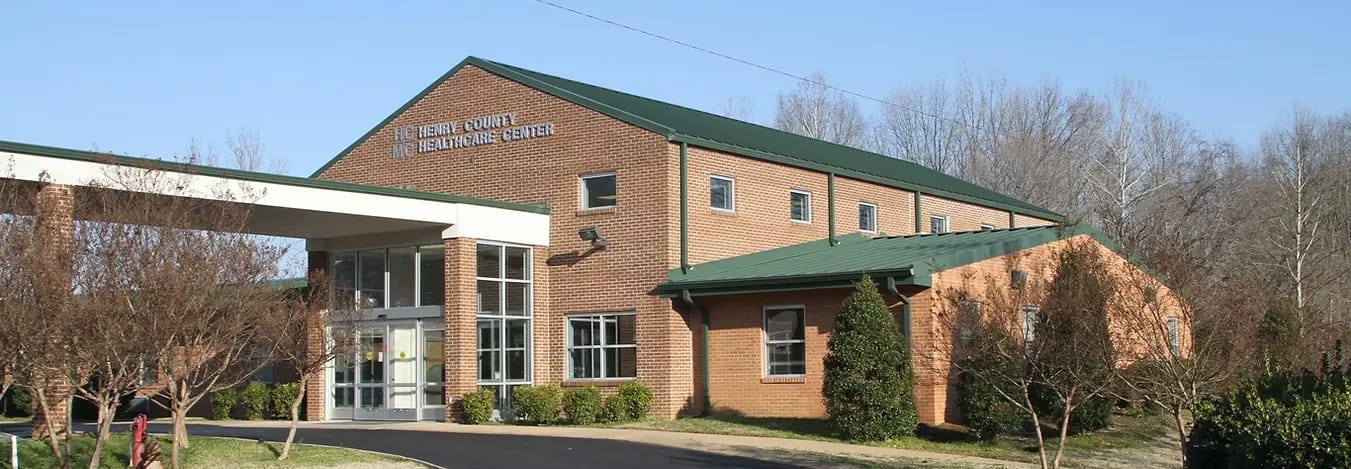
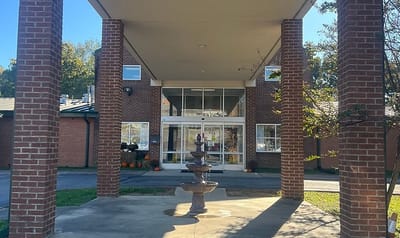
Henry County Health and Rehabilitation is a highly recognized nursing home in Paris, TN, offering a wide range of nursing services and rehabilitation. The community strives to keep older adults comfortable and safe in its warm and nurturing environment. Residents also experience a worry-free lifestyle, as exceptional services, including well-balanced meals, therapeutic programs, and 24-hour care, are provided. Alongside a wide range of specialized care, personalized care plans are also provided to help residents recover and live comfortably.

Cooking classes, holiday events, and outings are just some of the activities that residents can participate in to continue learning and make friends. Well-lit hallways, top-notch rehabilitation equipment, and cozy common areas also ensure residents can rest and focus on their well-being. West Tennessee Healthcare Henry County Hospital is also located nearby, ensuring quick access to medical needs. This nursing home continuously provides exceptional services for older adults’ welfare, making it a great choice for senior living in Tennessee.

(731) 642-5700

Quality ratings

Measured by Centers for Medicare & Medicaid Services (CMS)

Overall rating Info The Overall CMS Rating combines results from health inspections, staffing levels and quality measures. Health inspections carry the most weight. Staffing and quality scores can increase or decrease the final rating based on performance compared to state and national standards.
▲ 41.2% Above TN avg. ▲ 41.2% Above TN avg.Click the badge to see the full State ranking.Click here to see the full State ranking.
Health Inspection Info Based on the results of the facility's three most recent standard inspections and any complaint investigations. CMS reviews the number, scope, and severity of deficiencies, with more recent findings weighted more heavily.
▲ 43.6% Above TN avg. ▲ 43.6% Above TN avg.Click the badge to see the full State ranking.Click here to see the full State ranking.
Staffing Info Measures average nursing staff hours per resident per day, including Registered Nurses (RNs) and total nursing staff. Ratings are adjusted based on the level of care residents require and are compared to state and national benchmarks.
▼ 17.2% Below TN avg. ▼ 17.2% Below TN avg.Click the badge to see the full State ranking.Click here to see the full State ranking.
Quality Measures Info Based on clinical and physical health indicators reported to CMS, such as hospital readmissions, falls, pressure ulcers, and improvements in mobility. These measures reflect how well residents' health needs are being managed.
▲ 16.3% Above TN avg. ▲ 16.3% Above TN avg.Click the badge to see the full State ranking.Click here to see the full State ranking.

Staffing hours breakdown

Info Daily nursing hours per resident by staff type, reported to CMS. Higher is generally better — compare this facility to state and national averages to see where staffing stands.

Hours per resident per day — compared to Tennessee state averages

Total nursing care / resident Info This home is ranked 29th out of 137 homes in Tennessee. Total adjusted nursing hours per resident per day, combining RN, LPN, and aide time. CMS adjusts this for case-mix so facilities can be fairly compared.
3h 53m per day
Rank #29 / 137Nurse hours — State benchmarkedThis home is ranked 29th out of 137 homes in Tennessee. Shows adjusted nurse hours per resident per day benchmarked to the Tennessee average, with a ranking across 137 Tennessee SNFs. More hours mean more direct care. The national average is about 3.5 hrs; below 3.0 is a red flag.Click the rank badge to see the full State ranking.Click here to see the full State ranking.
This facility Tennessee avg (3h 38m per day)
vs Tennessee avg
+7%

3 of 6 metrics below state avg

Standout metric LPN / LVN is +47% above state avg
Staff typeHours / Day / Residentvs state avg
Registered Nurse (RN) Info RNs hold the highest nursing license and can assess residents, interpret test results, and direct care plans. More RN hours per day often signals stronger clinical oversight and faster response to health changes. 27m per day ▼ 27% State avg: 37m per day · National avg: 41m per day
LPN / LVN Info Licensed Practical Nurses (LPNs) or Licensed Vocational Nurses (LVNs) deliver routine hands-on care — medication administration, wound dressing, and monitoring vital signs. They work under RN supervision and make up a large share of daily bedside care. 1h 37m per day ▲ 47% State avg: 1h 6m per day · National avg: 52m per day
Nurse Aide Info Certified Nurse Aides (CNAs) provide the most direct day-to-day assistance: bathing, dressing, feeding, and mobility. Nurse aide hours are typically the largest staffing category and directly affect residents' quality of life. 2h 36m per day ▲ 21% State avg: 2h 9m per day · National avg: 2h 21m per day
Total Nursing (Weekend) Info Combined nursing hours (RN + LPN + Nurse Aide) per resident per day on weekends. Staffing often drops on weekends — this figure reveals whether the facility maintains adequate coverage outside of weekday hours. 3h 59m per day ▲ 19% State avg: 3h 21m per day · National avg: 3h 26m per day
Physical Therapist Info Hours per resident per day provided by licensed Physical Therapists (PTs) or PT Assistants. PT services help residents recover mobility after injury or illness and are especially important for post-acute (short-stay) rehabilitation. 2m per day ▼ 60% State avg: 5m per day · National avg: 4m per day
RN (Weekend) Info Registered nurse hours specifically on weekends. Facilities sometimes reduce RN presence on Saturdays and Sundays — a low weekend RN figure compared to weekday hours can indicate reduced clinical oversight when most administrative staff are absent. 15m per day ▼ 40% State avg: 25m per day · National avg: 29m per day

Types of Care at Henry County Health and Rehabilitation

Nursing Home

Capacity and availability

This home usually has availability

Occupancy lower than 85% suggests more openings may be available.

Lower occupancy than the Tennessee average: 73%
Occupancy rate 45.1% Rank #133 / 141Occupancy rate — State benchmarkedThis home is ranked 133rd out of 141 homes in Tennessee. Shows this facility's occupancy rate versus the Tennessee average, with its Statewide rank out of 141. Higher occupancy signals strong local demand and financial stability.Click the rank badge to see the full State ranking.Click here to see the full State ranking.
Avg. Length of Stay 90 days
Occupancy rate
45.1% Rank #133 / 141Occupancy rate — State benchmarkedThis home is ranked 133rd out of 141 homes in Tennessee. Shows this facility's occupancy rate versus the Tennessee average, with its Statewide rank out of 141. Higher occupancy signals strong local demand and financial stability.Click the rank badge to see the full State ranking.Click here to see the full State ranking.
Avg. Length of Stay
90 days
Walk Score
Walk Score: 43 / 100 Rank #61 / 135Walk Score — State benchmarkedThis home is ranked 61st out of 135 homes in Tennessee. Shows how walkable this facility's neighborhood is compared to the average Walk Score across Tennessee SNFs. Higher scores benefit residents, families, and staff.Click the rank badge to see the full State ranking.Click here to see the full State ranking.
Somewhat walkable. A few nearby services may be reachable on foot, but most trips require transportation.

Contact Henry County Health and Rehabilitation

Staffing Data

Reporting period: April 1 – June 30, 2025 (Q2 2025). Source: CMS Payroll-Based Journal report.

Total staff 173
Employees 122
Contractors 51
Staff to resident ratio 1.78:1
0% compared with Tennessee average
Tennessee average ratio: 1.79:1 Tennessee average ratio: 1.79:1See full Tennessee ranking
Avg staff/day 50
Average shift 8.9 hours
7% better than Tennessee average
Tennessee average: 8.3 hours Tennessee average shift: 8.3 hoursSee full Tennessee ranking
Total staff hours (quarter) 40,414

Nursing staff breakdown

Q2 2025 · Apr 1 – Jun 30 More info This data comes from the CMS Payroll-Based Journal report covering April 1 – June 30, 2025.
Registered Nurse

Manages medical care and health needs.

Total count 8
Average shift length Info Average shift length. Calculated as total hours divided by days worked and average staff per day. 9.4 hours

No contractors work on this role.

Licensed Practical Nurse

Assists with medical care and medications.

Total count 54
Average shift length Info Average shift length. Calculated as total hours divided by days worked and average staff per day. 9.6 hours

This role is partially covered by contractors.

Certified Nursing Assistant

Helps with daily care and mobility.

Total count 66
Average shift length Info Average shift length. Calculated as total hours divided by days worked and average staff per day. 9.2 hours

No contractors work on this role.

Contractor staffing

Q2 2025 · Apr 1 – Jun 30 More info This data comes from the CMS Payroll-Based Journal report covering April 1 – June 30, 2025.

Total hours from contractors

12.8%

5,189 contractor hours this quarter

Licensed Practical Nurse: 29 Physical Therapy Assistant: 6 Physical Therapy Aide: 5 Qualified Social Worker: 4 Respiratory Therapy Technician: 4 Speech Language Pathologist: 3

Staff by category

Q2 2025 · Apr 1 – Jun 30 More info This data comes from the CMS Payroll-Based Journal report covering April 1 – June 30, 2025.
Certified Nursing Assistant6606619,49091100%9.2
Licensed Practical Nurse2529548,65791100%9.6
Registered Nurse8083,45291100%9.4
RN Director of Nursing4042,1326673%8.9
Physical Therapy Aide0551,3438290%6.6
Speech Language Pathologist0339026673%7.2
Nurse Aide in Training130135113538%7.7
Qualified Social Worker0445076470%6.9
Occupational Therapy Aide1015056470%7.9
Administrator1014725965%8
Dietitian1014715965%8
Nurse Practitioner1014495763%7.9
Mental Health Service Worker1014295358%8.1
Clinical Nurse Specialist1014225560%7.7
Respiratory Therapy Technician0444025662%6.7
Physical Therapy Assistant0662735156%4.8
66 Certified Nursing Assistant
% of Days 100%
54 Licensed Practical Nurse
% of Days 100%
8 Registered Nurse
% of Days 100%
4 RN Director of Nursing
% of Days 73%
5 Physical Therapy Aide
% of Days 90%
3 Speech Language Pathologist
% of Days 73%
13 Nurse Aide in Training
% of Days 38%
4 Qualified Social Worker
% of Days 70%
1 Occupational Therapy Aide
% of Days 70%
1 Administrator
% of Days 65%
1 Dietitian
% of Days 65%
1 Nurse Practitioner
% of Days 63%
1 Mental Health Service Worker
% of Days 58%
1 Clinical Nurse Specialist
% of Days 60%
4 Respiratory Therapy Technician
% of Days 62%
6 Physical Therapy Assistant
% of Days 56%

Penalties and fines

Federal penalties imposed by CMS for regulatory violations, including civil money penalties (fines) and denials of payment for new Medicare/Medicaid admissions.

Source: CMS Penalties Database

No penalties in the past 3 years

No civil money penalties or payment denials were reported in the last 3 years.

Quality of care over time

These measures show how residents usually do over time at this home, based on health outcomes and preventive care.

High-risk clinical events score Info A composite score based on pressure ulcers, falls with injury, weight loss, walking ability decline, and activities of daily living decline. 12.5
19% worse than Tennessee average

Tennessee average: 10.5

Functional decline score Info A composite score based on activities of daily living decline, walking ability decline, and incontinence. 21.5
10% worse than Tennessee average

Tennessee average: 19.5

Long-stay resident measures
Above average Info CMS star rating based on long-stay quality measure performance. 5 stars = significantly above average, 1 star = significantly below average.
Need for Help with Daily Activities Increased Info Percent of long-stay residents whose need for help with daily activities has increased 15.1%
6% better than Tennessee average

Tennessee average: 16.0%

Walking Ability Worsened Info Percent of long-stay residents whose ability to move independently worsened 28.6%
32% worse than Tennessee average

Tennessee average: 21.7%

Low Risk Residents with Bowel/Bladder Incontinence Info Percent of low risk long-stay residents who lose control of their bowels or bladder 20.9%
In line with Tennessee average

Tennessee average: 20.7%

Falls with Major Injury Info Percent of long-stay residents experiencing one or more falls with major injury 5.6%
53% worse than Tennessee average

Tennessee average: 3.7%

High Risk Residents with Pressure Ulcers Info Percent of long-stay high risk residents with pressure ulcers 6.4%
17% worse than Tennessee average

Tennessee average: 5.4%

Urinary Tract Infection Info Percent of long-stay residents with a urinary tract infection 0.4%
81% better than Tennessee average

Tennessee average: 2.1%

Lost Too Much Weight Info Percent of long-stay residents who lose too much weight 6.9%
9% worse than Tennessee average

Tennessee average: 6.3%

Depressive Symptoms Info Percent of long-stay residents who have depressive symptoms 3.0%
73% better than Tennessee average

Tennessee average: 11.0%

Antipsychotic Use Info Percent of long-stay residents who received an antipsychotic medication 7.9%
52% better than Tennessee average

Tennessee average: 16.5%

Pneumococcal Vaccine Info Percent of long-stay residents assessed and appropriately given the pneumococcal vaccine 65.6%
27% worse than Tennessee average

Tennessee average: 89.9%

Influenza Vaccine Info Percent of long-stay residents assessed and appropriately given the seasonal influenza vaccine 88.0%
7% worse than Tennessee average

Tennessee average: 94.5%

Hospitalizations per 1,000 days Info Number of hospitalizations per 1,000 long-stay resident days. 0.64
59% better than Tennessee average

Tennessee average: 1.58

ED visits per 1,000 days Info Number of outpatient emergency department visits per 1,000 long-stay resident days. 1.98
26% worse than Tennessee average

Tennessee average: 1.57

Short-stay resident measures
Above average Info CMS star rating based on short-stay quality measure performance. 5 stars = much above average, 1 star = much below average.
Pneumococcal Vaccine Info Percent of short-stay residents assessed and appropriately given the pneumococcal vaccine 29.9%
63% worse than Tennessee average

Tennessee average: 79.7%

Antipsychotic medication increase Info Percent of short-stay residents who newly received an antipsychotic medication 0.6%
67% better than Tennessee average

Tennessee average: 1.7%

Influenza Vaccine Info Percent of short-stay residents assessed and appropriately given the seasonal influenza vaccine 40.5%
49% worse than Tennessee average

Tennessee average: 79.8%

Re-hospitalized after SNF stay Info Percentage of short-stay residents who were re-hospitalized after their nursing home admission. 22.1%
In line with Tennessee average

Tennessee average: 22.2%

Emergency department visits Info Percentage of short-stay residents who had an outpatient emergency department visit. 20.2%
80% worse than Tennessee average

Tennessee average: 11.2%

Falls with major injury Info Percentage of SNF residents who experience falls with major injury during their stay. 0.8%
In line with Tennessee average

Tennessee average: 0.8%

Ability to care for self at discharge Info Percentage of residents at or above expected ability to care for themselves at discharge. 61.5%
15% better than Tennessee average

Tennessee average: 53.7%

Successful return to home or community Info Rate of successful return to home or community from a skilled nursing facility. 63.7%
26% better than Tennessee average

Tennessee average: 50.6%

Breakdown by payment type

Medicare

33% of new residents, usually for short-term rehab.

Typical stay 1 months

Private pay

50% of new residents, often for short stays.

Typical stay 1 - 2 months

Medicaid

18% of new residents, often for long-term daily care.

Typical stay 11 - 12 months

Facility Characteristics

Source: CMS Long-Term Care Facility Characteristics (Data as of Jan 2026)

Total residents 97
Medicare
12
12.4% of residents
Medicaid
38
39.2% of residents
Private pay or other
47
48.5% of residents
Programs & Services
Residents Group

Residents meet regularly to discuss policies, care quality, and activities

Nurse Aide Training

State-approved Nurse Aide Training and Competency Evaluation Program on-site

Active Resident Council

Organized group of residents that meets regularly to discuss facility policies, quality of life, and activities.

Finances and operations

Governmental community
Operated by county authorities.
Home revenue
$14.9M
Surplus of revenue
$3.6M
Governmental community Operated by county authorities.
Home revenue
$14.9M Rank #57 / 141Revenue — State benchmarkedThis home is ranked 57th out of 141 homes in Tennessee. Shows this facility's annual revenue compared to the Tennessee SNF average. Higher revenue generally means more resources for staffing and capital — read alongside Payroll %.Click the rank badge to see the full State ranking.Click here to see the full State ranking.
Surplus of revenue
$3.6M
Payroll costs Info The portion of the home's budget spent on staff, including nurses, caregivers, and other employees who support care and operations. Rank #83 / 141Payroll — State benchmarkedThis home is ranked 83rd out of 141 homes in Tennessee. Shows total annual staff payroll benchmarked to the Tennessee average. Higher payroll investment relative to peers often signals better staffing and less reliance on cheaper contract labor.Click the rank badge to see the full State ranking.Click here to see the full State ranking.
$4.9M
32.8% of revenue Rank #131 / 141Payroll % — State benchmarkedThis home is ranked 131st out of 141 homes in Tennessee. Shows payroll as a percentage of revenue versus the Tennessee average. Well-run Tennessee SNFs typically land around 50–60% — the top third Statewide. Below 25% may signal understaffing or heavy agency use — read with Staffing ratings.Click the rank badge to see the full State ranking.Click here to see the full State ranking.
Other operating costs Info All remaining costs needed to run the home, such as food, utilities, building maintenance, supplies and administrative expenses.
$6.4M
Total costs $11.3M

What does this home offer?

Housing options icon

Housing Options: Private / Shared Rooms

Building type icon
Building type icon

Building Type: Single-story

Dining services icon

Dining Services

Housekeeping icon
Housekeeping icon

Housekeeping Services

Social and recreational activities icon

Social and Recreational Activities

On-site medical care and health services icon

On-site Medical Care and Health Services

Rehabilitative support icon

Rehabilitative Support

Who this home usually serves

TYPE OF STAY

Mix of rehab and long-term care

This home supports both short-term rehab and long-term care, with residents staying for a wide range of durations.

Places of interest near Henry County Health and Rehabilitation

Address 1.6 miles from city center Info Estimated distance in miles from Paris's city center to Henry County Health and Rehabilitation's address, calculated via Google Maps.

Calculate Travel Distance to Henry County Health and Rehabilitation

Add your location

Address

Financial Assistance for
Nursing Home in Tennessee

Henry County Health and Rehabilitation is located in Paris, Tennessee.
Here are the financial assistance programs available to residents in Tennessee.

Get Financial aid guidance

CHOICES Program

TN Medicaid CHOICES

Age 65+ or disabled
General Tennessee resident, Medicaid-eligible, nursing home-level care need.
Income Limits (2025) ~$2,829/month 300% FBR, individual
Asset Limits $2,000 (individual), $3,000 (couple).
TN

Managed care model; high rural demand.

Benefits
Personal care (5-7 hours/day) Respite (240 hours/year) Adult day care ($65/day) Home modifications ($1,500 avg.)

Tennessee Options for Community Living

TN Options

Age 60+
General Tennessee resident, at risk of nursing home.
Income Limits ~$2,000/month individual, varies
Asset Limits $5,000 individual
TN

Limited funding; rural/urban balance.

Benefits
In-home care (3-5 hours/week) Respite (up to 10 days/year) Transportation (~5 trips/month)

Medicare Savings Program (MSP)

Tennessee Medicare Savings Program

Age 65+ or disabled
General TN resident, Medicare Part A/B.
Income Limits (2025) ~$2,510/month (QMB), ~$3,380/month (SLMB), ~$3,598/month (QI)—individual.
Asset Limits $9,430 (individual), $14,130 (couple).
TN

Three tiers; includes Extra Help for Part D; no waitlist.

Benefits
Covers Part B premiums ($174.70/month) Deductibles ($240/year) Copays (~20%)

Family Caregiver Support Program (FCSP)

Tennessee Family Caregiver Support Program

Age
General Caregivers of 60+ needing care or 55+ caregivers of others; TN resident; functional needs (2+ ADLs).
Income Limits (2025) No strict cap; prioritizes low-income ~$24,980/year
Asset Limits Not assessed; need-based.
TN

Includes grandparent caregivers; high rural demand.

Benefits
Respite (4-6 hours/week or 5 days/year) Adult day care ($60/day) Training Supplies (~$500/year)

VA Aid and Attendance (A&A) and Housebound Benefits

Tennessee VA Aid and Attendance/Housebound

Age 65+ or disabled veteran/spouse
General TN resident, wartime service, need for ADL help (A&A) or homebound.
Income Limits (2025) Net income < ~$1,984/month (veteran with dependent, A&A); pension offsets income.
Asset Limits ~$155,356 net worth limit
TN

High veteran population; supports rural/urban care needs.

Benefits
Cash (~$1,433-$2,642/month veteran, ~$951-$1,318 spouse) for care costs (e.g., in-home, assisted living)

Elderly Nutrition Program

Tennessee Elderly Nutrition Program

Age 60+
General TN resident; no income limit but prioritizes low-income.
Income Limits (2025) None; donations encouraged.
Asset Limits Not assessed.
TN

Serves ~50,000 annually; 200+ congregate sites plus Meals on Wheels.

Benefits
Congregate meals ($5-$7/meal value) at senior centers Home-delivered meals ($5-$7/meal)

Property Tax Relief Program

Tennessee Property Tax Relief Program

Age 65+
General TN resident, homeowner/renter (or widow/er 50+, disabled 18+).
Income Limits (2025) ~$45,000/year household, excludes half of Social Security
Asset Limits Not assessed; income-focused.
TN

Rebates up to $1,000; serves ~100,000 annually.

Benefits
Tax rebates (~$250-$1,000 based on income; e.g., $1,000 if income < $8,000)

Frequently Asked Questions about Henry County Health and Rehabilitation

Is Henry County Health and Rehabilitation in a walkable area?

Henry County Health and Rehabilitation has a walk score of 43. Somewhat walkable. A few nearby services may be reachable on foot, but most trips require transportation.

What is the address of Henry County Health and Rehabilitation?

Henry County Health and Rehabilitation is located at 239 Hospital Cir, Paris, TN 38242.

What is the phone number of Henry County Health and Rehabilitation?

(731) 642-5700 will put you in contact with the team at Henry County Health and Rehabilitation.

Is Henry County Health and Rehabilitation Medicare or Medicaid certified?

Yes — Henry County Health and Rehabilitation is a CMS-certified provider of Medicare and Medicaid.

Guides for Better Senior Living

Care Cost Calculator: See Prices in Your Area

Nursing Home Data Explorer

Don’t Wait Too Long: 7 Red Flag Signs Your Parent Needs Assisted Living Now

The True Cost of Assisted Living in 2025 – And How Families Are Paying For It

Understanding Senior Living Costs: Pricing Models, Discounts & Financial Assistance

Explore Open Rooms
1 Contact details
2 What type of senior care service are you looking for?
3 What budget do you have in mind for senior care?
4 How soon do you need to find care?
5 Additional details

Thank you for your interest!

Our team will be in touch shortly to help with next steps.