Heritage Manor of Baton Rouge
Nursing Home, Memory Care, Nursing Care & Palliative Care · Baton Rouge, LA
CMS overall rating Info CMS (the Centers for Medicare & Medicaid Services) is the federal agency that rates nursing home quality. Its Overall Rating runs from 1 to 5 stars, combining health inspections, staffing, and quality measures, with inspections weighted most heavily.

Heritage Manor of Baton Rouge

Nursing Home, Memory Care, Nursing Care & Palliative Care · Baton Rouge, LA
CMS overall rating Info CMS (the Centers for Medicare & Medicaid Services) is the federal agency that rates nursing home quality. Its Overall Rating runs from 1 to 5 stars, combining health inspections, staffing, and quality measures, with inspections weighted most heavily.
Calculator: See prices in your area
Heritage Manor of Baton Rouge accepts Medicare, Medicaid, and private pay.

Overview of Heritage Manor of Baton Rouge

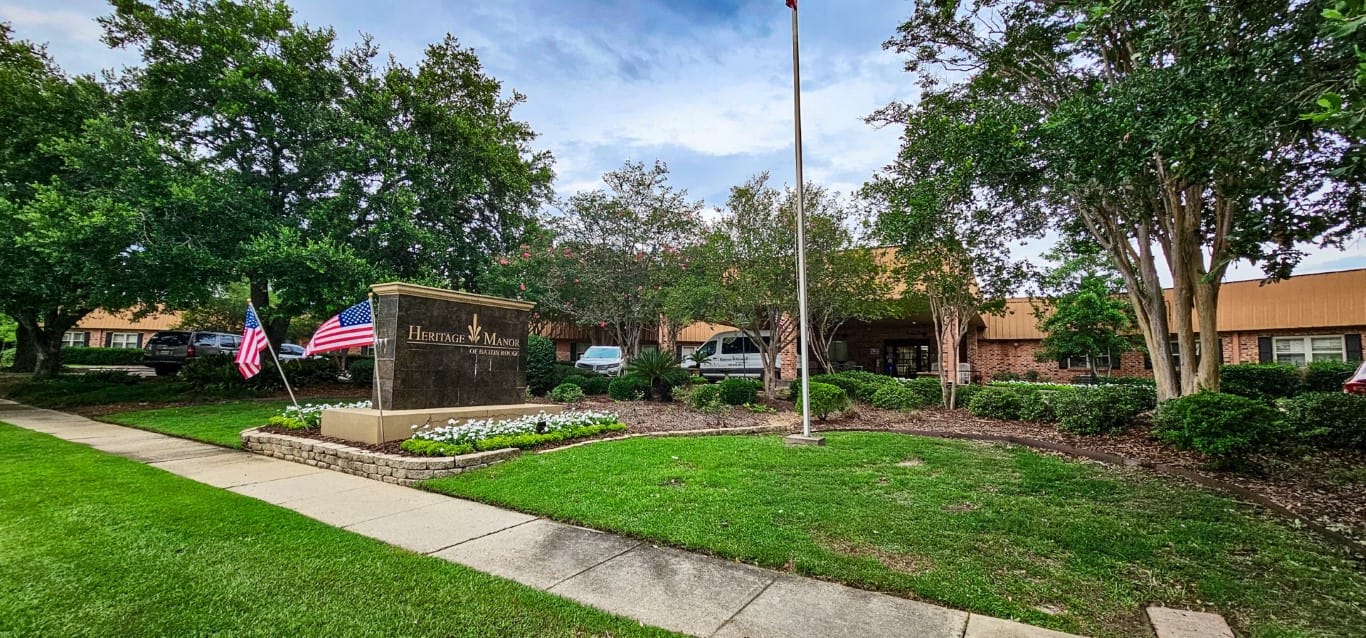
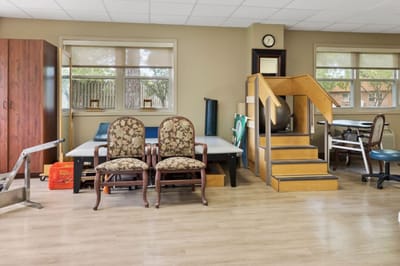
Nestled in the charming neighborhood of Baton Rouge, LA, Heritage Manor of Baton Rouge is a reliable senior care provider, offering an array of clinical services, including skilled nursing, wound care, long-term care, memory care, and hospice care. Designed to accommodate residents who need support with their recovery or looking to maintain their optimal functionality, the community provides a reliable care team that carefully monitors residents’ unique care plans.

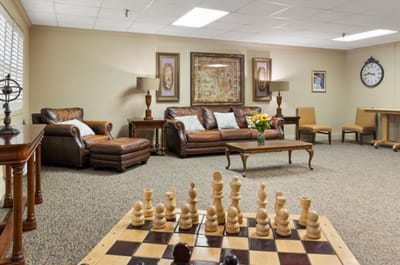
The community’s team of professionals collaborates closely with residents and their personal physician in treating or managing their conditions effectively, making sure their wishes and preferences are considered. In addition to extensive rehabilitation services, residents are offered a wide variety of activities that keep them active and entertained. Here, residents are offered more than excellent care services but also a warm and encouraging environment that fosters quick recovery.

Quality ratings

Measured by Centers for Medicare & Medicaid Services (CMS)

Overall rating Info The Overall CMS Rating combines results from health inspections, staffing levels and quality measures. Health inspections carry the most weight. Staffing and quality scores can increase or decrease the final rating based on performance compared to state and national standards.
Health Inspection Info Based on the results of the facility's three most recent standard inspections and any complaint investigations. CMS reviews the number, scope, and severity of deficiencies, with more recent findings weighted more heavily.
Staffing Info Measures average nursing staff hours per resident per day, including Registered Nurses (RNs) and total nursing staff. Ratings are adjusted based on the level of care residents require and are compared to state and national benchmarks.
Quality Measures Info Based on clinical and physical health indicators reported to CMS, such as hospital readmissions, falls, pressure ulcers, and improvements in mobility. These measures reflect how well residents' health needs are being managed.

Staffing hours breakdown

Info Daily nursing hours per resident by staff type, reported to CMS. Higher is generally better — compare this facility to state and national averages to see where staffing stands.

Hours per resident per day — compared to state averages

Total nursing care / resident Info Total adjusted nursing hours per resident per day, combining RN, LPN, and aide time. CMS adjusts this for case-mix so facilities can be fairly compared.
4h 5m per day
Rank #79 / 199Nurse hours — State benchmarkedThis home is ranked 79th out of 199 homes in Louisiana. Shows adjusted nurse hours per resident per day benchmarked to the Louisiana average, with a ranking across 199 Louisiana facilities. More hours mean more direct care. The national average is about 3.5 hrs; below 3.0 is a red flag.Rankings are based only on facilities in Louisiana that report data for that category. Facilities without available data are excluded from the ranking.Click the rank badge to see the full State ranking.Click here to see the full State ranking.
vs avg

4 of 6 metrics below state avg

Staff typeHours / Day / Residentvs state avg
Registered Nurse (RN) Info RNs hold the highest nursing license and can assess residents, interpret test results, and direct care plans. More RN hours per day often signals stronger clinical oversight and faster response to health changes. 12m per day ▼ 39% State avg: 19m per day · National avg: 41m per day
LPN / LVN Info Licensed Practical Nurses (LPNs) or Licensed Vocational Nurses (LVNs) deliver routine hands-on care — medication administration, wound dressing, and monitoring vital signs. They work under RN supervision and make up a large share of daily bedside care. 1h 4m per day ▼ 10% State avg: 1h 11m per day · National avg: 52m per day
Nurse Aide Info Certified Nurse Aides (CNAs) provide the most direct day-to-day assistance: bathing, dressing, feeding, and mobility. Nurse aide hours are typically the largest staffing category and directly affect residents' quality of life. 2h 22m per day ■ Avg State avg: 2h 19m per day · National avg: 2h 20m per day
Weekend Total Nursing Info Combined nursing hours (RN + LPN + Nurse Aide) per resident per day on weekends. Staffing often drops on weekends — this figure reveals whether the facility maintains adequate coverage outside of weekday hours. 3h 16m per day ■ Avg State avg: 3h 16m per day · National avg: 3h 26m per day
Physical Therapist Info Hours per resident per day provided by licensed Physical Therapists (PTs) or PT Assistants. PT services help residents recover mobility after injury or illness and are especially important for post-acute (short-stay) rehabilitation. 1m per day ▼ 71% State avg: 3m per day · National avg: 4m per day
Weekend RN Info Registered nurse hours specifically on weekends. Facilities sometimes reduce RN presence on Saturdays and Sundays — a low weekend RN figure compared to weekday hours can indicate reduced clinical oversight when most administrative staff are absent. 6m per day ▼ 57% State avg: 13m per day · National avg: 28m per day

Capacity and availability

This home usually has availability

Lower occupancy than the state average
Occupancy rate
78% Rank #77 / 204Occupancy rate — State benchmarkedThis home is ranked 77th out of 204 homes in Louisiana. Shows this facility's occupancy rate versus the Louisiana average, with its Statewide rank out of 204. Higher occupancy signals strong local demand and financial stability.Rankings are based only on facilities in Louisiana that report data for that category. Facilities without available data are excluded from the ranking.Click the rank badge to see the full State ranking.Click here to see the full State ranking.
Avg. Length of Stay
219 days
Bed community size
160-bed community Rank #31 / 262Bed count — State benchmarkedThis home is ranked 31st out of 262 homes in Louisiana. Shows this facility's certified or reported bed count compared to other Louisiana facilities. Larger communities may offer more amenities, programs, and on-site services for residents and families.Rankings are based only on facilities in Louisiana that report data for that category. Facilities without available data are excluded from the ranking.Click the rank badge to see the full State ranking.Click here to see the full State ranking.
A large-scale community that may provide a wide range of amenities, services, and structured programs.
Walk Score
Walk Score: 22 / 100 Rank #264 / 368Walk Score — State benchmarkedThis home is ranked 264th out of 368 homes in Louisiana. Shows how walkable this facility's neighborhood is compared to the average Walk Score across Louisiana facilities. Higher scores benefit residents, families, and staff.Rankings are based only on facilities in Louisiana that report data for that category. Facilities without available data are excluded from the ranking.Click the rank badge to see the full State ranking.Click here to see the full State ranking.
Car-dependent. Most errands require a car, with limited nearby walkable options.
BBB Rating
BBB Rating: A+ (Not Accredited)
An independent rating from the Better Business Bureau based on factors such as complaint history, transparency, and business practices.
How BBB ratings work

Staffing

Key information about the people who lead and staff this community.

Leadership

ContactNicholas Castell, Administrator

Staff Details

Total Employees
100
Full-Time Employees
100

Contact Heritage Manor of Baton Rouge

Penalties and fines

Federal penalties imposed by CMS for regulatory violations, including civil money penalties (fines) and denials of payment for new Medicare/Medicaid admissions.

Source: CMS Penalties Database

No penalties in the past 3 years

No civil money penalties or payment denials were reported in the last 3 years.

Quality of care over time

These measures show how residents usually do over time at this home, based on health outcomes and preventive care.

Long-stay resident measures
Below average State avg: 2.2 Info CMS star rating based on long-stay quality measure performance. 5 stars = significantly above average, 1 star = significantly below average.
Hospitalizations per 1,000 days Info Number of hospitalizations per 1,000 long-stay resident days. 2.41
8% better than State average

State average: 2.61

ED visits per 1,000 days Info Number of outpatient emergency department visits per 1,000 long-stay resident days. 2.61
6% better than State average

State average: 2.77

Short-stay resident measures
Average State avg: 2.0 Info CMS star rating based on short-stay quality measure performance. 5 stars = much above average, 1 star = much below average.
Re-hospitalized after SNF stay Info Percentage of short-stay residents who were re-hospitalized after their nursing home admission. 41.9%
51% worse than State average

State average: 27.8%

Emergency department visits Info Percentage of short-stay residents who had an outpatient emergency department visit. 10.2%
31% better than State average

State average: 14.7%

Falls with major injury Info Percentage of SNF residents who experience falls with major injury during their stay. 0.0%
100% better than State average

State average: 0.8%

Ability to care for self at discharge Info Percentage of residents at or above expected ability to care for themselves at discharge. 42.9%
20% worse than State average

State average: 53.7%

Successful return to home or community Info Rate of successful return to home or community from a skilled nursing facility. 49.6%
In line with State average

State average: 50.6%

Breakdown by payment type

Medicare

15% of new residents, usually for short-term rehab.

Typical stay 1 - 2 months

Private pay

77% of new residents, often for short stays.

Typical stay 2 - 3 months

Medicaid

8% of new residents, often for long-term daily care.

Typical stay 7 years

Finances and operations

Based on CMS SNF Cost Report for fiscal year ending in 12/2023.

For-profit
Operated by a single business entity.
Net patient revenue Info Net patient revenue — what the home actually collects for resident care, after contractual allowances, bad debt and discounts are subtracted from its gross charges (CMS cost report, Worksheet G-3). It covers resident care only; money the home earns from other sources is shown separately as "Other income."
$10.7M
Net patient income Info Net patient income: net patient revenue minus the home's total operating expenses. A positive figure means it earns more from resident care than it spends to deliver it; a negative figure means the opposite. It excludes non-operating "other income."
$778.0K
For-profit Operated by a single business entity.
Net patient revenue Info Net patient revenue — what the home actually collects for resident care, after contractual allowances, bad debt and discounts are subtracted from its gross charges (CMS cost report, Worksheet G-3). It covers resident care only; money the home earns from other sources is shown separately as "Other income."
$10.7M Rank #113 / 203Revenue — State benchmarkedThis home is ranked 113th out of 203 homes in Louisiana. Shows this facility's annual revenue compared to the Louisiana average. Higher revenue generally means more resources for staffing and capital — read alongside Payroll %.Rankings are based only on facilities in Louisiana that report data for that category. Facilities without available data are excluded from the ranking.Click the rank badge to see the full State ranking.Click here to see the full State ranking.
Net patient income Info Net patient income: net patient revenue minus the home's total operating expenses. A positive figure means it earns more from resident care than it spends to deliver it; a negative figure means the opposite. It excludes non-operating "other income."
$778.0K
Other income Info Money the home earns outside of resident care — such as investments, grants, rentals and other non-operating sources (CMS cost report, Worksheet G-3). It is tracked separately from net patient revenue: it is not part of that figure, and it is not included in net patient income.
$62.9K
Payroll costs Info Staff salaries plus wage-related costs — benefits such as payroll taxes, health insurance and retirement — from the home's own accounting records (CMS cost report, Worksheet A). Contract or agency labor is counted separately, under other operating costs. Rank #57 / 203Payroll — State benchmarkedThis home is ranked 57th out of 203 homes in Louisiana. Shows total annual staff payroll benchmarked to the Louisiana average. Higher payroll investment relative to peers often signals better staffing and less reliance on cheaper contract labor.Rankings are based only on facilities in Louisiana that report data for that category. Facilities without available data are excluded from the ranking.Click the rank badge to see the full State ranking.Click here to see the full State ranking.
$5.2M 48.7% of net patient revenue Info Payroll as a share of revenue: staff salaries and wage-related benefits divided by net patient revenue. A higher figure means more of each revenue dollar goes to staff pay. Rank #32 / 203Payroll % — State benchmarkedThis home is ranked 32nd out of 203 homes in Louisiana. Shows payroll as a percentage of revenue versus the Louisiana average. Well-run Louisiana facilities typically land around 54–67% — the top third Statewide. Below 25% may signal understaffing or heavy agency use — read with Staffing ratings.Rankings are based only on facilities in Louisiana that report data for that category. Facilities without available data are excluded from the ranking.Click the rank badge to see the full State ranking.Click here to see the full State ranking.
Other operating costs Info Everything it costs to run the home apart from payroll — food, utilities, supplies, maintenance, contract labor and administration. Calculated as total operating expense minus payroll (staff salaries and wage-related benefits).
$4.7M
Total costs Info The home's total operating expense for the year — all the costs of running it, salaries included (CMS cost report, Worksheet G-3).
$9.9M

What does this home offer?

Housing options icon

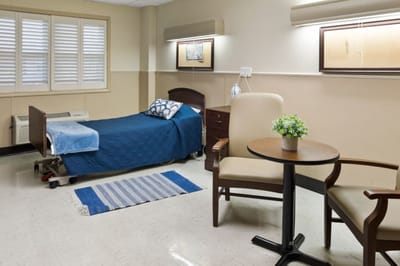
Housing Options: Private / Semi-Private Rooms

Building type icon
Building type icon

Building Type: Single-story

Transportation services icon

Transportation Services

Fitness and recreation icon

Fitness and Recreation

Who this home usually serves

TYPE OF STAY

Primarily short stays

Residents typically stay for brief periods, with frequent admissions and discharges throughout the year.

Most new residents arrive under private pay (77% of admissions), and a typical private pay stay runs around 2 - 3 months.

Admissions
148 total

Coverage residents most often arrive under.

Medicare 15%
Private pay 77%
Medicaid 8%
Discharges
187 total

Coverage residents most often leave under.

Medicare 15%
Private pay 72%
Medicaid 13%

Places of interest near Heritage Manor of Baton Rouge

Address 6.8 miles from city center Info Estimated distance in miles from Baton Rouge's city center to Heritage Manor of Baton Rouge's address, calculated via Google Maps.

Calculate Travel Distance to Heritage Manor of Baton Rouge

Add your location

Address

Compare Nursing Homes around the area

The information below is reported by the Louisiana Department of Health, Health Standards Section.

St Helena Parish Nursing Home
NH
Greensburg -72 A+ 34 -
St Francisville Nursing and Rehab, L.L.C.
NH
Saint Francisville (St. Francisville) -128 A+ 0 -
The Lodge at Lane
NH
AL
MC
Zachary -39 A+ 33 -
Lagniappe Healthcare
NH
HC
RC
Bastrop (Morehouse Parish) -112 A+ 18 -

Frequently Asked Questions about Heritage Manor of Baton Rouge

What neighborhood is Heritage Manor of Baton Rouge in?

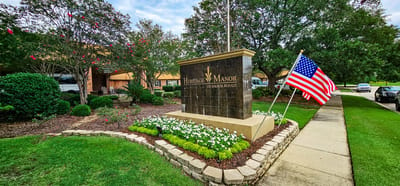
Heritage Manor of Baton Rouge is in the Oxford Place Drive neighborhood of Baton Rouge.

Is Heritage Manor of Baton Rouge in a walkable area?

Heritage Manor of Baton Rouge has a walk score of 22. Car-dependent. Most errands require a car, with limited nearby walkable options.

What is the occupancy rate at Heritage Manor of Baton Rouge?

Heritage Manor of Baton Rouge's occupancy is 78.0%.

Does Heritage Manor of Baton Rouge operate as a for-profit or non-profit?

Heritage Manor of Baton Rouge is registered as a for-profit in LA.

Are there photos of Heritage Manor of Baton Rouge?

Yes — there are 5 photos of Heritage Manor of Baton Rouge in the photo gallery on this page.

What is the address of Heritage Manor of Baton Rouge?

Heritage Manor of Baton Rouge is located at 9301 Oxford Pl Dr, Baton Rouge, LA 70809.

What is the phone number of Heritage Manor of Baton Rouge?

(225) 924-2851 will put you in contact with the team at Heritage Manor of Baton Rouge.

Guides for Better Senior Living

Care Cost Calculator: See Prices in Your Area

Nursing Home Data Explorer

Don’t Wait Too Long: 7 Red Flag Signs Your Parent Needs Assisted Living Now

The True Cost of Assisted Living in 2025 – And How Families Are Paying For It

Understanding Senior Living Costs: Pricing Models, Discounts & Financial Assistance