Highfield Gardens Care Center

Nursing Home in Long Island

CMS overall rating Info The Overall CMS Rating is scored from 1 to 5 stars and combines results from health inspections, staffing levels, and quality measures. Health inspections carry the most weight. Staffing and quality scores can increase or decrease the final rating based on performance compared to state and national standards.
Calculator: See prices in your area
Highfield Gardens Care Center accepts Medicare, Medicaid, and private pay.

Overview of Highfield Gardens Care Center

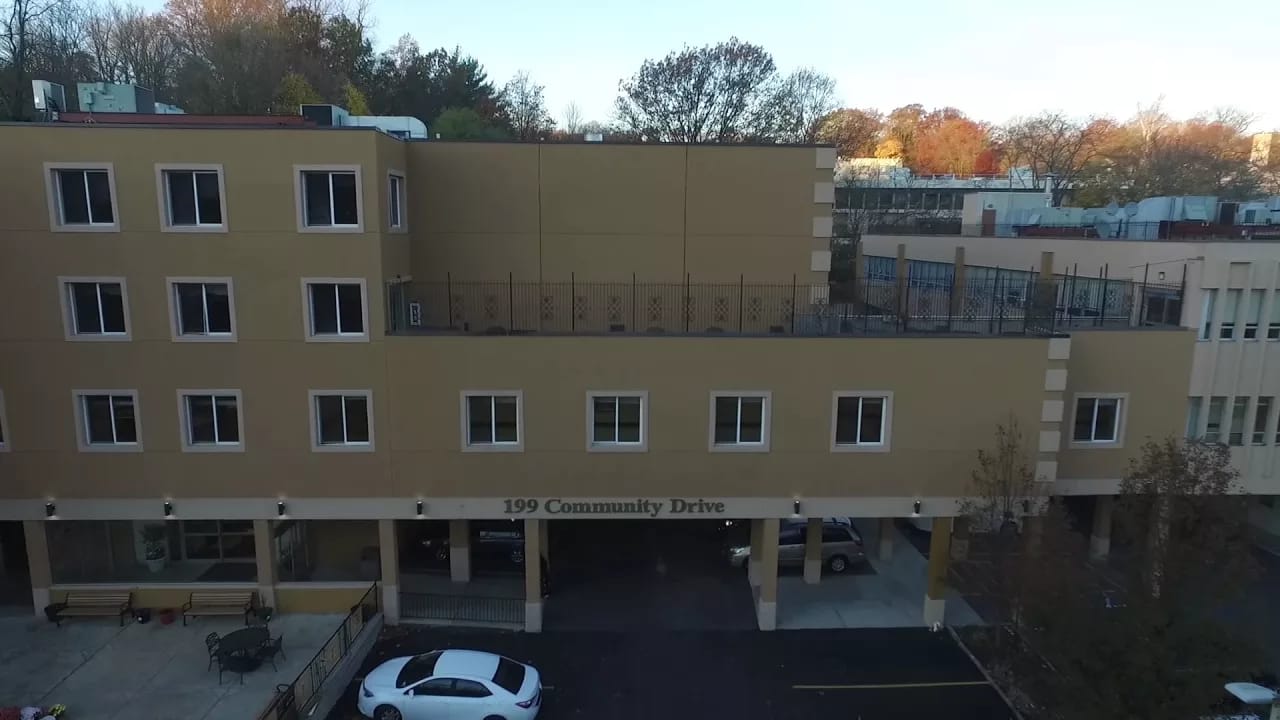
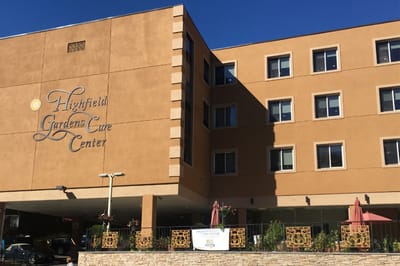
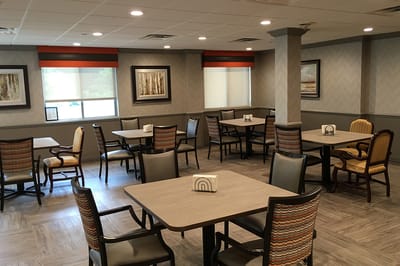
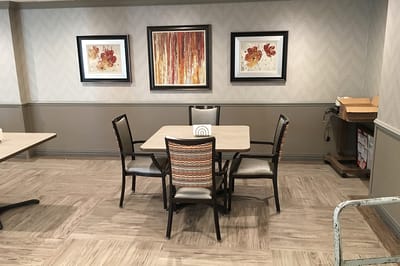
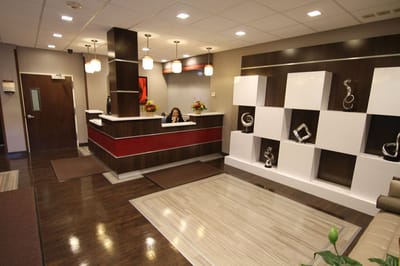
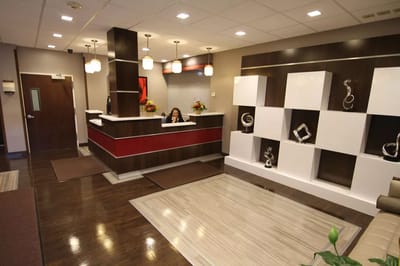
Situated in Great Neck, New York, Highfield Gardens Care Center rises as a meticulously maintained facility offering top-notch rehabilitation and subacute services. With a focus on holistic care, they boast a team of dedicated therapists proficient in physical, occupational, and speech therapies. Beyond the exceptional healthcare services, Highfield Gardens takes pride in its delectable cuisine, ensuring residents enjoy not only nourishing meals but also a delightful dining experience.

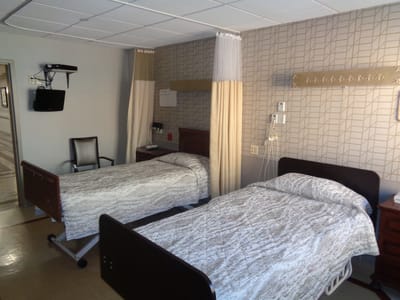
Residents can engage in various recreational activities, and the availability of concierge services adds an extra layer of convenience to their daily lives. With 200 beds and participation in Medicare and Medicaid programs, Highfield Gardens Care Center provides a comfortable, supportive, and caring environment for individuals in need of rehabilitation and subacute care.

Quality ratings

Measured by Centers for Medicare & Medicaid Services (CMS)

Overall rating Info The Overall CMS Rating combines results from health inspections, staffing levels and quality measures. Health inspections carry the most weight. Staffing and quality scores can increase or decrease the final rating based on performance compared to state and national standards.
▲ 27.4% Above NY avg.
Health Inspection Info Based on the results of the facility's three most recent standard inspections and any complaint investigations. CMS reviews the number, scope, and severity of deficiencies, with more recent findings weighted more heavily.
▲ 5.6% Above NY avg.
Staffing Info Measures average nursing staff hours per resident per day, including Registered Nurses (RNs) and total nursing staff. Ratings are adjusted based on the level of care residents require and are compared to state and national benchmarks.
▲ 48.1% Above NY avg.
Quality Measures Info Based on clinical and physical health indicators reported to CMS, such as hospital readmissions, falls, pressure ulcers, and improvements in mobility. These measures reflect how well residents' health needs are being managed.
▲ 26.6% Above NY avg.

Staffing hours breakdown

Info Daily nursing hours per resident by staff type, reported to CMS. Higher is generally better — compare this facility to state and national averages to see where staffing stands.

Hours per resident per day — compared to New York state averages

Total nursing care / resident Info This home is ranked 86th out of 347 homes in New York.

Total adjusted nursing hours per resident per day, combining RN, LPN, and aide time. CMS adjusts this for case-mix so facilities can be fairly compared.
3h 52m per day
Rank #86 / 347Nurse hours — state benchmarkedThis home is ranked 86th out of 347 homes in New York.Shows adjusted nurse hours per resident per day benchmarked to the New York average, with a ranking across 347 New York SNFs. More hours mean more direct care. The national average is about 3.5 hrs; below 3.0 is a red flag.
This facility New York avg (3h 29m per day)
vs New York avg
+11%

1 of 6 metrics below state avg

Standout metric Nurse Aide is +24% above state avg
Staff typeHours / dayvs state avg
Registered Nurse (RN) Info RNs hold the highest nursing license and can assess residents, interpret test results, and direct care plans. More RN hours per day often signals stronger clinical oversight and faster response to health changes. 44m per day ▲ 5% State avg: 42m per day · National avg: 41m per day
LPN / LVN Info Licensed Practical Nurses (LPNs) or Licensed Vocational Nurses (LVNs) deliver routine hands-on care — medication administration, wound dressing, and monitoring vital signs. They work under RN supervision and make up a large share of daily bedside care. 36m per day ▼ 22% State avg: 46m per day · National avg: 52m per day
Nurse Aide Info Certified Nurse Aides (CNAs) provide the most direct day-to-day assistance: bathing, dressing, feeding, and mobility. Nurse aide hours are typically the largest staffing category and directly affect residents' quality of life. 2h 42m per day ▲ 24% State avg: 2h 11m per day · National avg: 2h 21m per day
Total Nursing (Weekend) Info Combined nursing hours (RN + LPN + Nurse Aide) per resident per day on weekends. Staffing often drops on weekends — this figure reveals whether the facility maintains adequate coverage outside of weekday hours. 3h 31m per day ▲ 11% State avg: 3h 10m per day · National avg: 3h 26m per day
Physical Therapist Info Hours per resident per day provided by licensed Physical Therapists (PTs) or PT Assistants. PT services help residents recover mobility after injury or illness and are especially important for post-acute (short-stay) rehabilitation. 8m per day ▲ 14% State avg: 7m per day · National avg: 4m per day
RN (Weekend) Info Registered nurse hours specifically on weekends. Facilities sometimes reduce RN presence on Saturdays and Sundays — a low weekend RN figure compared to weekday hours can indicate reduced clinical oversight when most administrative staff are absent. 33m per day ▲ 18% State avg: 28m per day · National avg: 29m per day

Capacity and availability

Avg. Length of Stay
173 days

Who this home usually serves

TYPE OF STAY

Mostly short-term rehab stays

Most residents typically stay for a few weeks or months before returning home or moving on.

Breakdown by payment type

Medicare

55% of new residents, usually for short-term rehab.

Typical stay 2 months

Private pay

22% of new residents, often for short stays.

Typical stay 4 - 5 months

Medicaid

22% of new residents, often for long-term daily care.

Typical stay 1 - 2 years

Finances and operations

Privately-owned community
Operated by a business corporation.
Home revenue
$38.9M
Profit
$1.8M
Privately-owned community Operated by a business corporation.
Home revenue
$38.9M Rank #107 / 344Revenue — state benchmarkedThis home is ranked 107th out of 344 homes in New York.Shows this facility's annual revenue compared to the New York SNF average. Higher revenue generally means more resources for staffing and capital — read alongside Payroll %.
Profit
$1.8M
Payroll costs Info The portion of the home's budget spent on staff, including nurses, caregivers, and other employees who support care and operations. Rank #126 / 344Payroll — state benchmarkedThis home is ranked 126th out of 344 homes in New York.Shows total annual staff payroll benchmarked to the New York average. Higher payroll investment relative to peers often signals better staffing and less reliance on cheaper contract labor.
$11.8M
30.3% of revenue Rank #216 / 343Payroll % — state benchmarkedThis home is ranked 216th out of 343 homes in New York.Shows payroll as a percentage of revenue versus the New York average. Well-run SNFs often land around 55–65%. Below 25% may signal understaffing or heavy agency use — read with Staffing ratings.
Other operating costs Info All remaining costs needed to run the home, such as food, utilities, building maintenance, supplies and administrative expenses.
$25.2M
Total costs $37.0M
Bed community size
200-bed community
A large-scale community that may provide a wide range of amenities, services, and structured programs.
Walk Score
Walk Score: 55 / 100 Rank #73 / 116Walk Score — state benchmarkedThis home is ranked 73rd out of 116 homes in New York.Shows how walkable this facility's neighborhood is compared to the average Walk Score across New York SNFs. Higher scores benefit residents, families, and staff.
Moderately walkable. Some errands can be accomplished on foot, with a mix of nearby amenities.

About this community

Occupancy

Occupancy rate
19%
Rank #343 / 348Occupancy rate — state benchmarkedThis home is ranked 343rd out of 348 homes in New York.Shows this facility's occupancy rate versus the New York average, with its statewide rank out of 348. Higher occupancy signals strong local demand and financial stability.
Lower than the New York average: 88.3%
Occupied beds
37 / 200
Average residents 166 per day

License Details

Facility TypeNursing Home
CountyNassau
CMS Certification Number335250

Ownership & Operating Entity

Highfield Gardens Care Center is legally operated by Wedgewood Care Center, Inc. (For Profit).

Therapy & Rehabilitation

3 services
Rehabilitation Services
Respite Care
Short-Term Rehab

Staffing & Medical

1 service
24-Hour Staffing

Amenities & Lifestyle

Light
Airy Interiors
Quality Furniture
Attractive Décor
Flat-Screen Cable Tv
Convenient Bedside Phones
Fitness Activities
Cultural And Educational Programs
Professional Entertainment
Community Trips
Social Gatherings
Recreational Activities
Arts And Crafts
Study Groups
Games

Dining & Nutrition

Food DescriptionMeals are more than just food; they’re an event at Highfield Gardens Care Center of Great Neck. Features a chef and dietician team-up for balanced, tasty meals. Serves three delectable meals a day in our elegant dining room.

Types of Care at Highfield Gardens Care Center

Assisted Living Memory Care Skilled Nursing

Contact Highfield Gardens Care Center

Inspection History

In New York, the Department of Health, Office of Aging and Long Term Care performs unannounced onsite inspections to monitor compliance with state and federal healthcare regulations.

Enforcement Actions Info Enforcement actions are formal penalties or interventions imposed by the New York State Department of Health when a nursing home fails to meet state or federal care, safety, or regulatory standards. They may include directed plans of correction, civil monetary penalties, denial of payment, or appointment of temporary management.

Since 2020
3 enforcement actions

This facility has 3 enforcement actions. 57% of NY nursing homes have zero, and the statewide average is 0.9.

  • November 21, 2021 Quality of Care #NH-21-222
  • January 7, 2021 Quality of Care #NH-21-050
  • September 15, 2020 Multiple Deficiencies #NH-20-071

Inspection Scorecard Info This scorecard compares key inspection, citation, and complaint metrics at this facility against the New York state average. Metrics rated ≥15% worse than average are highlighted in red; those ≥15% better are highlighted in green.

Since 2020 vs. New York state average
Overall vs. NY average 1 Worse Metrics worse than NY average:
• Life safety citations (25% above)
1 At Avg Metrics at NY average:
• Total inspections (at NY avg)
10 Better Metrics better than NY average:
• Total citations (21% below)
• Health citations (10% below)
• Citations per year (21% below)
• Citations per inspection (19% below)
• Inspections with citations (20% below)
• Inspection citation rate (21% below)
• Total complaints (54% below)
• Complaints per year (55% below)
• Complaints per bed (64% below)
• Complaint investigations (20% below)
Latest Inspection February 3, 2025 Annual Inspection

Citations Info Citations are formal regulatory violations recorded during state inspections.

Rank #146 / 353 This home is ranked #146 of 353 in New York for citations. Total citations are formal regulatory violations recorded by inspectors. Counts above the state average can signal care issues, but may also reflect more frequent inspections. For fuller context, pair with severity breakdown and how recently citations were issued. Distribution across 353 NY homes Top 20%: 72 homes had < 10 citations 20–40%: 72 homes had 9–14 citations 40–60%: 72 homes had 14–19 citations 60–80%: 72 homes had 19–25 citations 80–100%: 69 homes had > 24 citations
MetricThis FacilityNY Averagevs. NY Avg
Total citations Info Formal regulatory violations recorded by inspectors across all inspection types. 2329 This facility has 21% fewer total citations than a typical NY nursing home (23 vs. NY avg 29).↓ 21% better
Health citations Info Violations related to resident care, clinical practices, and day-to-day operations. 1820 This facility has 10% fewer health citations than a typical NY nursing home (18 vs. NY avg 20).↓ 10% better
Life safety citations Info Violations related to building safety — fire prevention, emergency egress, and similar. 54 This facility has 25% more life safety citations than a typical NY nursing home (5 vs. NY avg 4).↑ 25% worse
Citations per year Info Average citations per year since 2020. 3.84.8 This facility has 21% fewer citations per year than a typical NY nursing home (3.8 vs. NY avg 4.8).↓ 21% better
Citations per inspection Info Average citations per inspection. 2.63.2 This facility has 19% fewer citations per inspection than a typical NY nursing home (2.6 vs. NY avg 3.2).↓ 19% better

Inspections Info State inspections evaluate whether the facility meets health and safety standards.

MetricThis FacilityNY Averagevs. NY Avg
Total inspections Info Combined count of all routine and focused inspections. Excludes complaint investigations. 99 This facility has total inspections in line with the NY average (9 vs. NY avg 9).— At avg
Inspections with citations Info Inspections that resulted in at least one regulatory citation. 45 This facility has 20% fewer inspections with citations than a typical NY nursing home (4 vs. NY avg 5).↓ 20% better
Inspection citation rate Info Percentage of inspections that resulted in at least one citation. 44%56% This facility has 21% fewer inspection citation rate than a typical NY nursing home (44 vs. NY avg 56).↓ 21% better

Complaints & Investigations Info Complaints are formal concerns filed by residents, families, or staff. Investigations are on-site follow-ups.

MetricThis FacilityNY Averagevs. NY Avg
Total complaints Info Formal expressions of concern made by residents, families, or staff. 3679 This facility has 54% fewer total complaints than a typical NY nursing home (36 vs. NY avg 79).↓ 54% better
Complaints per year Info Average complaints per year since 2020. 613.2 This facility has 55% fewer complaints per year than a typical NY nursing home (6 vs. NY avg 13.2).↓ 55% better
Complaints per bed Info Size-adjusted complaint rate based on occupied beds. 0.180.50 This facility has 64% fewer complaints per bed than a typical NY nursing home (0.18 vs. NY avg 0.5).↓ 64% better
Complaint investigations Info On-site investigations triggered by complaints filed with the NY Department of Health. 1215 This facility has 20% fewer complaint investigations than a typical NY nursing home (12 vs. NY avg 15).↓ 20% better

Inspection Reports Summary Info An editor-reviewed summary of the themes and findings across this facility's recent inspection reports.

The most recent inspection on February 3, 2025, found multiple deficiencies including incomplete PASARR screening, inadequate pressure ulcer care, medication storage issues, unsafe food temperatures, and pest control problems. Earlier inspections showed fewer but recurring issues, mainly related to reporting requirements and food safety, with no enforcement actions or fines listed in the available reports. Prior reports also cited deficiencies in resident care areas such as nutrition, respiratory care, and physician supervision, as well as infection control and accident hazard investigations. Complaint investigations were not noted or substantiated in the available records. The pattern suggests ongoing challenges in care planning, food safety, and facility maintenance, with no clear improvement trend over time.

Read the full inspection reports for this facility, including detailed findings and corrective actions.

Show Inspection Reports

Health Inspection History

Inspections
Total health inspections 3

New York average 3.6


Last Health inspection on Feb 2025

Total health citations
15 Rank #146 / 353Health citations — state benchmarkedThis home is ranked 146th out of 353 homes in New York.Shows this facility's total health deficiency citations benchmarked to the New York state average, with a ranking across all 353 NY SNFs. Lower citation counts earn a better rank.

New York average 18.5

Citations per inspection
5 Rank #188 / 353Citations per inspection — state benchmarkedThis home is ranked 188th out of 353 homes in New York.Shows average deficiency citations per CMS inspection for this facility versus the New York mean across 353 SNFs with citation data. Lower is better.

New York average 5.05


Health citations are formal notices following inspections when they fail to comply with safety and care standards.

All 15 citations resulted from standard inspections.

Breakdown of citation severity (last 3 years)
Critical Health citations More info
0
100% better than New York average

New York average: 0.2


Serious Health citations More info 0
100% better than New York average

New York average: 0.2

0 critical citations More info New York average: 0.2

0 serious citations More info New York average: 0.2

14 moderate citations More info New York average: 17.4

1 minor citation More info New York average: 0.7
Citations history (last 3 years)
Administration minor citation Info Issues related to how the facility is managed, including policies, procedures, and compliance with regulations. Feb 03, 2025
Corrected

Environmental moderate citation Info Issues related to building safety, cleanliness, maintenance, and overall living conditions. Feb 03, 2025
Corrected

Nutrition moderate citation Info Issues related to food quality, meal service, and resident's nutritional needs. Feb 03, 2025
Corrected

Nutrition moderate citation Info Issues related to food quality, meal service, and resident's nutritional needs. Feb 03, 2025
Corrected

Financial Assistance for
Nursing Home in New York

Highfield Gardens Care Center is located in Great Neck, New York.
Here are the financial assistance programs available to residents in New York.

Get Financial aid guidance

Community First Choice Option

NY Medicaid CFCO

Age 65+ or disabled
General New York resident, Medicaid- eligible, care need (not necessarily nursing home level).
Income Limits (2025) ~$2,829/month 300% FBR, individual
Asset Limits $30,182 individual, higher due to NY Medicaid expansion
NY

Higher asset limit; urban density increases demand.

Benefits
Personal care (5-7 hours/day) Respite care (240 hours/year) Home modifications ($1,500 avg.) Assistive technology ($500 avg.)

Expanded In-Home Services for the Elderly Program (EISEP)

NY EISEP

Age 60+
General New York resident, at risk of decline but not nursing home level.
Income Limits ~$2,500/month individual, varies
Asset Limits $15,000 individual
NY

Cost-sharing required above certain income; urban/rural balance.

Benefits
In-home care (3-5 hours/week) Respite (up to 10 days/year) Case management Transportation (~5 trips/month)

Senior Citizen Rent Increase Exemption (SCRIE)

NY SCRIE

Age 62+
General NYC resident, live in rent-controlled/stabilized apartment, spend >1/3 of income on rent.
Income Limits (2025) $50,000/year household
Asset Limits No strict asset cap, but income-focused eligibility.
NY

Limited to NYC’s rent-regulated units; high demand in urban areas.

Benefits
Rent freeze (e.g., covers increases of $50-$200+/month); tax credit for landlord

Senior Citizen Homeowners’ Exemption (SCHE)

NY SCHE

Age 65+
General NYC resident, own and live in a 1-3 family home, co-op, or condo.
Income Limits (2025) $58,399/year household
Asset Limits No strict asset cap, income-driven eligibility.
NY

Applies only in NYC; excludes large apartment buildings.

Benefits
Property tax reduction (5-50%, e.g., $500-$5,000/year based on income and property value)

New York Foundation for Senior Citizens (NYFSC) Home Sharing Program

NYFSC Home Sharing

Age One participant must be 60+ (host or guest)
General NYC resident, able to share living space.
Income Limits No strict limit, but targets those needing cost relief.
Asset Limits Not applicable; focus on housing need.
NY

Primarily NYC-focused; limited slots due to demand.

Benefits
Shared housing (reduces rent/living costs by 30-50%, e.g., $500-$1,000/month savings); optional light assistance between housemates

Places of interest near Highfield Gardens Care Center

Address 32.8 miles from city center Info Estimated distance in miles from Great Neck's city center to Highfield Gardens Care Center's address, calculated via Google Maps. — 1.91 miles to nearest hospital (Long Island Jewish Medical Center)

Calculate Travel Distance to Highfield Gardens Care Center

Add your location

Address

Staffing Data (Q2 2025)

This data corresponds to Q2 2025 and is based on CMS Payroll-Based Journal.

Total staff 251
Employees 160
Contractors 91
Staff to resident ratio 1.27:1
623% better than New York average

New York average ratio: 0.18:1

Avg staff/day 125
Average shift 8 hours
0% compared with New York average

New York average: 7.7 hours

Total staff hours (quarter) 91,287
Nursing staff breakdown
Registered Nurse

Manages medical care and health needs.

Total count 36
Average shift length Info Average shift length. Calculated as total hours divided by days worked and average staff per day. 8.8 hours

This role is partially covered by contractors.

Licensed Practical Nurse

Assists with medical care and medications.

Total count 32
Average shift length Info Average shift length. Calculated as total hours divided by days worked and average staff per day. 8.6 hours

This role is partially covered by contractors.

Certified Nursing Assistant

Helps with daily care and mobility.

Total count 118
Average shift length Info Average shift length. Calculated as total hours divided by days worked and average staff per day. 8 hours

This role is partially covered by contractors.

Contractor staffing

Total hours from contractors

26%

23,730 contractor hours this quarter

Certified Nursing Assistant: 37 Licensed Practical Nurse: 22 Other Dietary Services Staff: 8 Respiratory Therapy Technician: 7 Speech Language Pathologist: 6 Physical Therapy Assistant: 5 Registered Nurse: 3 Physical Therapy Aide: 2 Qualified Social Worker: 1
Staff by category
Certified Nursing Assistant813711847,77791100%8
Licensed Practical Nurse10223212,37291100%8.6
Registered Nurse3333611,70891100%8.8
Physical Therapy Aide6283,4487785%8.1
Other Dietary Services Staff28103,41791100%6.8
Speech Language Pathologist66122,6657886%8.1
Respiratory Therapy Technician2792,2668593%8
Occupational Therapy Aide5051,45591100%5
Mental Health Service Worker3031,1866774%7.5
Dental Services Staff4041,1368593%6.9
Other Social Services Staff2026496167%7
Qualified Social Worker1125716571%7.4
Nurse Practitioner1015646369%9
Clinical Nurse Specialist1015206571%8
Administrator1014886571%7.5
Physical Therapy Assistant0554163640%7.4
Dietitian1013905257%7.5
Medical Director1012606571%4
118 Certified Nursing Assistant
% of Days 100%
32 Licensed Practical Nurse
% of Days 100%
36 Registered Nurse
% of Days 100%
8 Physical Therapy Aide
% of Days 85%
10 Other Dietary Services Staff
% of Days 100%
12 Speech Language Pathologist
% of Days 86%
9 Respiratory Therapy Technician
% of Days 93%
5 Occupational Therapy Aide
% of Days 100%
3 Mental Health Service Worker
% of Days 74%
4 Dental Services Staff
% of Days 93%
2 Other Social Services Staff
% of Days 67%
2 Qualified Social Worker
% of Days 71%
1 Nurse Practitioner
% of Days 69%
1 Clinical Nurse Specialist
% of Days 71%
1 Administrator
% of Days 71%
5 Physical Therapy Assistant
% of Days 40%
1 Dietitian
% of Days 57%
1 Medical Director
% of Days 71%

Facility Characteristics

Source: CMS Long-Term Care Facility Characteristics (Data as of Jan 2026)

Total residents 198
Medicare
59
29.8% of residents
Medicaid
113
57.1% of residents
Private pay or other
26
13.1% of residents
Programs & Services
Residents Group

Residents meet regularly to discuss policies, care quality, and activities

Active Resident Council

Organized group of residents that meets regularly to discuss facility policies, quality of life, and activities.

Quality of care over time

These measures show how residents usually do over time at this home, based on health outcomes and preventive care.

High-risk clinical events score Info A composite score based on pressure ulcers, falls with injury, weight loss, walking ability decline, and activities of daily living decline. 7.8
21% better than New York average

New York average: 9.8

Functional decline score Info A composite score based on activities of daily living decline, walking ability decline, and incontinence. 11.1
39% better than New York average

New York average: 18.1

Long-stay resident measures
Significantly above average New York avg: 4.0 Info CMS star rating based on long-stay quality measure performance. 5 stars = significantly above average, 1 star = significantly below average.
Need for Help with Daily Activities Increased Info Percent of long-stay residents whose need for help with daily activities has increased 16.4%
In line with New York average

New York average: 16.4%

Walking Ability Worsened Info Percent of long-stay residents whose ability to move independently worsened 10.9%
34% better than New York average

New York average: 16.6%

Low Risk Residents with Bowel/Bladder Incontinence Info Percent of low risk long-stay residents who lose control of their bowels or bladder 6.1%
72% better than New York average

New York average: 21.4%

Falls with Major Injury Info Percent of long-stay residents experiencing one or more falls with major injury 2.2%
25% better than New York average

New York average: 3.0%

High Risk Residents with Pressure Ulcers Info Percent of long-stay high risk residents with pressure ulcers 4.8%
34% better than New York average

New York average: 7.2%

Urinary Tract Infection Info Percent of long-stay residents with a urinary tract infection 0.0%
100% better than New York average

New York average: 1.4%

Lost Too Much Weight Info Percent of long-stay residents who lose too much weight 4.6%
24% better than New York average

New York average: 6.1%

Depressive Symptoms Info Percent of long-stay residents who have depressive symptoms 0.2%
99% better than New York average

New York average: 18.1%

Antipsychotic Use Info Percent of long-stay residents who received an antipsychotic medication 14.2%
13% worse than New York average

New York average: 12.6%

Pneumococcal Vaccine Info Percent of long-stay residents assessed and appropriately given the pneumococcal vaccine 100.0%
9% better than New York average

New York average: 91.4%

Influenza Vaccine Info Percent of long-stay residents assessed and appropriately given the seasonal influenza vaccine 100.0%
5% better than New York average

New York average: 95.2%

Hospitalizations per 1,000 days Info Number of hospitalizations per 1,000 long-stay resident days. 1.99
16% worse than New York average

New York average: 1.71

ED visits per 1,000 days Info Number of outpatient emergency department visits per 1,000 long-stay resident days. 0.59
56% better than New York average

New York average: 1.35

Short-stay resident measures
Significantly above average New York avg: 3.5 Info CMS star rating based on short-stay quality measure performance. 5 stars = much above average, 1 star = much below average.
Pneumococcal Vaccine Info Percent of short-stay residents assessed and appropriately given the pneumococcal vaccine 99.9%
30% better than New York average

New York average: 76.6%

Antipsychotic medication increase Info Percent of short-stay residents who newly received an antipsychotic medication 2.1%
62% worse than New York average

New York average: 1.3%

Influenza Vaccine Info Percent of short-stay residents assessed and appropriately given the seasonal influenza vaccine 100.0%
27% better than New York average

New York average: 78.8%

Re-hospitalized after SNF stay Info Percentage of short-stay residents who were re-hospitalized after their nursing home admission. 22.7%
10% worse than New York average

New York average: 20.6%

Emergency department visits Info Percentage of short-stay residents who had an outpatient emergency department visit. 6.6%
32% better than New York average

New York average: 9.7%

Falls with major injury Info Percentage of SNF residents who experience falls with major injury during their stay. 1.6%
106% worse than New York average

New York average: 0.8%

Ability to care for self at discharge Info Percentage of residents at or above expected ability to care for themselves at discharge. 63.9%
19% better than New York average

New York average: 53.7%

Successful return to home or community Info Rate of successful return to home or community from a skilled nursing facility. 49.2%
In line with New York average

New York average: 50.6%

Penalties and fines

Federal penalties imposed by CMS for regulatory violations, including civil money penalties (fines) and denials of payment for new Medicare/Medicaid admissions.

Source: CMS Penalties Database (Data as of Jan 2026)

Total fines amount $5K
93% lower than New York average

New York average: $66K

Number of fines 2
In line with New York average

New York average: 2.0

Payment Denials Info Serious action where Medicare and/or Medicaid temporarily stops payments for new residents until issues are fixed. 0
100% fewer payment denials than New York average

New York average: 0.1

Fines amount comparison
This facility $5K
New York average $66K
Penalty History

Penalties are imposed by CMS for violations of federal nursing home regulations.

2 penalties in the past 3 years

Multiple penalties were reported in the last 3 years.

Civil Money Penalty Info Fines imposed for noncompliance, which can be assessed per day or per instance of violation. Oct 10, 2023
$2K
Civil Money Penalty Info Fines imposed for noncompliance, which can be assessed per day or per instance of violation. Sep 18, 2023
$3K

Last updated: Jan 2026

Compare Nursing Home around Long Island The information below is reported by the New York State Department of Health.

2 facilities compared · CMS & NY Dept. of Health data · Updated Apr 2026

Filter by care type
Meadowbrook Care Center
NH

Nursing Home Licensed facility providing 24/7 skilled nursing care for residents with complex, ongoing medical needs. Staffed by RNs, LPNs, and CNAs. Inspected and star-rated annually by CMS. Accepts Medicare (short-term rehab) and Medicaid (long-term care).

AL

Assisted Living A licensed, long-term care setting for seniors or individuals with disabilities who need help with daily activities — like bathing, dressing, and medication management — but not 24-hour skilled nursing. Offers housing, meals, and around-the-clock support while aiming to maximize resident independence.

Freeport (West Merrick Road)280 91.5% +4%3.09 +41%-14%0134.30260 75 Berkowitz, Dov$46.7M$20.4M43.7%335796
Highfield Gardens Care Center
NH

Nursing Home Licensed facility providing 24/7 skilled nursing care for residents with complex, ongoing medical needs. Staffed by RNs, LPNs, and CNAs. Inspected and star-rated annually by CMS. Accepts Medicare (short-term rehab) and Medicaid (long-term care).

AL

Assisted Living A licensed, long-term care setting for seniors or individuals with disabilities who need help with daily activities — like bathing, dressing, and medication management — but not 24-hour skilled nursing. Offers housing, meals, and around-the-clock support while aiming to maximize resident independence.

MC

Memory Care Secured, specialized care for people living with Alzheimer's or dementia. Staff trained in cognitive impairment, with higher staff-to-resident ratios and an environment designed to reduce confusion and wandering risk.

Great Neck (Spinney Hill Homes)200 98.0% +11%3.87 +15%+8%2155.00198 55 Bleier, Sorah$38.9M$11.8M30.3%335250

Guides for Better Senior Living

Care Cost Calculator: See Prices in Your Area

Nursing Home Data Explorer

Don’t Wait Too Long: 7 Red Flag Signs Your Parent Needs Assisted Living Now

The True Cost of Assisted Living in 2025 – And How Families Are Paying For It

Understanding Senior Living Costs: Pricing Models, Discounts & Financial Assistance

Explore Open Rooms
1 Contact details
2 What type of senior care service are you looking for?
3 What budget do you have in mind for senior care?
4 How soon do you need to find care?
5 Additional details

Thank you for your interest!

Our team will be in touch shortly to help with next steps.