Highland Manor Assisted Living
Assisted Living · Lynwood, CA
CMS overall rating Info The Overall CMS Rating is scored from 1 to 5 stars and combines results from health inspections, staffing levels, and quality measures. Health inspections carry the most weight. Staffing and quality scores can increase or decrease the final rating based on performance compared to state and national standards.

Highland Manor Assisted Living

Assisted Living · Lynwood, CA
CMS overall rating Info The Overall CMS Rating is scored from 1 to 5 stars and combines results from health inspections, staffing levels, and quality measures. Health inspections carry the most weight. Staffing and quality scores can increase or decrease the final rating based on performance compared to state and national standards.
Calculator: See prices in your area
Highland Manor Assisted Living accepts Medicare, Medicaid, and private pay.

Overview of Highland Manor Assisted Living

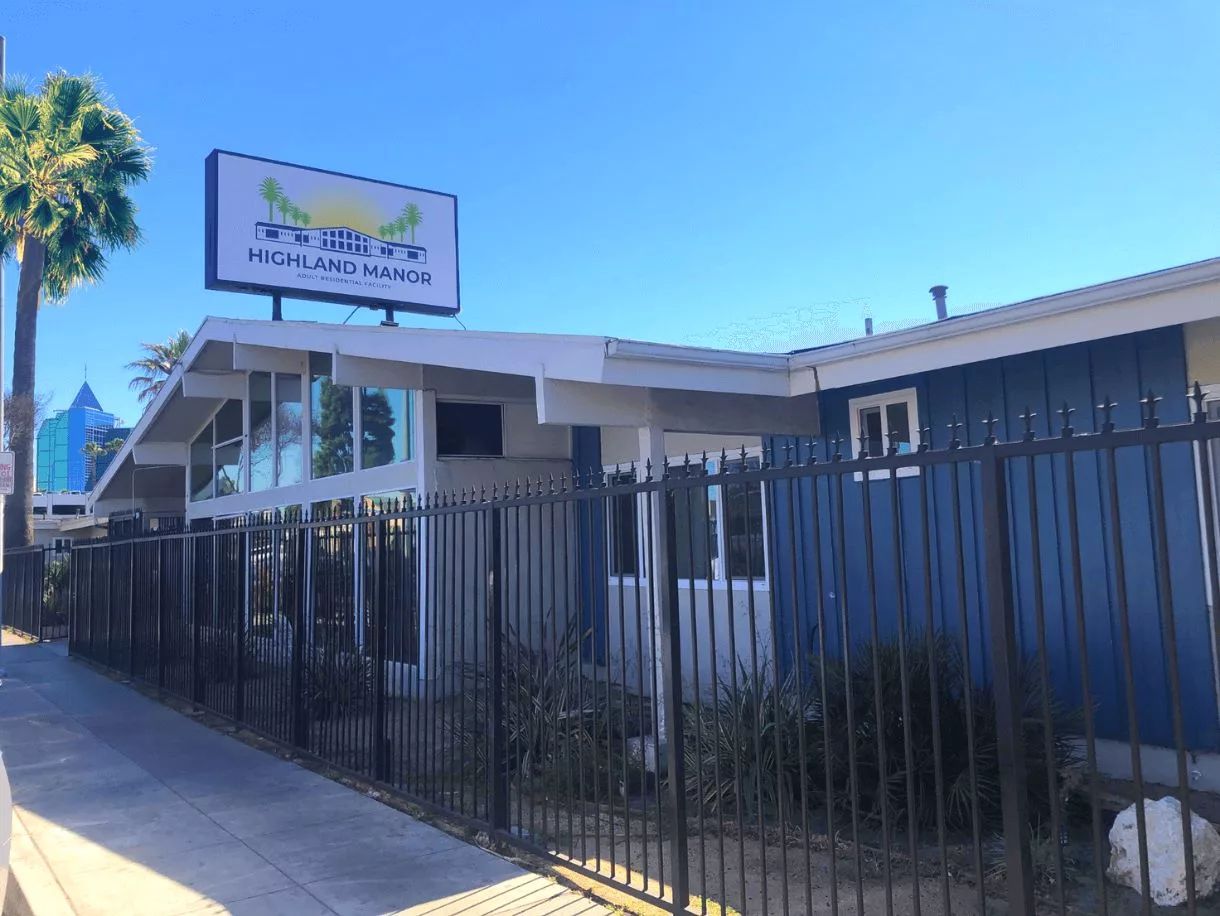
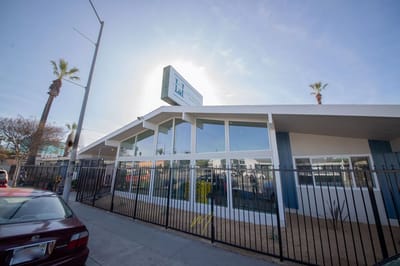
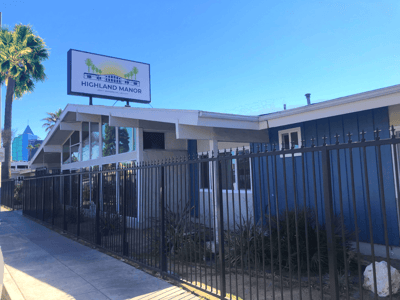
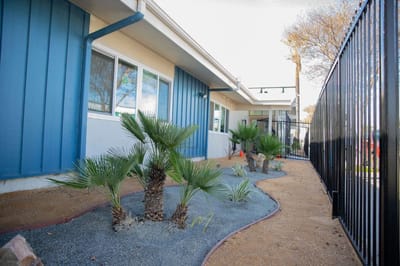
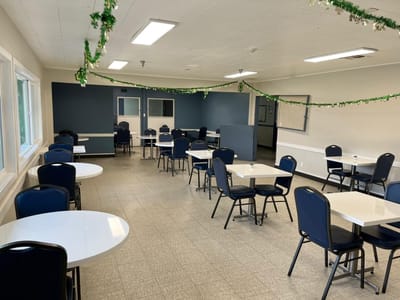
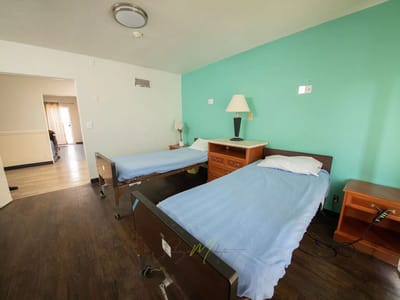
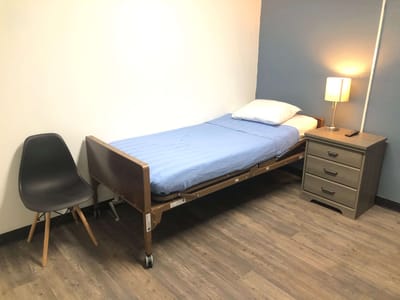
Ranked as one of the trusted assisted living homes for seniors in Los Angeles, Highland Manor is a cozy, comfortable, and inviting community. The vibrant environment encourages residents to build an active and freeing lifestyle. Boasting a top-notch healthcare service, the professional care staff is built on a solid senior care foundation.

Highland Manor is committed to delivering world-class services with respect and dignity provided 24/7. Many will find an enhanced day-to-day living experience beneficial to health and wellness, recovery journey, and individual growth; life enrichment programs, social activities, and emotional support services.

Quality ratings

Measured by Centers for Medicare & Medicaid Services (CMS)

Overall rating Info The Overall CMS Rating combines results from health inspections, staffing levels and quality measures. Health inspections carry the most weight. Staffing and quality scores can increase or decrease the final rating based on performance compared to state and national standards.
▼ 36.5% Below CA avg. ▼ 36.5% Below CA avg.Click the badge to see the full State ranking.Click here to see the full State ranking.
Health Inspection Info Based on the results of the facility's three most recent standard inspections and any complaint investigations. CMS reviews the number, scope, and severity of deficiencies, with more recent findings weighted more heavily.
▲ 7.3% Above CA avg. ▲ 7.3% Above CA avg.Click the badge to see the full State ranking.Click here to see the full State ranking.
Staffing Info Measures average nursing staff hours per resident per day, including Registered Nurses (RNs) and total nursing staff. Ratings are adjusted based on the level of care residents require and are compared to state and national benchmarks.
▼ 36.3% Below CA avg. ▼ 36.3% Below CA avg.Click the badge to see the full State ranking.Click here to see the full State ranking.
Quality Measures Info Based on clinical and physical health indicators reported to CMS, such as hospital readmissions, falls, pressure ulcers, and improvements in mobility. These measures reflect how well residents' health needs are being managed.
▼ 75.5% Below CA avg. ▼ 75.5% Below CA avg.Click the badge to see the full State ranking.Click here to see the full State ranking.

Staffing hours breakdown

Info Daily nursing hours per resident by staff type, reported to CMS. Higher is generally better — compare this facility to state and national averages to see where staffing stands.

Hours per resident per day — compared to California state averages

Total nursing care / resident Info This home is ranked 263rd out of 346 homes in California. Total adjusted nursing hours per resident per day, combining RN, LPN, and aide time. CMS adjusts this for case-mix so facilities can be fairly compared.
3h 37m per day
Rank #263 / 346Nurse hours — State benchmarkedThis home is ranked 263rd out of 346 homes in California. Shows adjusted nurse hours per resident per day benchmarked to the California average, with a ranking across 346 California SNFs. More hours mean more direct care. The national average is about 3.5 hrs; below 3.0 is a red flag.Click the rank badge to see the full State ranking.Click here to see the full State ranking.
This facility California avg (4h 13m per day)
vs California avg
-14%

1 of 1 metrics below state avg

Staff typeHours / Day / Residentvs state avg
Weekend Total Nursing Info Combined nursing hours (RN + LPN + Nurse Aide) per resident per day on weekends. Staffing often drops on weekends — this figure reveals whether the facility maintains adequate coverage outside of weekday hours. 3h 46m per day ▼ 8% State avg: 4h 4m per day · National avg: 3h 25m per day

Capacity and availability

This home usually has limited availability

Higher occupancy than the California average: 84.7%
Occupancy rate
88.2% Rank #359 / 1407Occupancy rate — State benchmarkedThis home is ranked 359th out of 1407 homes in California. Shows this facility's occupancy rate versus the California average, with its Statewide rank out of 1407. Higher occupancy signals strong local demand and financial stability.Click the rank badge to see the full State ranking.Click here to see the full State ranking.
Avg. Length of Stay
177 days
Walk Score
Walk Score: 85 / 100 Rank #290 / 2093Walk Score — State benchmarkedThis home is ranked 290th out of 2093 homes in California. Shows how walkable this facility's neighborhood is compared to the average Walk Score across California SNFs. Higher scores benefit residents, families, and staff.Click the rank badge to see the full State ranking.Click here to see the full State ranking.
Very walkable. Most errands can be accomplished on foot, and many essentials are within a short walk.

About this community

License Details

RCFE Number191500823

Safety & Compliance

Emergency SystemsEmergency Call System

Staffing & Medical

2 services
Licensed Nurses/CNAs
24-Hour Staffing

Additional Policies & Features

Minimum Age18
HousekeepingYes
Linen ServiceYes

Amenities & Lifestyle

3 Nutritious Meals Served Daily
Snacks And Hydration Offered 24/7
Complimentary Tv
Complimentary High Speed Wi-Fi
Housekeeping
Linen Service
Scheduled Transportation
Religious Services
Laundry Service
24-Hour Care Staff
Enrichment Programs
Engagement Programs
Nurse On Staff
Private Courtyard
ActivitiesResidents can take part in group outings, classes, exercise, and special events.
Specific ProgramsAdult Residential Facility
Religious ServicesYes

Dining & Nutrition

Food DescriptionResidents enjoy a variety of dishes that balance taste and nutrition, all served in a welcoming dining room.

Contact Highland Manor Assisted Living

Staffing Data

Reporting period: October 1 – December 31, 2025 (Q4 2025). Source: CMS Payroll-Based Journal report.

Total staff 152
Employees 113
Contractors 39
Staff to resident ratio 1.63:1
10% worse than California average
California average ratio: 1.81:1 California average ratio: 1.81:1See full California ranking
Avg staff/day 65
Average shift 7.3 hours
5% worse than California average
California average: 7.7 hours California average shift: 7.7 hoursSee full California ranking
Total staff hours (quarter) 43,823

Nursing staff breakdown

Q4 2025 · Oct 1 – Dec 31 More info This data comes from the CMS Payroll-Based Journal report covering October 1 – December 31, 2025.
Registered Nurse

Manages medical care and health needs.

RN Staff Info 14 total: 13 full-time employees and 1 contractor. 14
Average shift length Info Average shift length. Calculated as total hours divided by days worked and average staff per day. 6.6 hours
Licensed Practical Nurse

Assists with medical care and medications.

LPN Staff Info 32 total: 31 full-time employees and 1 contractor. 32
Average shift length Info Average shift length. Calculated as total hours divided by days worked and average staff per day. 7.6 hours
Certified Nursing Assistant

Helps with daily care and mobility.

CNA Staff Info 63 total: 58 full-time employees and 5 contractors. 63
Average shift length Info Average shift length. Calculated as total hours divided by days worked and average staff per day. 7.4 hours

Contractor staffing

Q4 2025 · Oct 1 – Dec 31 More info This data comes from the CMS Payroll-Based Journal report covering October 1 – December 31, 2025.

Total hours from contractors

15.9%

6,948 contractor hours this quarter

Physical Therapy Aide: 8 Speech Language Pathologist: 6 Certified Nursing Assistant: 5 Physical Therapy Assistant: 4 Qualified Social Worker: 3 Therapeutic Recreation Specialist: 3 Respiratory Therapy Technician: 3 Occupational Therapy Aide: 2 Registered Nurse: 1 Licensed Practical Nurse: 1 Occupational Therapy Assistant: 1 Medical Director: 1 Feeding Assistant: 1

Staff by category

Q4 2025 · Oct 1 – Dec 31 More info This data comes from the CMS Payroll-Based Journal report covering October 1 – December 31, 2025.
Certified Nursing Assistant5856321,21292100%7.4
Licensed Practical Nurse311329,62492100%7.6
Registered Nurse131142,31692100%6.6
Physical Therapy Aide0881,6097986%7
Other Dietary Services Staff3031,44892100%7.9
Respiratory Therapy Technician0331,2529098%8.8
Speech Language Pathologist0661,2447885%6.5
Physical Therapy Assistant0448797885%5.7
RN Director of Nursing2028326470%8
Dental Services Staff3037076874%7.6
Therapeutic Recreation Specialist0336576470%5.4
Nurse Practitioner1015206571%8
Administrator1015126470%8
Dietitian1014565762%8
Qualified Social Worker0332824347%6.2
Occupational Therapy Aide0221552426%5.5
Feeding Assistant0114867%8
Occupational Therapy Assistant0114867%8
Medical Director0112489%3
63 Certified Nursing Assistant
% of Days 100%
32 Licensed Practical Nurse
% of Days 100%
14 Registered Nurse
% of Days 100%
8 Physical Therapy Aide
% of Days 86%
3 Other Dietary Services Staff
% of Days 100%
3 Respiratory Therapy Technician
% of Days 98%
6 Speech Language Pathologist
% of Days 85%
4 Physical Therapy Assistant
% of Days 85%
2 RN Director of Nursing
% of Days 70%
3 Dental Services Staff
% of Days 74%
3 Therapeutic Recreation Specialist
% of Days 70%
1 Nurse Practitioner
% of Days 71%
1 Administrator
% of Days 70%
1 Dietitian
% of Days 62%
3 Qualified Social Worker
% of Days 47%
2 Occupational Therapy Aide
% of Days 26%
1 Feeding Assistant
% of Days 7%
1 Occupational Therapy Assistant
% of Days 7%
1 Medical Director
% of Days 9%

Penalties and fines

Federal penalties imposed by CMS for regulatory violations, including civil money penalties (fines) and denials of payment for new Medicare/Medicaid admissions.

Source: CMS Penalties Database

No penalties in the past 3 years

No civil money penalties or payment denials were reported in the last 3 years.

Quality of care over time

These measures show how residents usually do over time at this home, based on health outcomes and preventive care.

High-risk clinical events score Info A composite score based on pressure ulcers, falls with injury, weight loss, walking ability decline, and activities of daily living decline. 12.9
94% worse than California average

California average: 6.6

Functional decline score Info A composite score based on activities of daily living decline, walking ability decline, and incontinence. 19.7
74% worse than California average

California average: 11.3

Long-stay resident measures
Need for Help with Daily Activities Increased Info Percent of long-stay residents whose need for help with daily activities has increased 29.4%
166% worse than California average

California average: 11.1%

Walking Ability Worsened Info Percent of long-stay residents whose ability to move independently worsened 22.6%
88% worse than California average

California average: 12.0%

Low Risk Residents with Bowel/Bladder Incontinence Info Percent of low risk long-stay residents who lose control of their bowels or bladder 7.0%
38% better than California average

California average: 11.3%

Falls with Major Injury Info Percent of long-stay residents experiencing one or more falls with major injury 2.2%
31% worse than California average

California average: 1.7%

High Risk Residents with Pressure Ulcers Info Percent of long-stay high risk residents with pressure ulcers 5.7%
14% worse than California average

California average: 5.0%

Urinary Tract Infection Info Percent of long-stay residents with a urinary tract infection 4.1%
227% worse than California average

California average: 1.2%

Lost Too Much Weight Info Percent of long-stay residents who lose too much weight 4.6%
9% worse than California average

California average: 4.2%

Depressive Symptoms Info Percent of long-stay residents who have depressive symptoms 17.7%
164% worse than California average

California average: 6.7%

Antipsychotic Use Info Percent of long-stay residents who received an antipsychotic medication 17.1%
69% worse than California average

California average: 10.1%

Pneumococcal Vaccine Info Percent of long-stay residents assessed and appropriately given the pneumococcal vaccine 100.0%
In line with California average

California average: 98.5%

Influenza Vaccine Info Percent of long-stay residents assessed and appropriately given the seasonal influenza vaccine 98.9%
In line with California average

California average: 98.2%

Short-stay resident measures
Pneumococcal Vaccine Info Percent of short-stay residents assessed and appropriately given the pneumococcal vaccine 100.0%
6% better than California average

California average: 94.0%

Antipsychotic medication increase Info Percent of short-stay residents who newly received an antipsychotic medication 4.5%
210% worse than California average

California average: 1.5%

Influenza Vaccine Info Percent of short-stay residents assessed and appropriately given the seasonal influenza vaccine 84.1%
10% worse than California average

California average: 93.2%

Breakdown by payment type

Medicare

50% of new residents, usually for short-term rehab.

Typical stay 1 - 2 months

Private pay

44% of new residents, often for short stays.

Typical stay 1 months

Medicaid

6% of new residents, often for long-term daily care.

Typical stay 4 years

Facility Characteristics

Source: CMS Long-Term Care Facility Characteristics (Data as of Jan 2026)

Total residents 93
Medicare
50
53.8% of residents
Medicaid
42
45.2% of residents
Private pay or other
1
1.1% of residents
Programs & Services
Residents Group

Residents meet regularly to discuss policies, care quality, and activities

Nurse Aide Training

State-approved Nurse Aide Training and Competency Evaluation Program on-site

Active Resident Council

Organized group of residents that meets regularly to discuss facility policies, quality of life, and activities.

Finances and operations

Privately-owned community
Home revenue
$22.5M
Profit
$418.6K
Privately-owned community
Home revenue
$22.5M Rank #111 / 347Revenue — State benchmarkedThis home is ranked 111th out of 347 homes in California. Shows this facility's annual revenue compared to the California SNF average. Higher revenue generally means more resources for staffing and capital — read alongside Payroll %.Click the rank badge to see the full State ranking.Click here to see the full State ranking.
Profit
$418.6K
Payroll costs Info The portion of the home's budget spent on staff, including nurses, caregivers, and other employees who support care and operations. Rank #205 / 347Payroll — State benchmarkedThis home is ranked 205th out of 347 homes in California. Shows total annual staff payroll benchmarked to the California average. Higher payroll investment relative to peers often signals better staffing and less reliance on cheaper contract labor.Click the rank badge to see the full State ranking.Click here to see the full State ranking.
$7.7M
34.4% of revenue Rank #318 / 347Payroll % — State benchmarkedThis home is ranked 318th out of 347 homes in California. Shows payroll as a percentage of revenue versus the California average. Well-run California SNFs typically land around 56–67% — the top third Statewide. Below 25% may signal understaffing or heavy agency use — read with Staffing ratings.Click the rank badge to see the full State ranking.Click here to see the full State ranking.
Other operating costs Info All remaining costs needed to run the home, such as food, utilities, building maintenance, supplies and administrative expenses.
$14.4M
Total costs $22.1M

What does this home offer?

Minimum age icon
Minimum age icon

Minimum Age: 55 Years Old

Housing options icon

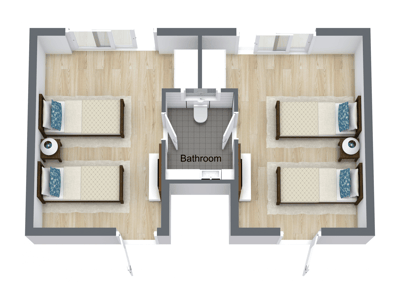
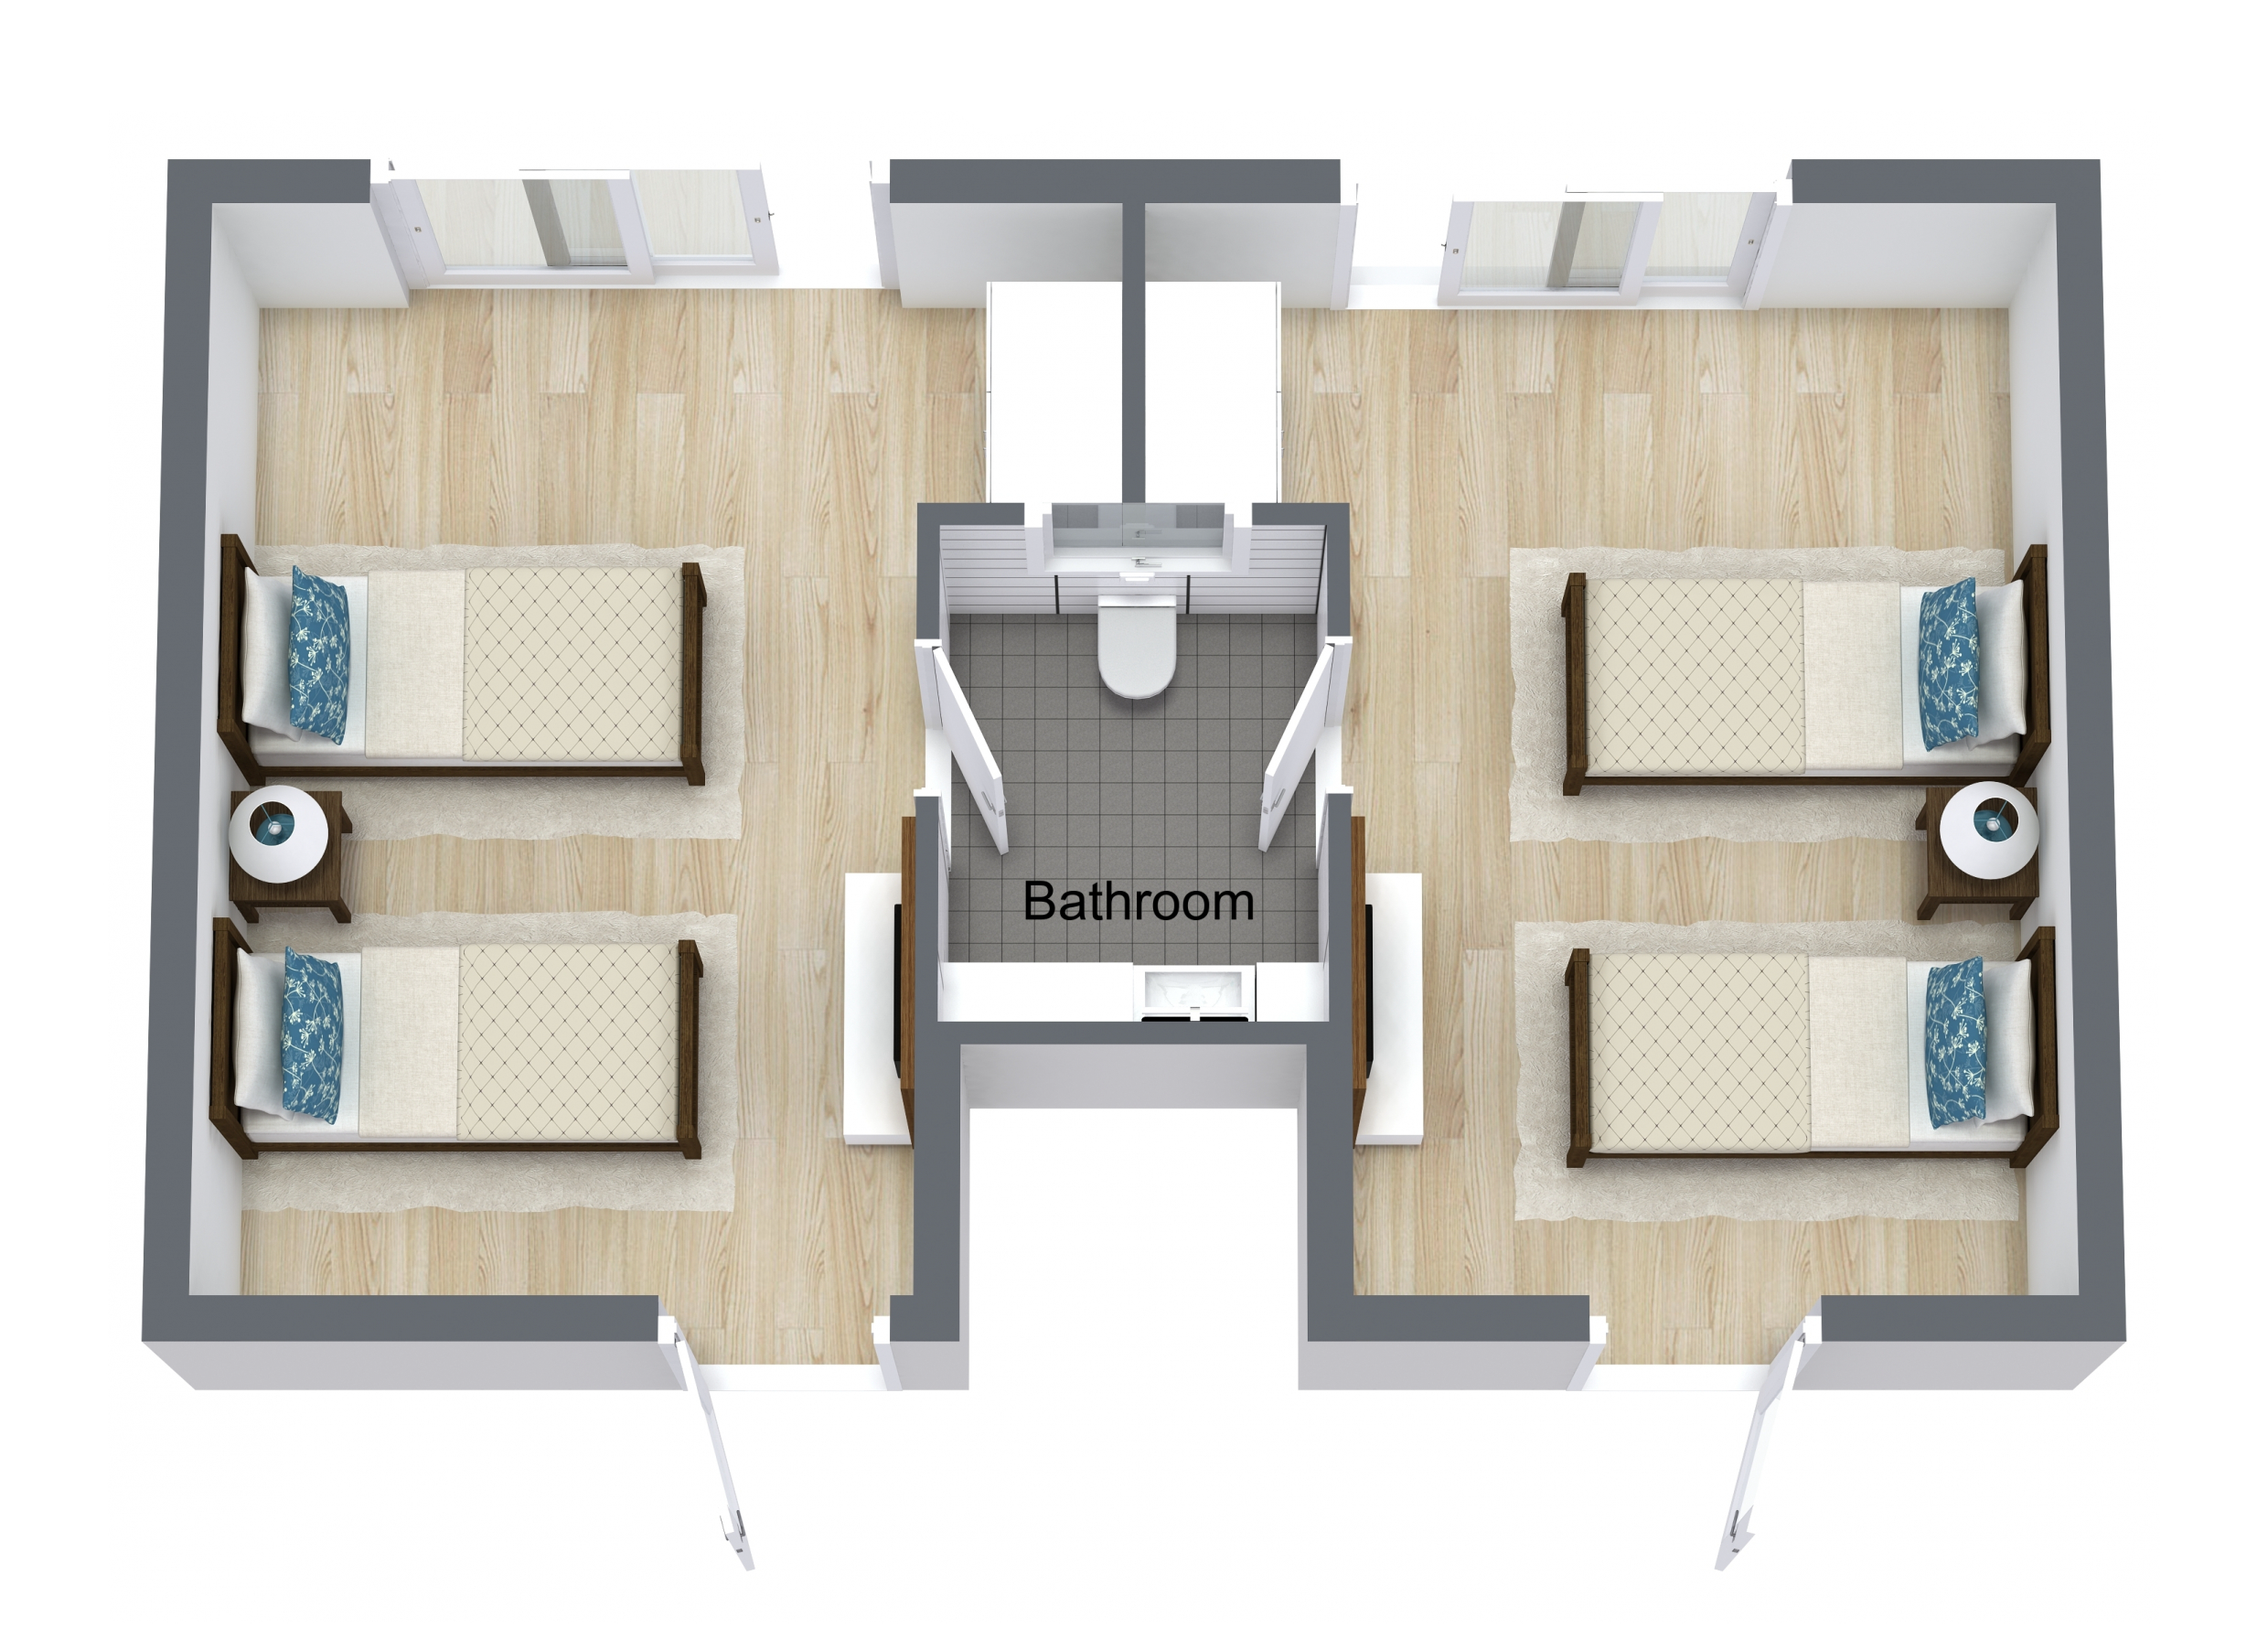
Housing Options: 1 Bed / 2 Bed

Building type icon
Building type icon

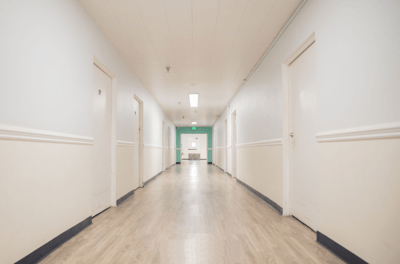
Building Type: Single-story

Fitness and recreation icon

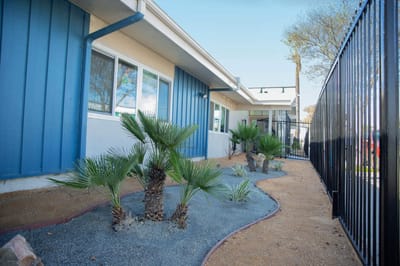
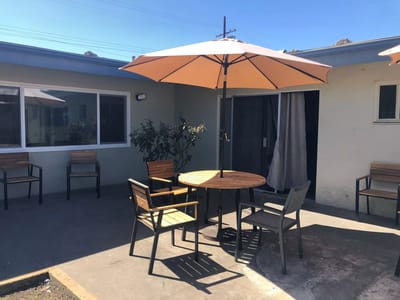
Fitness and Recreation

Who this home usually serves

TYPE OF STAY

Mostly short-term rehab stays

Most residents typically stay for a few weeks or months before returning home or moving on.

Living Spaces & Floor Plans for Highland Manor Assisted Living

Architectural floor plan of shared resident room
Highland Manor Room Floor Plan

Places of interest near Highland Manor Assisted Living

Address 13.5 miles from city center Info Estimated distance in miles from Lynwood's city center to Highland Manor Assisted Living's address, calculated via Google Maps. — 4.51 miles to nearest hospital (Kaiser Permanente Downey Medical Center)

Calculate Travel Distance to Highland Manor Assisted Living

Add your location

Address

Financial Assistance for
Assisted Living in California

Highland Manor Assisted Living is located in Lynwood, California.
Here are the financial assistance programs available to residents in California.

Get Financial aid guidance

Multipurpose Senior Services Program

MSSP (Medi-Cal Waiver)

Age 65+
General California resident, Medi-Cal eligible, nursing home risk.
Income Limits (2025) ~$2,829/month 300% FBR, individual
Asset Limits $2,000 (individual), $3,000 (couple).
CA

County-managed; waitlists possible.

Benefits
In-home support (4-6 hours/day) Respite care (14 days/year) Meals (~$6/meal) Transportation (8 trips/month) Care management

In-Home Supportive Services (IHSS)

California IHSS

Age 65+
General California resident, Medicaid-eligible or low-income.
Income Limits ~$1,732/month individual, Medi-Cal threshold
Asset Limits $2,000 individual
CA

Can hire family as caregivers.

Benefits
Personal care (up to 283 hours/month) Homemaker services Respite (varies)

Multipurpose Senior Services Program (MSSP)

CA MSSP

Age 65+
General California resident, Medi-Cal-eligible, nursing home-eligible but community-capable.
Income Limits ~$2,829/month 300% FBR, individual
Asset Limits $2,000 individual
CA

Available in 38 counties; waitlists common.

Benefits
Case management Respite care (up to 10 days/year) Minor home mods (avg. $500) Adult day care (~$50/day)

Property Tax Postponement Program (PTP)

CA PTP

Age 62+
General California resident, own and live in home, 40% equity.
Income Limits (2025) ~$51,500/year household, adjusted annually
Asset Limits Equity-based; no strict asset cap.
CA

Deferred taxes accrue interest (5% as of 2024); repaid upon sale/death.

Benefits
Property tax deferral (avg. $1,000-$3,000/year, varies by county)

Assisted Living Waiver (ALW)

CA ALW

Age 65+ or disabled
General California resident, Medi-Cal-eligible, nursing home-eligible.
Income Limits ~$2,829/month 300% FBR, individual
Asset Limits $2,000 individual
CA

Available in 15 counties (e.g., LA, Sacramento); waitlists common.

Benefits
Personal care in ALFs (5-7 hours/day) Medication management Social services

California CARES Program

CA CARES

Age
General Caregivers of California residents 60+ needing help with 3+ daily activities; no caregiver age limit.
Income Limits No strict limit; cost-sharing above ~$2,500/month threshold.
Asset Limits Not applicable; need-based.
CA

High demand in urban areas; complements IHSS respite.

Benefits
Respite care (up to 10 days/year) Counseling (4-6 sessions/year) Training (2-3 workshops/year) Supplies (~$200/year)

Frequently Asked Questions about Highland Manor Assisted Living

Is Highland Manor Assisted Living in a walkable area?

Highland Manor Assisted Living has a walk score of 85. Very walkable. Most errands can be accomplished on foot, and many essentials are within a short walk.

Does Highland Manor Assisted Living have different floorplan options?

Yes — see the floorplan options available at Highland Manor Assisted Living on this page.

Are there photos of Highland Manor Assisted Living?

Yes — there are 13 photos of Highland Manor Assisted Living in the photo gallery on this page.

What is the address of Highland Manor Assisted Living?

Highland Manor Assisted Living is located at 3570 E Imperial Hwy, Lynwood, CA 90262, United States.

What is the phone number of Highland Manor Assisted Living?

(323) 955-1000 will put you in contact with the team at Highland Manor Assisted Living.

Is Highland Manor Assisted Living Medicare or Medicaid certified?

Yes — Highland Manor Assisted Living is a CMS-certified provider of Medicare and Medicaid.

Guides for Better Senior Living

Care Cost Calculator: See Prices in Your Area

Nursing Home Data Explorer

Don’t Wait Too Long: 7 Red Flag Signs Your Parent Needs Assisted Living Now

The True Cost of Assisted Living in 2025 – And How Families Are Paying For It

Understanding Senior Living Costs: Pricing Models, Discounts & Financial Assistance

Explore Open Rooms
1 Contact details
2 What type of senior care service are you looking for?
3 What budget do you have in mind for senior care?
4 How soon do you need to find care?
5 Additional details

Thank you for your interest!

Our team will be in touch shortly to help with next steps.