Explore Open Rooms
1 Contact details
2 What type of senior care service are you looking for?
3 What budget do you have in mind for senior care?
4 How soon do you need to find care?
5 Additional details

Thank you for your interest!

Our team will be in touch shortly to help with next steps.

Nursing Home in Worcester

CMS overall rating Info The Overall CMS Rating combines results from health inspections, staffing levels and quality measures. Health inspections carry the most weight. Staffing and quality scores can increase or decrease the final rating based on performance compared to state and national standards.

Holy Trinity Nursing and Rehabilitation Center

Overview of Holy Trinity Nursing and Rehabilitation Center

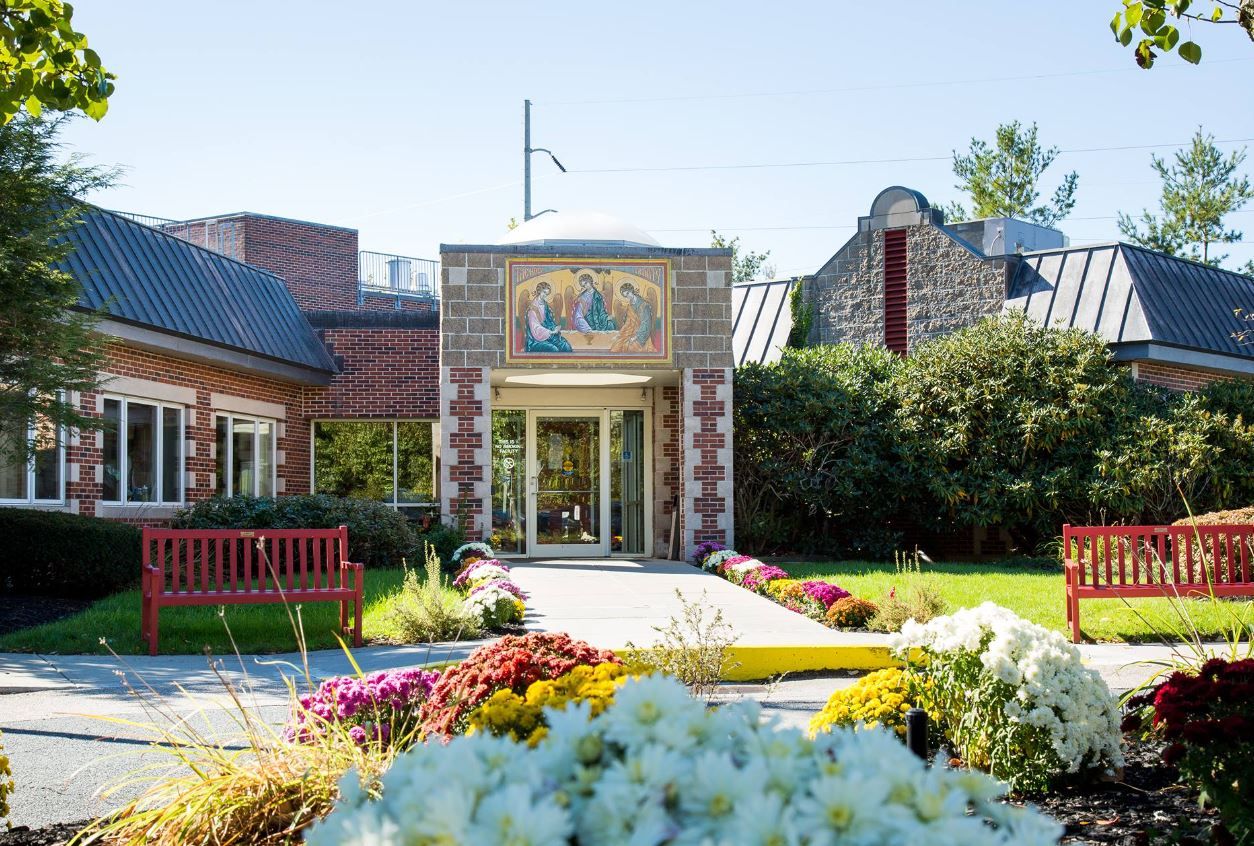
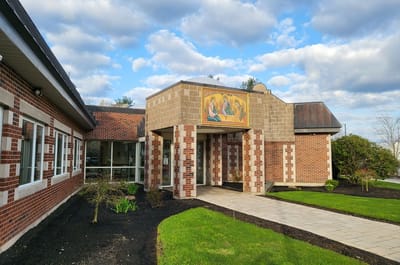
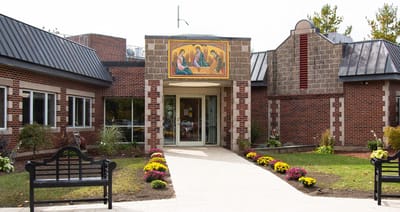
Holy Trinity Nursing and Rehabilitation Center is a warm and inviting senior living facility located in Worcester. Their compassionate and skilled staff provide exceptional long-term care and rehabilitation services to help seniors regain their independence and improve their quality of life. They offer state-of-the-art equipment and a spacious gym for rehabilitation services, with staff trained in various techniques such as diathermy, ultrasound, and massage therapy to help improve strength, control edema, and much more.

In addition to their rehabilitation services, Holy Trinity Nursing and Rehabilitation Center also provides medical management and assistance with daily living for long-term care residents. They offer on-site services such as podiatry, optometry, audiology, and dental care, as well as respite care for those who need short-term care in a safe and supportive community setting. Moreover, the center provides counseling and therapy for emotional support, including post-traumatic stress disorder management, to help residents cope with any challenges they may face. Their pharmacy services and dietary therapy also contribute significantly to the overall well-being of residents. With Holy Trinity Nursing and Rehabilitation Center, seniors can rest easy knowing that they are in the best possible hands.

(508) 852-1000

Managed by Rodolfo A. Parra

CEO and Administrator

Over 15 years of experience

Rodolfo A. Parra serves as CEO and Administrator at Holy Trinity Nursing and Rehabilitation Center. With over 15 years of executive experience in healthcare and senior living, he has led multiple nursing homes and senior communities. Rodolfo holds a bachelor’s degree in International Relations and Economics and is committed to making a positive difference in the lives of older adults every day.

Quality ratings

Measured by Centers for Medicare & Medicaid Services (CMS)

Overall rating Info The Overall CMS Rating combines results from health inspections, staffing levels and quality measures. Health inspections carry the most weight. Staffing and quality scores can increase or decrease the final rating based on performance compared to state and national standards.
4/5
Massachusetts average: 2.9/5
Health Inspection Info Based on the results of the facility's three most recent standard inspections and any complaint investigations. CMS reviews the number, scope, and severity of deficiencies, with more recent findings weighted more heavily.
4/5
Massachusetts average: 2.8/5
Staffing Info Measures average nursing staff hours per resident per day, including Registered Nurses (RNs) and total nursing staff. Ratings are adjusted based on the level of care residents require and are compared to state and national benchmarks.
3/5
Massachusetts average: 3.0/5
Quality Measures Info Based on clinical and physical health indicators reported to CMS, such as hospital readmissions, falls, pressure ulcers, and improvements in mobility. These measures reflect how well residents' health needs are being managed.
3/5
Massachusetts average: 3.2/5

Nursing care per resident

Info This shows how many total hours of nursing staff time are available per resident each day. Higher numbers usually mean more staff support.
3h 58m per day

This home provides 1% more nursing time per resident than the Massachusetts average.

Massachusetts average: 3h 56m per day

Staffing hours breakdown

Info Hours of care per resident per day, broken down by staff type. Data from CMS Medicare.
Staff type Facility State avg National avg
Registered Nurse (RN) Info Registered nurse hours per resident per day. 18m per day 39m per day 41m per day
Nurse Aide Info Nurse aide hours per resident per day. 2h 13m per day 2h 16m per day 2h 21m per day
Total Nursing (Weekend) Info Total number of nurse staff hours per resident per day on weekends. 3h 33m per day 3h 27m per day 3h 26m per day
Physical Therapist Info Physical therapist staff hours per resident per day. 3m per day 4m per day 4m per day
RN (Weekend) Info Registered nurse hours per resident per day on weekends. 16m per day 28m per day 29m per day

Capacity and availability

Medium-capacity home

Offers a balance of services and community atmosphere.

Total beds 113

This home usually has limited availability

Occupancy is moderate, suggesting balanced demand.

Similar demand to the Massachusetts average
Occupancy rate 85%
Residents per day (avg) 106
Occupancy rate
85%
Residents per day (avg)
106

Who this home usually serves

TYPE OF STAY

Mostly long-term care residents

Most residents stay for extended periods and receive ongoing daily care.

Might be optimal for
Long-term daily care Ongoing support needs

Breakdown by payment type

Medicare

29% of new residents, usually for short-term rehab.

Typical stay 8 days

Private pay

35% of new residents, often for short stays.

Typical stay 27 days

Medicaid

36% of new residents, often for long-term daily care.

Typical stay 25 days

Finances and operations

Voluntary non-profit community
Home revenue
$18.7M
Surplus of revenue
$89.9K
Voluntary non-profit community
Home revenue
$18.7M
Surplus of revenue
$89.9K
Payroll costs Info The portion of the home's budget spent on staff, including nurses, caregivers, and other employees who support care and operations.
$8.1M
43.3% of revenue
Other operating costs Info All remaining costs needed to run the home, such as food, utilities, building maintenance, supplies and administrative expenses.
$12.4M
Total costs $20.5M

Types of Care at Holy Trinity Nursing and Rehabilitation Center

Skilled Nursing Assisted Living

Contact Holy Trinity Nursing and Rehabilitation Center

Health Inspection History

Inspections
Total health inspections 3

Massachusetts average 4.5


Last Health inspection on Sep 2024

Total health citations 10

Massachusetts average 32.7

Citations per inspection
3.33

Massachusetts average 7.24


Health citations are formal notices following inspections when they fail to comply with safety and care standards.

8 of 10 citations resulted from standard inspections; and 2 of 10 resulted from complaint investigations.

Breakdown of citation severity (last 3 years)
Critical Health citations More info 0
100% better than Massachusetts average

Massachusetts average: 0.3


Serious Health citations More info 2
33% worse than Massachusetts average

Massachusetts average: 1.5

0 critical citations More info Massachusetts average: 0.3

2 serious citations More info Massachusetts average: 1.5

8 moderate citations More info Massachusetts average: 29.7

0 minor citations More info Massachusetts average: 1.3
Citations history (last 3 years)
Care Planning moderate citation Info Issues related to creating and updating personalized care plans for residents based on their needs and conditions. Sep 23, 2024
Corrected

Care Planning moderate citation Info Issues related to creating and updating personalized care plans for residents based on their needs and conditions. Sep 23, 2024
Corrected

Administration moderate citation Info Issues related to how the facility is managed, including policies, procedures, and compliance with regulations. Jun 08, 2023
Corrected

Infection Control moderate citation Info Issues related to preventing and controlling infections, including hygiene practices and safety protocols. Jun 08, 2023
Corrected

Compare Nursing Homes around Worcester The information below is reported by the Massachusetts Executive Office of Elder Affairs and Department of Public Health.

5 facilities compared · CMS & MA Dept. of Health data · Updated Apr 2026

Filter by care type
Holy Trinity Nursing and Rehabilitation Center
AL

Assisted Living A licensed, long-term care setting for seniors or individuals with disabilities who need help with daily activities — like bathing, dressing, and medication management — but not 24-hour skilled nursing. Offers housing, meals, and around-the-clock support while aiming to maximize resident independence.

NH

Nursing Home Licensed facility providing 24/7 skilled nursing care for residents with complex, ongoing medical needs. Staffed by RNs, LPNs, and CNAs. Inspected and star-rated annually by CMS. Accepts Medicare (short-term rehab) and Medicaid (long-term care).

Worcester (Indian Lake East)
113
85.0%
+4%
3.97
-47%
+1%
2
10
3.3
2
106
59
Apostola, Nicholas
$18.1M
$8.1M
44.8%
225648
Christopher House
NH

Nursing Home Licensed facility providing 24/7 skilled nursing care for residents with complex, ongoing medical needs. Staffed by RNs, LPNs, and CNAs. Inspected and star-rated annually by CMS. Accepts Medicare (short-term rehab) and Medicaid (long-term care).

AL

Assisted Living A licensed, long-term care setting for seniors or individuals with disabilities who need help with daily activities — like bathing, dressing, and medication management — but not 24-hour skilled nursing. Offers housing, meals, and around-the-clock support while aiming to maximize resident independence.

Worcester
-
92.8%
-
4.36
-
-
2
0
0.0
0
143
63
The Grantham Group, Llc
$26.3M
$9.9M
37.8%
225385
Parsons Hill Rehabilitation and Health Care Center
AL

Assisted Living A licensed, long-term care setting for seniors or individuals with disabilities who need help with daily activities — like bathing, dressing, and medication management — but not 24-hour skilled nursing. Offers housing, meals, and around-the-clock support while aiming to maximize resident independence.

HC

Home Care Professional care delivered in the person's own home — from companionship and errands to skilled nursing and therapy. Allows seniors to age in place. Medicare covers skilled home health when medically necessary.

NH

Nursing Home Licensed facility providing 24/7 skilled nursing care for residents with complex, ongoing medical needs. Staffed by RNs, LPNs, and CNAs. Inspected and star-rated annually by CMS. Accepts Medicare (short-term rehab) and Medicaid (long-term care).

Worcester (Webster Square)
162
94.6%
+15%
3.50
-77%
-11%
0
50
6.3
0
150
76
-
$29.3M
$10.3M
35.2%
225390
Blaire House of Worcester
-
NH

Nursing Home Licensed facility providing 24/7 skilled nursing care for residents with complex, ongoing medical needs. Staffed by RNs, LPNs, and CNAs. Inspected and star-rated annually by CMS. Accepts Medicare (short-term rehab) and Medicaid (long-term care).

AL

Assisted Living A licensed, long-term care setting for seniors or individuals with disabilities who need help with daily activities — like bathing, dressing, and medication management — but not 24-hour skilled nursing. Offers housing, meals, and around-the-clock support while aiming to maximize resident independence.

Worcester
-
-
-
-
-
-
-
-
-
0
0
0.0
0
-
71
-
-
-
-
-
Odd Fellows Home of Massachusetts
-
NH

Nursing Home Licensed facility providing 24/7 skilled nursing care for residents with complex, ongoing medical needs. Staffed by RNs, LPNs, and CNAs. Inspected and star-rated annually by CMS. Accepts Medicare (short-term rehab) and Medicaid (long-term care).

AL

Assisted Living A licensed, long-term care setting for seniors or individuals with disabilities who need help with daily activities — like bathing, dressing, and medication management — but not 24-hour skilled nursing. Offers housing, meals, and around-the-clock support while aiming to maximize resident independence.

Worcester
-
-
-
-
-
-
-
-
-
0
0
0.0
0
-
70
-
-
-
-
-

Places of interest near Holy Trinity Nursing and Rehabilitation Center

Address 3.9 miles from city center — 1.69 miles to nearest hospital (UMass Memorial Medical Center Obstetrics and Gynecology)

Calculate Travel Distance to Holy Trinity Nursing and Rehabilitation Center

Add your location

Address

Staffing Data (Q2 2025)

This data corresponds to Q2 2025 and is based on CMS Payroll-Based Journal.

Total staff 148
Employees 132
Contractors 16
Staff to resident ratio 1.59:1
6% worse than Massachusetts average

Massachusetts average ratio: 1.70:1

Avg staff/day 64
Average shift 7.3 hours
8% worse than Massachusetts average

Massachusetts average: 7.9 hours

Total staff hours (quarter) 42,537
Nursing staff breakdown
Registered Nurse

Manages medical care and health needs.

Total count 10
Average shift length Info Average shift length. Calculated as total hours divided by days worked and average staff per day. 8.6 hours

This role is partially covered by contractors.

Licensed Practical Nurse

Assists with medical care and medications.

Total count 31
Average shift length Info Average shift length. Calculated as total hours divided by days worked and average staff per day. 7.7 hours

This role is partially covered by contractors.

Certified Nursing Assistant

Helps with daily care and mobility.

Total count 66
Average shift length Info Average shift length. Calculated as total hours divided by days worked and average staff per day. 7.1 hours

This role is partially covered by contractors.

Contractor staffing

Total hours from contractors

1%

421 contractor hours this quarter

Registered Nurse: 6 Feeding Assistant: 4 Certified Nursing Assistant: 2 Licensed Practical Nurse: 2 Medical Director: 1 Occupational Therapy Assistant: 1
Staff by category
Certified Nursing Assistant6426620,50391100%7.1
Licensed Practical Nurse2923110,29491100%7.7
RN Director of Nursing4041,5406774%8
Registered Nurse46101,5198897%8.6
Speech Language Pathologist5051,4448189%7.5
Other Dietary Services Staff5051,0947886%6.6
Clinical Nurse Specialist4041,0677886%7.5
Physical Therapy Aide3037287481%6.7
Mental Health Service Worker2025525156%8
Physical Therapy Assistant3035407380%7.4
Respiratory Therapy Technician3035377380%7.4
Administrator1015126470%8
Nurse Practitioner1015046369%8
Qualified Social Worker1015006268%8.1
Dental Services Staff1014886167%8
Occupational Therapy Aide1013906571%6
Feeding Assistant0442422224%5.8
Medical Director011401011%4
Occupational Therapy Assistant011371213%3.1
Dietitian101811%8
66 Certified Nursing Assistant
% of Days 100%
31 Licensed Practical Nurse
% of Days 100%
4 RN Director of Nursing
% of Days 74%
10 Registered Nurse
% of Days 97%
5 Speech Language Pathologist
% of Days 89%
5 Other Dietary Services Staff
% of Days 86%
4 Clinical Nurse Specialist
% of Days 86%
3 Physical Therapy Aide
% of Days 81%
2 Mental Health Service Worker
% of Days 56%
3 Physical Therapy Assistant
% of Days 80%
3 Respiratory Therapy Technician
% of Days 80%
1 Administrator
% of Days 70%
1 Nurse Practitioner
% of Days 69%
1 Qualified Social Worker
% of Days 68%
1 Dental Services Staff
% of Days 67%
1 Occupational Therapy Aide
% of Days 71%
4 Feeding Assistant
% of Days 24%
1 Medical Director
% of Days 11%
1 Occupational Therapy Assistant
% of Days 13%
1 Dietitian
% of Days 1%

Facility Characteristics

Source: CMS Long-Term Care Facility Characteristics (Data as of Jan 2026)

Total census
93 residents
Residents by payment source
Medicare
6 residents (6.5%)
Medicaid
38 residents (40.9%)
Private pay or other
49 residents (52.7%)
Programs & Services
Residents' Group

Residents meet regularly to discuss policies, care quality, and activities

Family Member Group

Family members meet regularly to discuss policies, care quality, and activities

Active Family Council

Organized group of family members that meets regularly to discuss facility policies, resident care, and activities.

Active Resident Council

Organized group of residents that meets regularly to discuss facility policies, quality of life, and activities.

Quality of care over time

These measures show how residents usually do over time at this home, based on health outcomes and preventive care.

High-risk clinical events score Info A composite score based on pressure ulcers, falls with injury, weight loss, walking ability decline, and activities of daily living decline. 9.7
5% better than Massachusetts average

Massachusetts average: 10.2

Functional decline score Info A composite score based on activities of daily living decline, walking ability decline, and incontinence. 20.9
In line with Massachusetts average

Massachusetts average: 20.0

Long-stay resident measures
Above average Massachusetts avg: 3.5 Info CMS star rating based on long-stay quality measure performance. 5 stars = significantly above average, 1 star = significantly below average.
Need for Help with Daily Activities Increased Info Percent of long-stay residents whose need for help with daily activities has increased 18.9%
In line with Massachusetts average

Massachusetts average: 18.7%

Walking Ability Worsened Info Percent of long-stay residents whose ability to move independently worsened 19.4%
In line with Massachusetts average

Massachusetts average: 19.3%

Low Risk Residents with Bowel/Bladder Incontinence Info Percent of low risk long-stay residents who lose control of their bowels or bladder 24.4%
10% worse than Massachusetts average

Massachusetts average: 22.1%

Falls with Major Injury Info Percent of long-stay residents experiencing one or more falls with major injury 5.0%
40% worse than Massachusetts average

Massachusetts average: 3.6%

High Risk Residents with Pressure Ulcers Info Percent of long-stay high risk residents with pressure ulcers 2.0%
57% better than Massachusetts average

Massachusetts average: 4.7%

Urinary Tract Infection Info Percent of long-stay residents with a urinary tract infection 2.6%
25% worse than Massachusetts average

Massachusetts average: 2.1%

Lost Too Much Weight Info Percent of long-stay residents who lose too much weight 2.9%
43% better than Massachusetts average

Massachusetts average: 5.2%

Depressive Symptoms Info Percent of long-stay residents who have depressive symptoms 8.6%
20% better than Massachusetts average

Massachusetts average: 10.7%

Antipsychotic Use Info Percent of long-stay residents who received an antipsychotic medication 19.5%
In line with Massachusetts average

Massachusetts average: 20.3%

Pneumococcal Vaccine Info Percent of long-stay residents assessed and appropriately given the pneumococcal vaccine 97.8%
6% better than Massachusetts average

Massachusetts average: 91.9%

Influenza Vaccine Info Percent of long-stay residents assessed and appropriately given the seasonal influenza vaccine 100.0%
5% better than Massachusetts average

Massachusetts average: 94.8%

Hospitalizations per 1,000 days Info Number of hospitalizations per 1,000 long-stay resident days. 1.71
8% better than Massachusetts average

Massachusetts average: 1.86

ED visits per 1,000 days Info Number of outpatient emergency department visits per 1,000 long-stay resident days. 1.81
18% worse than Massachusetts average

Massachusetts average: 1.54

Short-stay resident measures
Above average Massachusetts avg: 3.4 Info CMS star rating based on short-stay quality measure performance. 5 stars = much above average, 1 star = much below average.
Pneumococcal Vaccine Info Percent of short-stay residents assessed and appropriately given the pneumococcal vaccine 91.6%
20% better than Massachusetts average

Massachusetts average: 76.7%

Antipsychotic medication increase Info Percent of short-stay residents who newly received an antipsychotic medication 2.1%
60% worse than Massachusetts average

Massachusetts average: 1.3%

Influenza Vaccine Info Percent of short-stay residents assessed and appropriately given the seasonal influenza vaccine 89.1%
15% better than Massachusetts average

Massachusetts average: 77.7%

Re-hospitalized after SNF stay Info Percentage of short-stay residents who were re-hospitalized after their nursing home admission. 28.1%
9% worse than Massachusetts average

Massachusetts average: 25.8%

Emergency department visits Info Percentage of short-stay residents who had an outpatient emergency department visit. 12.4%
5% worse than Massachusetts average

Massachusetts average: 11.8%

Falls with major injury Info Percentage of SNF residents who experience falls with major injury during their stay. 0.0%
100% better than Massachusetts average

Massachusetts average: 0.8%

Ability to care for self at discharge Info Percentage of residents at or above expected ability to care for themselves at discharge. 58.2%
8% better than Massachusetts average

Massachusetts average: 53.7%

Successful return to home or community Info Rate of successful return to home or community from a skilled nursing facility. 57.8%
14% better than Massachusetts average

Massachusetts average: 50.6%

Penalties and fines

Federal penalties imposed by CMS for regulatory violations, including civil money penalties (fines) and denials of payment for new Medicare/Medicaid admissions.

Source: CMS Penalties Database (Data as of Jan 2026)

Total fines amount $24K
67% lower than Massachusetts average

Massachusetts average: $72K

Number of fines 2
17% more fines than Massachusetts average

Massachusetts average: 1.7

Payment Denials Info Serious action where Medicare and/or Medicaid temporarily stops payments for new residents until issues are fixed. 0
100% fewer payment denials than Massachusetts average

Massachusetts average: 0.1

Fines amount comparison
This facility $24K
Massachusetts average $72K
Penalty History

Penalties are imposed by CMS for violations of federal nursing home regulations.

Civil Money Penalty Info Fines imposed for noncompliance, which can be assessed per day or per instance of violation. Jan 3, 2023
$12K
Civil Money Penalty Info Fines imposed for noncompliance, which can be assessed per day or per instance of violation. Jan 3, 2023
$12K

Last updated: Jan 2026

Guides for Better Senior Living

Care Cost Calculator: See Prices in Your Area

Nursing Home Data Explorer

Don’t Wait Too Long: 7 Red Flag Signs Your Parent Needs Assisted Living Now

The True Cost of Assisted Living in 2025 – And How Families Are Paying For It

Understanding Senior Living Costs: Pricing Models, Discounts & Financial Assistance

Financial Aid for Massachusetts Seniors

Get financial aid guidance

Home Care Program

MassHealth Home Care

Age 60+, Massachusetts resident, at risk of nursing home placement.

~$1,500/month (individual, varies by region).

$2,000 (individual, excludes home, car).

Coordinated through Aging Services Access Points (ASAPs); high demand in urban areas.

Frail Elder Waiver

Massachusetts Medicaid FE Waiver

Age 65+, Massachusetts resident, Medicaid-eligible, nursing home-level care need.

~$2,829/month (300% FBR, individual).

$2,000 (individual), $3,000 (couple).

Requires clinical eligibility determination.

Senior Care Options (SCO)

Massachusetts Senior Care Options

Age 65+, Massachusetts resident, eligible for MassHealth (Medicare optional), nursing home-level care need.

~$2,829/month (300% FBR, individual); QIT allowed.

$2,000 (individual), $3,000 (couple) (excludes home up to $713,000, car).

Not available in Dukes/Nantucket Counties; multiple SCO providers (e.g., CCA, Tufts).

Medicare Savings Program (MSP)

Massachusetts Medicare Savings Program (MassHealth Buy-In)

Age 65+ or disabled, Massachusetts resident, Medicare Part A/B.

~$2,510/month (QMB), ~$3,380/month (SLMB), ~$3,598/month (QI)—individual.

$9,430 (individual), $14,130 (couple).

Three tiers; no waitlist; includes Extra Help for Part D.

National Family Caregiver Support Program (NFCSP) Respite

Massachusetts NFCSP Respite Care

Caregivers of 60+ needing care or 55+ caregivers of others; Massachusetts resident; functional needs (2+ ADLs).

Prioritizes ~$24,980/year (individual); no strict cap.

Not assessed; need-based.

27 ASAPs; prioritizes low-income, rural caregivers.

Prescription Advantage

Massachusetts Prescription Advantage

Age 65+ or disabled, Massachusetts resident, enrolled in Medicare Part D (or ineligible for Medicare).

No strict limit; copays vary by income (~$24,980-$75,000/year individual).

Not assessed.

Supplements Medicare Part D; no enrollment fee for low-income.

Senior Community Service Employment Program (SCSEP)

Massachusetts SCSEP

Age 55+, unemployed, low-income, Massachusetts resident.

~$1,983/month (125% FPL).

Not specified; income-focused.

Priority for veterans, rural residents; AARP partnership.

VA Aid and Attendance (A&A) and Housebound Benefits

Massachusetts VA Aid and Attendance/Housebound

Age 65+ or disabled veteran/spouse, Massachusetts resident, wartime service, need for ADL help (A&A) or homebound.

Net income < ~$1,984/month (veteran with dependent, A&A); pension offsets income.

~$155,356 (net worth limit).

High veteran demand statewide.