Hope Creek Nursing Rehab & Care
Nursing Home & Memory Care · Moline, IL
CMS overall rating Info The Overall CMS Rating is scored from 1 to 5 stars and combines results from health inspections, staffing levels, and quality measures. Health inspections carry the most weight. Staffing and quality scores can increase or decrease the final rating based on performance compared to state and national standards.

Hope Creek Nursing Rehab & Care

Nursing Home & Memory Care · Moline, IL
CMS overall rating Info The Overall CMS Rating is scored from 1 to 5 stars and combines results from health inspections, staffing levels, and quality measures. Health inspections carry the most weight. Staffing and quality scores can increase or decrease the final rating based on performance compared to state and national standards.
Calculator: See prices in your area
Hope Creek Nursing Rehab & Care accepts Medicare, Medicaid, and private pay.

Overview of Hope Creek Nursing Rehab & Care

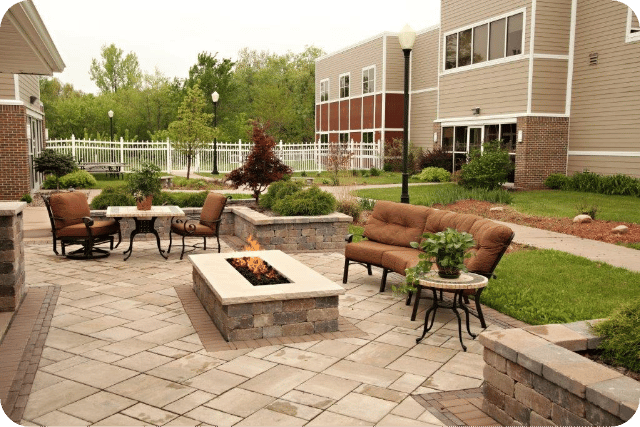
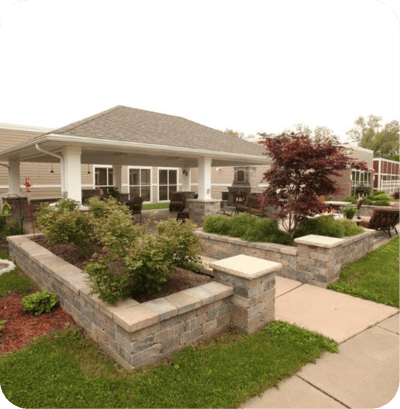
Hope Creek Nursing Rehab & Care is a nursing home in East Moline, IL, offering skilled nursing and rehabilitation. The community also ensures older adults are treated well in a compassionate and welcoming environment. With 24-hour care, maintenance services, and dietitian-approved meals, residents receive high-quality services to live comfortably. Through personalized care plans, the community goes above and beyond to meet residents’ unique needs and preferences.

Social events, light exercises, and games provide residents with more opportunities to explore new hobbies and have fun. A library, a beauty/barber shop, and an outdoor courtyard are among the top-notch amenities that aim to provide residents with more spaces for interactions and relaxation. Situated in the lively neighborhood of East Miline, near restaurants, shops, and bus stops, the community ensures residents have quick access to their necessities and leisure. This nursing home is a good option for senior living in Illinois, especially with its dedicated services and a clean setting.

Quality ratings

Measured by Centers for Medicare & Medicaid Services (CMS)

Overall rating Info The Overall CMS Rating combines results from health inspections, staffing levels and quality measures. Health inspections carry the most weight. Staffing and quality scores can increase or decrease the final rating based on performance compared to state and national standards.
▼ 60.3% Below IL avg. ▼ 60.3% Below IL avg.Click the badge to see the full State ranking.Click here to see the full State ranking.
Health Inspection Info Based on the results of the facility's three most recent standard inspections and any complaint investigations. CMS reviews the number, scope, and severity of deficiencies, with more recent findings weighted more heavily.
▼ 64.0% Below IL avg. ▼ 64.0% Below IL avg.Click the badge to see the full State ranking.Click here to see the full State ranking.
Staffing Info Measures average nursing staff hours per resident per day, including Registered Nurses (RNs) and total nursing staff. Ratings are adjusted based on the level of care residents require and are compared to state and national benchmarks.
▼ 53.2% Below IL avg. ▼ 53.2% Below IL avg.Click the badge to see the full State ranking.Click here to see the full State ranking.
Quality Measures Info Based on clinical and physical health indicators reported to CMS, such as hospital readmissions, falls, pressure ulcers, and improvements in mobility. These measures reflect how well residents' health needs are being managed.
▼ 29.0% Below IL avg. ▼ 29.0% Below IL avg.Click the badge to see the full State ranking.Click here to see the full State ranking.

Staffing hours breakdown

Info Daily nursing hours per resident by staff type, reported to CMS. Higher is generally better — compare this facility to state and national averages to see where staffing stands.

Hours per resident per day — compared to Illinois state averages

Total nursing care / resident Info Total adjusted nursing hours per resident per day, combining RN, LPN, and aide time. CMS adjusts this for case-mix so facilities can be fairly compared.
2h 41m per day
This facility Illinois avg (3h 6m per day)
vs Illinois avg
-14%
Staff typeHours / Day / Residentvs state avg
Total Nursing (Weekend) Info Combined nursing hours (RN + LPN + Nurse Aide) per resident per day on weekends. Staffing often drops on weekends — this figure reveals whether the facility maintains adequate coverage outside of weekday hours. 2h 52m per day

Capacity and availability

This home usually has availability

Occupancy lower than 85% suggests more openings may be available.

Lower occupancy than the Illinois average: 69.3%
Occupancy rate 52.1%
Avg. Length of Stay 150 days
Occupancy rate
52.1%
Avg. Length of Stay
150 days

Who this home usually serves

TYPE OF STAY

Mostly long-term care residents

Most residents stay for extended periods and receive ongoing daily care.

Breakdown by payment type

Medicare

24% of new residents, usually for short-term rehab.

Typical stay 26 days

Private pay

48% of new residents, often for short stays.

Typical stay 1 - 2 months

Medicaid

29% of new residents, often for long-term daily care.

Typical stay 1 years

Finances and operations

Governmental community
Operated by county authorities.
Home revenue
$16.4M
Surplus of revenue
$3.2M
Governmental community Operated by county authorities.
Home revenue
$16.4M
Surplus of revenue
$3.2M
Payroll costs Info The portion of the home's budget spent on staff, including nurses, caregivers, and other employees who support care and operations.
$6.3M
38.5% of revenue
Other operating costs Info All remaining costs needed to run the home, such as food, utilities, building maintenance, supplies and administrative expenses.
$6.9M
Total costs $13.2M
Walk Score
Walk Score: 46 / 100
Somewhat walkable. A few nearby services may be reachable on foot, but most trips require transportation.

What does this home offer?

Housing options icon

Housing Options: Private/Semi-Private Rooms

Building type icon
Building type icon

Building Type: Single-story

On-site medical care and health services icon

On-site Medical Care and Health Services

Rehabilitative support icon

Rehabilitative Support

Beauty services icon

Beauty Services

Dining services icon

Dining Services

Social and recreational activities icon

Social and Recreational Activities

Types of Care at Hope Creek Nursing Rehab & Care

Nursing Home Memory Care

Contact Hope Creek Nursing Rehab & Care

Health Inspection History

Inspections Since 2022
Total health inspections 16

Illinois average 10.4


Last Health inspection on Aug 2025

Total health citations
58

Illinois average 36.8

Citations per inspection
3.62

Illinois average 3.68


Health citations are formal notices following inspections when they fail to comply with safety and care standards.

40 of 58 citations resulted from standard inspections; 15 of 58 resulted from complaint investigations; and 3 of 58 came from combined inspections (standard and complaint).

Breakdown of citation severity (last 4 years)
Critical Health citations
4
471% worse than Illinois average

Illinois average: 0.7


Serious Health citations
5
39% worse than Illinois average

Illinois average: 3.6

4 critical citations Illinois average: 0.7

5 serious citations Illinois average: 3.6

49 moderate citations Illinois average: 32

0 minor citations Illinois average: 0.5
Citations history (last 4 years)
Nutrition moderate citation Aug 22, 2025
Corrected

Resident Rights moderate citation Aug 22, 2025
Corrected

Quality of Care moderate citation Jun 26, 2025
Corrected

Care Planning moderate citation Jun 26, 2025
Corrected

Financial Assistance for
Nursing Home in Illinois

Hope Creek Nursing Rehab & Care is located in East Moline, Illinois.
Here are the financial assistance programs available to residents in Illinois.

Get Financial aid guidance

Community Care Program

Illinois CCP

Age 60+
General Illinois resident, at risk of nursing home placement.
Income Limits (2025) ~$1,215/month individual
Asset Limits $17,500 individual, excludes home, car
IL

High demand in urban areas; waitlists possible.

Benefits
In-home care (3-5 hours/day) Adult day services ($65/day) Emergency home response systems ($30/month)

Illinois Respite Program

IL Respite (via NFCSP)

Age Caregiver of someone 60+ (or with dementia)
General Illinois resident.
Income Limits No strict limit; prioritizes low-income.
Asset Limits Not applicable.
IL

Limited slots; urban/rural balance.

Benefits
In-home respite (4-6 hours/day) Adult day care (~$65/day) Short-term facility care (up to 5 days)

Supportive Living Program (SLP)

Illinois Medicaid Supportive Living Program

Age 65+ or 22-64 with disability
General Illinois resident, Medicaid-eligible, needs moderate assistance (not nursing home-level).
Income Limits (2025) ~$2,829/month (300% FBR, individual); QIT allowed.
Asset Limits $2,000 (individual), $3,000 (couple) (excludes home, car).
IL

~200 SLP sites statewide; room/board not covered.

Benefits
Personal care (5-7 hours/day, e.g., bathing, mobility) Meals Housekeeping Medication management Respite (~240 hours/year)

Persons Who Are Elderly Waiver

Illinois Medicaid Elderly Waiver

Age 65+
General Illinois resident, Medicaid-eligible, nursing home-level care need.
Income Limits (2025) ~$2,829/month 300% FBR, individual
Asset Limits $2,000 (individual), $3,000 (couple).
IL

Part of HealthChoice Illinois; consumer-directed options available.

Benefits
Personal care (5-7 hours/day, e.g., dressing, eating) Homemaker Adult day care (~$60/day) Respite (240 hours/year) Home mods ($1,000 avg.)

Medicare Savings Program (MSP)

Illinois Medicare Savings Program

Age 65+ or disabled
General Illinois resident, Medicare Part A/B.
Income Limits (2025) ~$2,510/month (QMB), ~$3,380/month (SLMB), ~$3,598/month (QI)—individual.
Asset Limits $9,430 (individual), $14,130 (couple).
IL

Three tiers; no waitlist.

Benefits
Covers Part B premiums ($174.70/month) Deductibles ($240/year) Copays (~20%)

Optional State Supplementation (OSS)

Illinois Optional State Supplementation

Age 65+ or disabled
General Illinois resident, in approved facility, SSI recipient or low-income.
Income Limits (2025) ~$1,004/month including SSI
Asset Limits $2,000 (individual), $3,000 (couple).
IL

~$50-$500/month based on facility type.

Benefits
Cash (~$50-$500/month) for room/board in personal care homes or SLFs

VA Aid and Attendance (A&A) and Housebound Benefits

Illinois VA Aid and Attendance/Housebound

Age 65+ or disabled veteran/spouse
General Illinois resident, wartime service, need for ADL help (A&A) or homebound.
Income Limits (2025) Net income < ~$1,984/month (veteran with dependent, A&A); pension offsets income.
Asset Limits ~$155,356 net worth limit
IL

High veteran demand in urban/rural areas.

Benefits
Cash (~$1,433-$2,642/month veteran, ~$951-$1,318 spouse) for care costs (e.g., in-home, assisted living)

Places of interest near Hope Creek Nursing Rehab & Care

Address 1.7 miles from city center Info Estimated distance in miles from East Moline's city center to Hope Creek Nursing Rehab & Care's address, calculated via Google Maps.

Calculate Travel Distance to Hope Creek Nursing Rehab & Care

Add your location

Address

Staffing Data

Reporting period: April 1 – June 30, 2025 (Q2 2025). Source: CMS Payroll-Based Journal report.

Total staff 251
Employees 181
Contractors 70
Staff to resident ratio 1.54:1
19% worse than Illinois average
Illinois average ratio: 1.90:1 Illinois average ratio: 1.90:1See full Illinois ranking
Avg staff/day 90
Average shift 7.1 hours
7% worse than Illinois average
Illinois average: 7.6 hours Illinois average shift: 7.6 hoursSee full Illinois ranking
Total staff hours (quarter) 58,017

Nursing staff breakdown

Q2 2025 · Apr 1 – Jun 30 More info This data comes from the CMS Payroll-Based Journal report covering April 1 – June 30, 2025.
Registered Nurse

Manages medical care and health needs.

Total count 26
Average shift length Info Average shift length. Calculated as total hours divided by days worked and average staff per day. 7.8 hours

This role is partially covered by contractors.

Licensed Practical Nurse

Assists with medical care and medications.

Total count 39
Average shift length Info Average shift length. Calculated as total hours divided by days worked and average staff per day. 7.6 hours

This role is partially covered by contractors.

Certified Nursing Assistant

Helps with daily care and mobility.

Total count 117
Average shift length Info Average shift length. Calculated as total hours divided by days worked and average staff per day. 7.1 hours

This role is partially covered by contractors.

Contractor staffing

Q2 2025 · Apr 1 – Jun 30 More info This data comes from the CMS Payroll-Based Journal report covering April 1 – June 30, 2025.

Total hours from contractors

20.7%

12,029 contractor hours this quarter

Licensed Practical Nurse: 26 Registered Nurse: 18 Certified Nursing Assistant: 11 Qualified Social Worker: 6 Physical Therapy Aide: 3 Speech Language Pathologist: 3 Respiratory Therapy Technician: 2 Physical Therapy Assistant: 1

Staff by category

Q2 2025 · Apr 1 – Jun 30 More info This data comes from the CMS Payroll-Based Journal report covering April 1 – June 30, 2025.
Certified Nursing Assistant1061111729,44591100%7.1
Licensed Practical Nurse1326397,51991100%7.6
Registered Nurse818265,58991100%7.8
Physical Therapist180183,93791100%6.4
Other Dietary Services Staff170172,92491100%6.3
Occupational Therapy Aide7072,10591100%7.9
RN Director of Nursing2021,0698593%7.9
Physical Therapy Aide0337616673%6.1
Speech Language Pathologist0337496673%5.9
Administrator2026006470%8
Mental Health Service Worker3035955965%7.6
Nurse Practitioner2024986470%6.1
Physical Therapy Assistant0114646470%7.3
Clinical Nurse Specialist1014525965%7.7
Dietitian1014516774%6.7
Respiratory Therapy Technician0223846470%6
Qualified Activities Professional1012393134%7.7
Qualified Social Worker0662365864%3.6
117 Certified Nursing Assistant
% of Days 100%
39 Licensed Practical Nurse
% of Days 100%
26 Registered Nurse
% of Days 100%
18 Physical Therapist
% of Days 100%
17 Other Dietary Services Staff
% of Days 100%
7 Occupational Therapy Aide
% of Days 100%
2 RN Director of Nursing
% of Days 93%
3 Physical Therapy Aide
% of Days 73%
3 Speech Language Pathologist
% of Days 73%
2 Administrator
% of Days 70%
3 Mental Health Service Worker
% of Days 65%
2 Nurse Practitioner
% of Days 70%
1 Physical Therapy Assistant
% of Days 70%
1 Clinical Nurse Specialist
% of Days 65%
1 Dietitian
% of Days 74%
2 Respiratory Therapy Technician
% of Days 70%
1 Qualified Activities Professional
% of Days 34%
6 Qualified Social Worker
% of Days 64%

Facility Characteristics

Source: CMS Long-Term Care Facility Characteristics (Data as of Jan 2026)

Total residents 163
Medicare
29
17.8% of residents
Medicaid
113
69.3% of residents
Private pay or other
21
12.9% of residents
Programs & Services
Residents Group

Residents meet regularly to discuss policies, care quality, and activities

Active Resident Council

Organized group of residents that meets regularly to discuss facility policies, quality of life, and activities.

Quality of care over time

These measures show how residents usually do over time at this home, based on health outcomes and preventive care.

High-risk clinical events score Info A composite score based on pressure ulcers, falls with injury, weight loss, walking ability decline, and activities of daily living decline. 15.1
56% worse than Illinois average

Illinois average: 9.7

Functional decline score Info A composite score based on activities of daily living decline, walking ability decline, and incontinence. 28.7
54% worse than Illinois average

Illinois average: 18.6

Long-stay resident measures
Need for Help with Daily Activities Increased Info Percent of long-stay residents whose need for help with daily activities has increased 28.7%
86% worse than Illinois average

Illinois average: 15.5%

Walking Ability Worsened Info Percent of long-stay residents whose ability to move independently worsened 28.2%
53% worse than Illinois average

Illinois average: 18.4%

Low Risk Residents with Bowel/Bladder Incontinence Info Percent of low risk long-stay residents who lose control of their bowels or bladder 29.1%
35% worse than Illinois average

Illinois average: 21.6%

Falls with Major Injury Info Percent of long-stay residents experiencing one or more falls with major injury 2.2%
34% better than Illinois average

Illinois average: 3.4%

High Risk Residents with Pressure Ulcers Info Percent of long-stay high risk residents with pressure ulcers 8.1%
54% worse than Illinois average

Illinois average: 5.3%

Urinary Tract Infection Info Percent of long-stay residents with a urinary tract infection 3.2%
78% worse than Illinois average

Illinois average: 1.8%

Lost Too Much Weight Info Percent of long-stay residents who lose too much weight 8.3%
27% worse than Illinois average

Illinois average: 6.5%

Depressive Symptoms Info Percent of long-stay residents who have depressive symptoms 70.9%
47% worse than Illinois average

Illinois average: 48.1%

Antipsychotic Use Info Percent of long-stay residents who received an antipsychotic medication 6.1%
70% better than Illinois average

Illinois average: 20.2%

Pneumococcal Vaccine Info Percent of long-stay residents assessed and appropriately given the pneumococcal vaccine 55.5%
38% worse than Illinois average

Illinois average: 89.2%

Influenza Vaccine Info Percent of long-stay residents assessed and appropriately given the seasonal influenza vaccine 84.1%
8% worse than Illinois average

Illinois average: 91.6%

Short-stay resident measures
Pneumococcal Vaccine Info Percent of short-stay residents assessed and appropriately given the pneumococcal vaccine 28.6%
58% worse than Illinois average

Illinois average: 68.3%

Antipsychotic medication increase Info Percent of short-stay residents who newly received an antipsychotic medication 2.0%
17% better than Illinois average

Illinois average: 2.3%

Influenza Vaccine Info Percent of short-stay residents assessed and appropriately given the seasonal influenza vaccine 33.3%
47% worse than Illinois average

Illinois average: 63.0%

Penalties and fines

Federal penalties imposed by CMS for regulatory violations, including civil money penalties (fines) and denials of payment for new Medicare/Medicaid admissions.

Source: CMS Penalties Database (Data as of Jan 2026)

Total fines amount $388K
171% higher than Illinois average

Illinois average: $143K

Number of fines 5
69% more fines than Illinois average

Illinois average: 3.0

Payment Denials Info Serious action where Medicare and/or Medicaid temporarily stops payments for new residents until issues are fixed. 0
100% fewer payment denials than Illinois average

Illinois average: 1.1

Fines amount comparison
This facility $388K
Illinois average $143K
Penalty History

Penalties are imposed by CMS for violations of federal nursing home regulations.

4 penalties in the past 3 years

Multiple penalties were reported in the last 3 years.

Civil Money Penalty Info Fines imposed for noncompliance, which can be assessed per day or per instance of violation. Dec 3, 2024
$36K
Civil Money Penalty Info Fines imposed for noncompliance, which can be assessed per day or per instance of violation. Aug 31, 2024
$84K
Civil Money Penalty Info Fines imposed for noncompliance, which can be assessed per day or per instance of violation. Jul 2, 2024
$94K
Civil Money Penalty Info Fines imposed for noncompliance, which can be assessed per day or per instance of violation. Apr 5, 2024
$136K

Last updated: Jan 2026

Compare Nursing Home around Moline

The information below is reported by the Illinois Department of Public Health, Office of Health Care Regulation.

3 facilities compared · CMS & IL Dept. of Health data

Filter by care type
Celebrate of Moline
NH

Nursing Home Licensed facility providing 24/7 skilled nursing care for residents with complex, ongoing medical needs. Staffed by RNs, LPNs, and CNAs. Inspected and star-rated annually by CMS. Accepts Medicare (short-term rehab) and Medicaid (long-term care).

HC

Home Care Professional care delivered in the person's own home — from companionship and errands to skilled nursing and therapy. Allows seniors to age in place. Medicare covers skilled home health when medically necessary.

MC

Memory Care Secured, specialized care for people living with Alzheimer's or dementia. Staff trained in cognitive impairment, with higher staff-to-resident ratios and an environment designed to reduce confusion and wandering risk.

Moline120 83.5% +21%2.79 -59%-10%$21.7k174.3294 16 Aaron Cohen$9.3M$6.7M72.1%145680
Allure of Moline
NH

Nursing Home Licensed facility providing 24/7 skilled nursing care for residents with complex, ongoing medical needs. Staffed by RNs, LPNs, and CNAs. Inspected and star-rated annually by CMS. Accepts Medicare (short-term rehab) and Medicaid (long-term care).

HC

Home Care Professional care delivered in the person's own home — from companionship and errands to skilled nursing and therapy. Allows seniors to age in place. Medicare covers skilled home health when medically necessary.

East Moline120 72.3% +4%2.25 -43%-28%$0423.5196 24 430 South 30Th Ave LLC$11.6M$4.7M40.1%146041
Hope Creek Nursing Rehab & Care
NH

Nursing Home Licensed facility providing 24/7 skilled nursing care for residents with complex, ongoing medical needs. Staffed by RNs, LPNs, and CNAs. Inspected and star-rated annually by CMS. Accepts Medicare (short-term rehab) and Medicaid (long-term care).

MC

Memory Care Secured, specialized care for people living with Alzheimer's or dementia. Staff trained in cognitive impairment, with higher staff-to-resident ratios and an environment designed to reduce confusion and wandering risk.

East Moline245 52.1% -25%2.68 -26%-14%$387.6k583.69147 46 Michael Blisko$16.4M$6.3M38.5%145269

Guides for Better Senior Living

Care Cost Calculator: See Prices in Your Area

Nursing Home Data Explorer

Don’t Wait Too Long: 7 Red Flag Signs Your Parent Needs Assisted Living Now

The True Cost of Assisted Living in 2025 – And How Families Are Paying For It

Understanding Senior Living Costs: Pricing Models, Discounts & Financial Assistance

Frequently Asked Questions about Hope Creek Nursing Rehab & Care

Is Hope Creek Nursing Rehab & Care in a walkable area?

Hope Creek Nursing Rehab & Care has a walk score of 46. Somewhat walkable. A few nearby services may be reachable on foot, but most trips require transportation.

What is the best email address for Hope Creek Nursing Rehab & Care?

The team at Hope Creek Nursing Rehab & Care can be reached at [email protected].

What is the address of Hope Creek Nursing Rehab & Care?

Hope Creek Nursing Rehab & Care is located at 4343 Kennedy Dr, East Moline, IL 61244.

What is the phone number of Hope Creek Nursing Rehab & Care?

(309) 796-6600 will put you in contact with the team at Hope Creek Nursing Rehab & Care.

Is Hope Creek Nursing Rehab & Care Medicare or Medicaid certified?

Yes — Hope Creek Nursing Rehab & Care is a CMS-certified provider of Medicare and Medicaid.

Explore Open Rooms
1 Contact details
2 What type of senior care service are you looking for?
3 What budget do you have in mind for senior care?
4 How soon do you need to find care?
5 Additional details

Thank you for your interest!

Our team will be in touch shortly to help with next steps.