Hope Springs Care Center
Nursing Home, Hospice Care, Nursing Care & Respite Care · Montrose, CO
CMS overall rating Info CMS (the Centers for Medicare & Medicaid Services) is the federal agency that rates nursing home quality. Its Overall Rating runs from 1 to 5 stars, combining health inspections, staffing, and quality measures, with inspections weighted most heavily.

Hope Springs Care Center

Nursing Home, Hospice Care, Nursing Care & Respite Care · Montrose, CO
CMS overall rating Info CMS (the Centers for Medicare & Medicaid Services) is the federal agency that rates nursing home quality. Its Overall Rating runs from 1 to 5 stars, combining health inspections, staffing, and quality measures, with inspections weighted most heavily.
Calculator: See prices in your area
Hope Springs Care Center accepts Medicare, Medicaid, and private pay.

Overview of Hope Springs Care Center

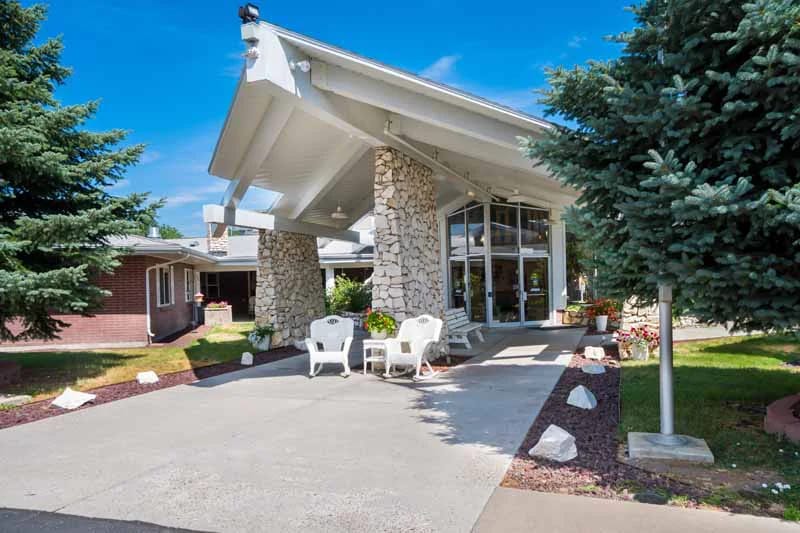
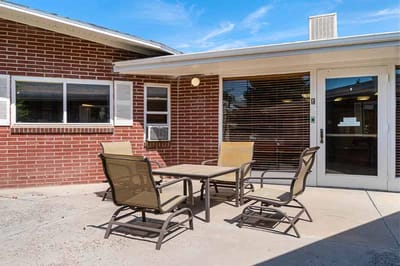
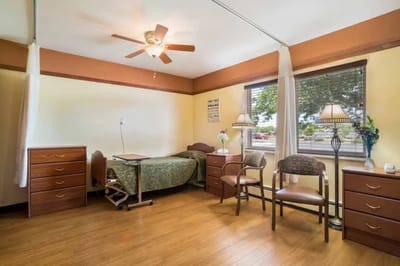
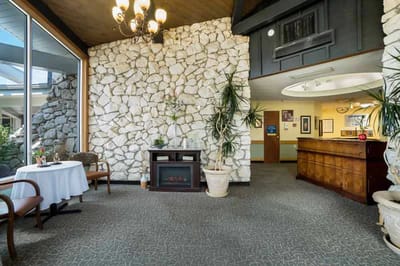
Situated in a highly walkable neighborhood with a Walk Score of 84, Hope Springs Care Center is a 74-bed nursing home in Montrose, Colorado. It currently operates at 63 percent occupancy, maintaining a steady patient population while continuing to serve the community’s nursing care needs. Averaging a stay length of 120 days, the home accommodates short-term rehabilitation stays and longer-term care residents who seek professional nursing support.

Daily care is supported by a nursing team providing roughly 3 hours 14 minutes of total nursing care per resident day. This includes registered nursing time, nursing aide support, and licensed practical nursing hours to ensure enough diligent care and medical oversight. Accepted are Medicare, Medicaid, and private pay, offering families numerous ways to fund their care needs.

Hope Springs Care Center welcomes patients and residents wanting to explore if its services match their care requirements. Tours of the space and further information regarding particular programs and accommodations are available by contacting the facility.

Quality ratings

Measured by Centers for Medicare & Medicaid Services (CMS)

Overall rating Info The Overall CMS Rating combines results from health inspections, staffing levels and quality measures. Health inspections carry the most weight. Staffing and quality scores can increase or decrease the final rating based on performance compared to state and national standards.
Health Inspection Info Based on the results of the facility's three most recent standard inspections and any complaint investigations. CMS reviews the number, scope, and severity of deficiencies, with more recent findings weighted more heavily.
Staffing Info Measures average nursing staff hours per resident per day, including Registered Nurses (RNs) and total nursing staff. Ratings are adjusted based on the level of care residents require and are compared to state and national benchmarks.
Quality Measures Info Based on clinical and physical health indicators reported to CMS, such as hospital readmissions, falls, pressure ulcers, and improvements in mobility. These measures reflect how well residents' health needs are being managed.

Staffing hours breakdown

Info Daily nursing hours per resident by staff type, reported to CMS. Higher is generally better — compare this facility to state and national averages to see where staffing stands.

Hours per resident per day — compared to state averages

Total nursing care / resident Info Total adjusted nursing hours per resident per day, combining RN, LPN, and aide time. CMS adjusts this for case-mix so facilities can be fairly compared.
3h 14m per day
Rank #158 / 215Nurse hours — State benchmarkedThis home is ranked 158th out of 215 homes in Colorado. Shows adjusted nurse hours per resident per day benchmarked to the Colorado average, with a ranking across 215 Colorado facilities. More hours mean more direct care. The national average is about 3.5 hrs; below 3.0 is a red flag.Rankings are based only on facilities in Colorado that report data for that category. Facilities without available data are excluded from the ranking.Click the rank badge to see the full State ranking.Click here to see the full State ranking.
vs avg

6 of 6 metrics below state avg

Staff type Hours / Day / Resident vs state avg
Registered Nurse (RN) Info RNs hold the highest nursing license and can assess residents, interpret test results, and direct care plans. More RN hours per day often signals stronger clinical oversight and faster response to health changes. 49m per day ▼ 3% State avg: 50m per day · National avg: 41m per day
LPN / LVN Info Licensed Practical Nurses (LPNs) or Licensed Vocational Nurses (LVNs) deliver routine hands-on care — medication administration, wound dressing, and monitoring vital signs. They work under RN supervision and make up a large share of daily bedside care. 34m per day ▼ 18% State avg: 41m per day · National avg: 52m per day
Nurse Aide Info Certified Nurse Aides (CNAs) provide the most direct day-to-day assistance: bathing, dressing, feeding, and mobility. Nurse aide hours are typically the largest staffing category and directly affect residents' quality of life. 1h 50m per day ▼ 17% State avg: 2h 12m per day · National avg: 2h 20m per day
Weekend Total Nursing Info Combined nursing hours (RN + LPN + Nurse Aide) per resident per day on weekends. Staffing often drops on weekends — this figure reveals whether the facility maintains adequate coverage outside of weekday hours. 2h 58m per day ▼ 9% State avg: 3h 16m per day · National avg: 3h 26m per day
Physical Therapist Info Hours per resident per day provided by licensed Physical Therapists (PTs) or PT Assistants. PT services help residents recover mobility after injury or illness and are especially important for post-acute (short-stay) rehabilitation. 1m per day ▼ 79% State avg: 5m per day · National avg: 4m per day
Weekend RN Info Registered nurse hours specifically on weekends. Facilities sometimes reduce RN presence on Saturdays and Sundays — a low weekend RN figure compared to weekday hours can indicate reduced clinical oversight when most administrative staff are absent. 29m per day ▼ 21% State avg: 36m per day · National avg: 28m per day

Capacity and availability

Avg. Length of Stay
120 days
Bed community size
74-bed community Rank #261 / 533Bed count — State benchmarkedThis home is ranked 261st out of 533 homes in Colorado. Shows this facility's certified or reported bed count compared to other Colorado facilities. Larger communities may offer more amenities, programs, and on-site services for residents and families.Rankings are based only on facilities in Colorado that report data for that category. Facilities without available data are excluded from the ranking.Click the rank badge to see the full State ranking.Click here to see the full State ranking.
A moderately sized community that may balance personal attention with shared amenities and social activities.
Walk Score
Walk Score: 84 / 100 Rank #68 / 872Walk Score — State benchmarkedThis home is ranked 68th out of 872 homes in Colorado. Shows how walkable this facility's neighborhood is compared to the average Walk Score across Colorado facilities. Higher scores benefit residents, families, and staff.Rankings are based only on facilities in Colorado that report data for that category. Facilities without available data are excluded from the ranking.Click the rank badge to see the full State ranking.Click here to see the full State ranking.
Very walkable. Most errands can be accomplished on foot, and many essentials are within a short walk.

About this community

Occupancy

Occupancy rate
63%
Rank #163 / 221Occupancy rate — State benchmarkedThis home is ranked 163rd out of 221 homes in Colorado. Shows this facility's occupancy rate versus the Colorado average, with its Statewide rank out of 221. Higher occupancy signals strong local demand and financial stability.Rankings are based only on facilities in Colorado that report data for that category. Facilities without available data are excluded from the ranking.Click the rank badge to see the full State ranking.Click here to see the full State ranking.
Lower than the Colorado average: 76.5%
Occupied beds
47 / 74
Average occupied beds in Colorado homes 72 beds

License Details

Facility TypeSkilled Nursing Facility / Nursing Facility Dual Certification
StatusActive

Ownership & Operating Entity

Hope Springs Care Center is administered by April Padilla.

Owner NameHope Springs Care Center, LLC

Contact Hope Springs Care Center

Penalties and fines

Federal penalties imposed by CMS for regulatory violations, including civil money penalties (fines) and denials of payment for new Medicare/Medicaid admissions.

Source: CMS Penalties Database

No penalties in the past 3 years

No civil money penalties or payment denials were reported in the last 3 years.

Quality of care over time

These measures show how residents usually do over time at this home, based on health outcomes and preventive care.

Short-stay resident measures
Average Info CMS star rating based on short-stay quality measure performance. 5 stars = much above average, 1 star = much below average.
Re-hospitalized after SNF stay Info Percentage of short-stay residents who were re-hospitalized after their nursing home admission. 25.8%
27% worse than State average

State average: 20.3%

Emergency department visits Info Percentage of short-stay residents who had an outpatient emergency department visit. 24.4%
91% worse than State average

State average: 12.8%

Falls with major injury Info Percentage of SNF residents who experience falls with major injury during their stay. 2.2%
188% worse than State average

State average: 0.8%

Ability to care for self at discharge Info Percentage of residents at or above expected ability to care for themselves at discharge. 66.7%
24% better than State average

State average: 53.7%

Successful return to home or community Info Rate of successful return to home or community from a skilled nursing facility. 55.2%
9% better than State average

State average: 50.6%

Breakdown by payment type

Medicare

38% of new residents, usually for short-term rehab.

Typical stay 25 days

Private pay

55% of new residents, often for short stays.

Typical stay 1 - 2 months

Medicaid

7% of new residents, often for long-term daily care.

Typical stay 3 - 4 years

Finances and operations

Based on CMS SNF Cost Report for fiscal year ending in 12/2023.

For-profit
Corporation
Net patient revenue Info Net patient revenue — what the home actually collects for resident care, after contractual allowances, bad debt and discounts are subtracted from its gross charges (CMS cost report, Worksheet G-3). It covers resident care only; money the home earns from other sources is shown separately as "Other income."
$5.8M
Net patient income Info Net patient income: net patient revenue minus the home's total operating expenses. A positive figure means it earns more from resident care than it spends to deliver it; a negative figure means the opposite. It excludes non-operating "other income."
-$1.2M
For-profit Corporation
Net patient revenue Info Net patient revenue — what the home actually collects for resident care, after contractual allowances, bad debt and discounts are subtracted from its gross charges (CMS cost report, Worksheet G-3). It covers resident care only; money the home earns from other sources is shown separately as "Other income."
$5.8M Rank #187 / 221Revenue — State benchmarkedThis home is ranked 187th out of 221 homes in Colorado. Shows this facility's annual revenue compared to the Colorado average. Higher revenue generally means more resources for staffing and capital — read alongside Payroll %.Rankings are based only on facilities in Colorado that report data for that category. Facilities without available data are excluded from the ranking.Click the rank badge to see the full State ranking.Click here to see the full State ranking.
Net patient income Info Net patient income: net patient revenue minus the home's total operating expenses. A positive figure means it earns more from resident care than it spends to deliver it; a negative figure means the opposite. It excludes non-operating "other income."
-$1.2M
Other income Info Money the home earns outside of resident care — such as investments, grants, rentals and other non-operating sources (CMS cost report, Worksheet G-3). It is tracked separately from net patient revenue: it is not part of that figure, and it is not included in net patient income.
$7.3K
Payroll costs Info Staff salaries plus wage-related costs — benefits such as payroll taxes, health insurance and retirement — from the home's own accounting records (CMS cost report, Worksheet A). Contract or agency labor is counted separately, under other operating costs. Rank #183 / 221Payroll — State benchmarkedThis home is ranked 183rd out of 221 homes in Colorado. Shows total annual staff payroll benchmarked to the Colorado average. Higher payroll investment relative to peers often signals better staffing and less reliance on cheaper contract labor.Rankings are based only on facilities in Colorado that report data for that category. Facilities without available data are excluded from the ranking.Click the rank badge to see the full State ranking.Click here to see the full State ranking.
$2.5M 43.4% of net patient revenue Info Payroll as a share of revenue: staff salaries and wage-related benefits divided by net patient revenue. A higher figure means more of each revenue dollar goes to staff pay. Rank #118 / 221Payroll % — State benchmarkedThis home is ranked 118th out of 221 homes in Colorado. Shows payroll as a percentage of revenue versus the Colorado average. Well-run Colorado facilities typically land around 59–66% — the top third Statewide. Below 25% may signal understaffing or heavy agency use — read with Staffing ratings.Rankings are based only on facilities in Colorado that report data for that category. Facilities without available data are excluded from the ranking.Click the rank badge to see the full State ranking.Click here to see the full State ranking.
Other operating costs Info Everything it costs to run the home apart from payroll — food, utilities, supplies, maintenance, contract labor and administration. Calculated as total operating expense minus payroll (staff salaries and wage-related benefits).
$4.4M
Total costs Info The home's total operating expense for the year — all the costs of running it, salaries included (CMS cost report, Worksheet G-3).
$6.9M

Who this home usually serves

TYPE OF STAY

Mix of rehab and long-term care

This home supports both short-term rehab and long-term care, with residents staying for a wide range of durations.

Most new residents arrive under private pay (55% of admissions), and a typical private pay stay runs around 1 - 2 months.

Admissions
128 total

Coverage residents most often arrive under.

Medicare 38%
Private pay 55%
Medicaid 7%
Discharges
142 total

Coverage residents most often leave under.

Medicare 28%
Private pay 52%
Medicaid 20%

Places of interest near Hope Springs Care Center

Address 0.0 miles from city center Info Estimated distance in miles from Montrose's city center to Hope Springs Care Center's address, calculated via Google Maps.

Calculate Travel Distance to Hope Springs Care Center

Add your location

Address

Compare Nursing Homes around the area

The information below is reported by the Colorado Department of Public Health and Environment, Health Facilities Division.

Brookdale Greenwood Village
NH
AL
IL
MC
Greenwood Village - 90 B- 71 Studio / 1 Bed / Semi-Private / Private
Life Care Center of Westminster
NH
Westminster (South Westminster) - 120 A+ 73 1 Bed / 2 Bed
Life Care Center of Colorado Springs
NH
Colorado Springs (Southeast Colorado Springs) - 121 A+ 63 -
Peaks Care Center
NH
AL
IL
Longmont (Coffman Street) - 92 A+ 80 -

Frequently Asked Questions about Hope Springs Care Center

Is Hope Springs Care Center in a walkable area?

Hope Springs Care Center has a walk score of 84. Very walkable. Most errands can be accomplished on foot, and many essentials are within a short walk.

What is the occupancy rate at Hope Springs Care Center?

Hope Springs Care Center's occupancy is 63%.

Does Hope Springs Care Center operate as a for-profit or non-profit?

Hope Springs Care Center is registered as a for-profit in CO.

Who is the administrator of Hope Springs Care Center?

April Padilla is the administrator of Hope Springs Care Center.

How many beds does Hope Springs Care Center have?

Hope Springs Care Center has 74 beds.

Are there photos of Hope Springs Care Center?

Yes — there are 5 photos of Hope Springs Care Center in the photo gallery on this page.

What is the address of Hope Springs Care Center?

Hope Springs Care Center is located at 1043 Ridge St, Montrose, Co 81401-.

Guides for Better Senior Living

Care Cost Calculator: See Prices in Your Area

Nursing Home Data Explorer

Don’t Wait Too Long: 7 Red Flag Signs Your Parent Needs Assisted Living Now

The True Cost of Assisted Living in 2025 – And How Families Are Paying For It

Understanding Senior Living Costs: Pricing Models, Discounts & Financial Assistance