Ignite Medical Resort Oklahoma City
Nursing Home, Nursing Care & Palliative Care · Oklahoma City, OK
CMS overall rating Info CMS (the Centers for Medicare & Medicaid Services) is the federal agency that rates nursing home quality. Its Overall Rating runs from 1 to 5 stars, combining health inspections, staffing, and quality measures, with inspections weighted most heavily.

Ignite Medical Resort Oklahoma City

Nursing Home, Nursing Care & Palliative Care · Oklahoma City, OK
CMS overall rating Info CMS (the Centers for Medicare & Medicaid Services) is the federal agency that rates nursing home quality. Its Overall Rating runs from 1 to 5 stars, combining health inspections, staffing, and quality measures, with inspections weighted most heavily.
Calculator: See prices in your area
Ignite Medical Resort Oklahoma City accepts Medicare and private pay.

Overview of Ignite Medical Resort Oklahoma City

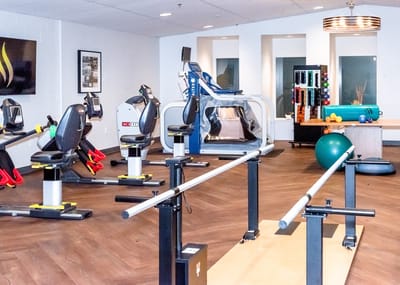
Enjoy a luxurious retirement with the prestigious senior living community of Ignite Medical Resort Oklahoma City set in the ethereal North Portland Avenue, Oklahoma City, OK, specializing in rehabilitation. Featuring innovative technologies, the community empowers seniors to cherish every moment of their best years. A team of competent and highly trained professionals works hard to provide top-tier care and assistance for seniors to flourish and live to their potential.

With resort-style amenities, residents experience a vacation-like retirement while meeting new friends and creating lasting moments. Indulge in diverse dining options that cater to dietary needs and preferences. Ignite Medical Resort Oklahoma City is committed to giving seniors the finest retirement experience with its beautiful campus surrounded by specially designed amenities and excellent services.

Quality ratings

Measured by Centers for Medicare & Medicaid Services (CMS)

Overall rating Info The Overall CMS Rating combines results from health inspections, staffing levels and quality measures. Health inspections carry the most weight. Staffing and quality scores can increase or decrease the final rating based on performance compared to state and national standards.
Health Inspection Info Based on the results of the facility's three most recent standard inspections and any complaint investigations. CMS reviews the number, scope, and severity of deficiencies, with more recent findings weighted more heavily.
Staffing Info Measures average nursing staff hours per resident per day, including Registered Nurses (RNs) and total nursing staff. Ratings are adjusted based on the level of care residents require and are compared to state and national benchmarks.
Quality Measures Info Based on clinical and physical health indicators reported to CMS, such as hospital readmissions, falls, pressure ulcers, and improvements in mobility. These measures reflect how well residents' health needs are being managed.

Staffing hours breakdown

Info Daily nursing hours per resident by staff type, reported to CMS. Higher is generally better — compare this facility to state and national averages to see where staffing stands.

Hours per resident per day — compared to state averages

Total nursing care / resident Info Total adjusted nursing hours per resident per day, combining RN, LPN, and aide time. CMS adjusts this for case-mix so facilities can be fairly compared.
3h 16m per day
Rank #49 / 51Nurse hours — State benchmarkedThis home is ranked 49th out of 51 homes in Oklahoma. Shows adjusted nurse hours per resident per day benchmarked to the Oklahoma average, with a ranking across 51 Oklahoma facilities. More hours mean more direct care. The national average is about 3.5 hrs; below 3.0 is a red flag.Rankings are based only on facilities in Oklahoma that report data for that category. Facilities without available data are excluded from the ranking.Click the rank badge to see the full State ranking.Click here to see the full State ranking.
vs avg

1 of 6 metrics below state avg

Standout metric Physical Therapist is +796% above state avg
Staff typeHours / Day / Residentvs state avg
Registered Nurse (RN) Info RNs hold the highest nursing license and can assess residents, interpret test results, and direct care plans. More RN hours per day often signals stronger clinical oversight and faster response to health changes. 32m per day ▲ 58% State avg: 20m per day · National avg: 41m per day
LPN / LVN Info Licensed Practical Nurses (LPNs) or Licensed Vocational Nurses (LVNs) deliver routine hands-on care — medication administration, wound dressing, and monitoring vital signs. They work under RN supervision and make up a large share of daily bedside care. 1h 47m per day ▲ 91% State avg: 56m per day · National avg: 52m per day
Nurse Aide Info Certified Nurse Aides (CNAs) provide the most direct day-to-day assistance: bathing, dressing, feeding, and mobility. Nurse aide hours are typically the largest staffing category and directly affect residents' quality of life. 2h 18m per day ▼ 10% State avg: 2h 34m per day · National avg: 2h 21m per day
Weekend Total Nursing Info Combined nursing hours (RN + LPN + Nurse Aide) per resident per day on weekends. Staffing often drops on weekends — this figure reveals whether the facility maintains adequate coverage outside of weekday hours. 4h 10m per day ▲ 20% State avg: 3h 29m per day · National avg: 3h 26m per day
Physical Therapist Info Hours per resident per day provided by licensed Physical Therapists (PTs) or PT Assistants. PT services help residents recover mobility after injury or illness and are especially important for post-acute (short-stay) rehabilitation. 9m per day ▲ 796% State avg: 1m per day · National avg: 4m per day
Weekend RN Info Registered nurse hours specifically on weekends. Facilities sometimes reduce RN presence on Saturdays and Sundays — a low weekend RN figure compared to weekday hours can indicate reduced clinical oversight when most administrative staff are absent. 29m per day ▲ 69% State avg: 17m per day · National avg: 29m per day

Capacity and availability

This home usually has limited availability

Similar occupancy to the state average
Occupancy rate
93.7% Rank #8 / 132Occupancy rate — State benchmarkedThis home is ranked 8th out of 132 homes in Oklahoma. Shows this facility's occupancy rate versus the Oklahoma average, with its Statewide rank out of 132. Higher occupancy signals strong local demand and financial stability.Rankings are based only on facilities in Oklahoma that report data for that category. Facilities without available data are excluded from the ranking.Click the rank badge to see the full State ranking.Click here to see the full State ranking.
Avg. Length of Stay
34 days
Bed community size
75-bed community Rank #57 / 141Bed count — State benchmarkedThis home is ranked 57th out of 141 homes in Oklahoma. Shows this facility's certified or reported bed count compared to other Oklahoma facilities. Larger communities may offer more amenities, programs, and on-site services for residents and families.Rankings are based only on facilities in Oklahoma that report data for that category. Facilities without available data are excluded from the ranking.Click the rank badge to see the full State ranking.Click here to see the full State ranking.
A moderately sized community that may balance personal attention with shared amenities and social activities.
Walk Score
Walk Score: 52 / 100 Rank #62 / 208Walk Score — State benchmarkedThis home is ranked 62nd out of 208 homes in Oklahoma. Shows how walkable this facility's neighborhood is compared to the average Walk Score across Oklahoma facilities. Higher scores benefit residents, families, and staff.Rankings are based only on facilities in Oklahoma that report data for that category. Facilities without available data are excluded from the ranking.Click the rank badge to see the full State ranking.Click here to see the full State ranking.
Moderately walkable. Some errands can be accomplished on foot, with a mix of nearby amenities.

Payment & Insurance

1 service
Accept Medicare

Therapy & Rehabilitation

3 services
Rehabilitation Services
Respite Care
Short-Term Rehab

Staffing & Medical

1 service
24-Hour Staffing

Amenities & Lifestyle

Starbucks Café
Onsite Restaurant With Executive Chef
Full-Service Spa
Onsite Chapel
Concierge Services
Specific ProgramsOrthopedic Rehabilitation, Stroke Recovery, Cardiac Care, Pulmonary Rehab, Infection Management, Renal Disease
Religious Services

Contact Ignite Medical Resort Oklahoma City

Staffing Data

Reporting period: October 1 – December 31, 2025 (Q4 2025). Source: CMS Payroll-Based Journal report.

Total staff 156
Employees 153
Contractors 3
Staff to resident ratio 2.17 : 1
0% compared with State average

State average ratio: 0 : 0

Avg staff/day 57
Average shift 7.5 hours
0% compared with State average

State average: 0 hours

Total staff hours (quarter) 39,442

Nursing staff breakdown

Q4 2025 · Oct 1 – Dec 31 More info This data comes from the CMS Payroll-Based Journal report covering October 1 – December 31, 2025.
Registered Nurse

Manages medical care and health needs.

RN Staff Info All 13 RN Staff are full-time employees. No contractors work on this role. 13
Average shift length Info Average shift length. Calculated as total hours divided by days worked and average staff per day. 7.5 hours
Licensed Practical Nurse

Assists with medical care and medications.

LPN Staff Info All 28 LPN Staff are full-time employees. No contractors work on this role. 28
Average shift length Info Average shift length. Calculated as total hours divided by days worked and average staff per day. 7.5 hours
Certified Nursing Assistant

Helps with daily care and mobility.

CNA Staff Info All 57 CNA Staff are full-time employees. No contractors work on this role. 57
Average shift length Info Average shift length. Calculated as total hours divided by days worked and average staff per day. 7.5 hours

Contractor staffing

Q4 2025 · Oct 1 – Dec 31 More info This data comes from the CMS Payroll-Based Journal report covering October 1 – December 31, 2025.

Total hours from contractors

0.3%

100 contractor hours this quarter

Clinical Nurse Specialist: 2 Occupational Therapy Aide: 1

Staff by category

Q4 2025 · Oct 1 – Dec 31 More info This data comes from the CMS Payroll-Based Journal report covering October 1 – December 31, 2025.
Certified Nursing Assistant5705712,07292100%7.5
Licensed Practical Nurse280287,74592100%7.5
RN Director of Nursing9093,9979098%8.4
Medication Aide/Technician130133,07892100%7.7
Registered Nurse130132,92992100%7.5
Speech Language Pathologist9092,5697582%7.1
Physical Therapy Aide8081,8677683%7.1
Dental Services Staff3031,1556975%7.5
Respiratory Therapy Technician4049847885%7.5
Physical Therapy Assistant2029327582%7.4
Qualified Social Worker4046366773%6
Administrator1015206571%8
Nurse Practitioner1015206571%8
Other Dietary Services Staff1013416065%5.7
Occupational Therapy Aide011842527%3.3
Clinical Nurse Specialist0221622%8
57 Certified Nursing Assistant
% of Days 100%
28 Licensed Practical Nurse
% of Days 100%
9 RN Director of Nursing
% of Days 98%
13 Medication Aide/Technician
% of Days 100%
13 Registered Nurse
% of Days 100%
9 Speech Language Pathologist
% of Days 82%
8 Physical Therapy Aide
% of Days 83%
3 Dental Services Staff
% of Days 75%
4 Respiratory Therapy Technician
% of Days 85%
2 Physical Therapy Assistant
% of Days 82%
4 Qualified Social Worker
% of Days 73%
1 Administrator
% of Days 71%
1 Nurse Practitioner
% of Days 71%
1 Other Dietary Services Staff
% of Days 65%
1 Occupational Therapy Aide
% of Days 27%
2 Clinical Nurse Specialist
% of Days 2%

Penalties and fines

Federal penalties imposed by CMS for regulatory violations, including civil money penalties (fines) and denials of payment for new Medicare/Medicaid admissions.

Source: CMS Penalties Database

No penalties in the past 3 years

No civil money penalties or payment denials were reported in the last 3 years.

Quality of care over time

These measures show how residents usually do over time at this home, based on health outcomes and preventive care.

Short-stay resident measures
Above average State avg: 2.9 Info CMS star rating based on short-stay quality measure performance. 5 stars = much above average, 1 star = much below average.
Pneumococcal Vaccine Info Percent of short-stay residents assessed and appropriately given the pneumococcal vaccine 90.5%
21% better than State average

State average: 75.0%

Antipsychotic medication increase Info Percent of short-stay residents who newly received an antipsychotic medication 1.0%
52% better than State average

State average: 2.0%

Influenza Vaccine Info Percent of short-stay residents assessed and appropriately given the seasonal influenza vaccine 74.6%
In line with State average

State average: 74.0%

Re-hospitalized after SNF stay Info Percentage of short-stay residents who were re-hospitalized after their nursing home admission. 23.4%
13% better than State average

State average: 27.0%

Emergency department visits Info Percentage of short-stay residents who had an outpatient emergency department visit. 16.0%
6% better than State average

State average: 17.1%

Falls with major injury Info Percentage of SNF residents who experience falls with major injury during their stay. 0.2%
73% better than State average

State average: 0.8%

Ability to care for self at discharge Info Percentage of residents at or above expected ability to care for themselves at discharge. 60.4%
12% better than State average

State average: 53.7%

Successful return to home or community Info Rate of successful return to home or community from a skilled nursing facility. 65.2%
29% better than State average

State average: 50.6%

Breakdown by payment type

Medicare

74% of new residents, usually for short-term rehab.

Typical stay 25 days

Private pay

26% of new residents, often for short stays.

Typical stay 1 - 2 months

Facility Characteristics

Source: CMS Long-Term Care Facility Characteristics (Data as of Jan 2026)

Total residents 72
Medicare
40
55.6% of residents
Private pay or other
32
44.4% of residents
Programs & Services
Residents Group

Residents meet regularly to discuss policies, care quality, and activities

Active Resident Council

Organized group of residents that meets regularly to discuss facility policies, quality of life, and activities.

Finances and operations

Based on CMS SNF Cost Report for fiscal year ending in 12/2023.

For-profit
Corporation
Net patient revenue Info Net patient revenue — what the home actually collects for resident care, after contractual allowances, bad debt and discounts are subtracted from its gross charges (CMS cost report, Worksheet G-3). It covers resident care only; money the home earns from other sources is shown separately as "Other income."
$15.1M
Net patient income Info Net patient income: net patient revenue minus the home's total operating expenses. A positive figure means it earns more from resident care than it spends to deliver it; a negative figure means the opposite. It excludes non-operating "other income."
-$55.2K
For-profit Corporation
Net patient revenue Info Net patient revenue — what the home actually collects for resident care, after contractual allowances, bad debt and discounts are subtracted from its gross charges (CMS cost report, Worksheet G-3). It covers resident care only; money the home earns from other sources is shown separately as "Other income."
$15.1M Rank #9 / 55Revenue — State benchmarkedThis home is ranked 9th out of 55 homes in Oklahoma. Shows this facility's annual revenue compared to the Oklahoma average. Higher revenue generally means more resources for staffing and capital — read alongside Payroll %.Rankings are based only on facilities in Oklahoma that report data for that category. Facilities without available data are excluded from the ranking.Click the rank badge to see the full State ranking.Click here to see the full State ranking.
Net patient income Info Net patient income: net patient revenue minus the home's total operating expenses. A positive figure means it earns more from resident care than it spends to deliver it; a negative figure means the opposite. It excludes non-operating "other income."
-$55.2K
Other income Info Money the home earns outside of resident care — such as investments, grants, rentals and other non-operating sources (CMS cost report, Worksheet G-3). It is tracked separately from net patient revenue: it is not part of that figure, and it is not included in net patient income.
$48.3K
Payroll costs Info Staff salaries plus wage-related costs — benefits such as payroll taxes, health insurance and retirement — from the home's own accounting records (CMS cost report, Worksheet A). Contract or agency labor is counted separately, under other operating costs. Rank #10 / 55Payroll — State benchmarkedThis home is ranked 10th out of 55 homes in Oklahoma. Shows total annual staff payroll benchmarked to the Oklahoma average. Higher payroll investment relative to peers often signals better staffing and less reliance on cheaper contract labor.Rankings are based only on facilities in Oklahoma that report data for that category. Facilities without available data are excluded from the ranking.Click the rank badge to see the full State ranking.Click here to see the full State ranking.
$6.1M 40.2% of net patient revenue Info Payroll as a share of revenue: staff salaries and wage-related benefits divided by net patient revenue. A higher figure means more of each revenue dollar goes to staff pay. Rank #45 / 55Payroll % — State benchmarkedThis home is ranked 45th out of 55 homes in Oklahoma. Shows payroll as a percentage of revenue versus the Oklahoma average. Well-run Oklahoma facilities typically land around 55–61% — the top third Statewide. Below 25% may signal understaffing or heavy agency use — read with Staffing ratings.Rankings are based only on facilities in Oklahoma that report data for that category. Facilities without available data are excluded from the ranking.Click the rank badge to see the full State ranking.Click here to see the full State ranking.
Other operating costs Info Everything it costs to run the home apart from payroll — food, utilities, supplies, maintenance, contract labor and administration. Calculated as total operating expense minus payroll (staff salaries and wage-related benefits).
$9.1M
Total costs Info The home's total operating expense for the year — all the costs of running it, salaries included (CMS cost report, Worksheet G-3).
$15.2M

What does this home offer?

Building type icon
Building type icon

Building Type: Single-story

Who this home usually serves

TYPE OF STAY

Mostly short-term rehab stays

Most residents typically stay for a few weeks or months before returning home or moving on.

Most new residents arrive under Medicare (74% of admissions), and a typical Medicare stay runs around 25 days.

Admissions
921 total

Coverage residents most often arrive under.

Medicare 74%
Private pay 26%
Discharges
764 total

Coverage residents most often leave under.

Medicare 70%
Private pay 29%
Medicaid 1%

Places of interest near Ignite Medical Resort Oklahoma City

Address 5.8 miles from city center Info Estimated distance in miles from Oklahoma City's city center to Ignite Medical Resort Oklahoma City's address, calculated via Google Maps.

Calculate Travel Distance to Ignite Medical Resort Oklahoma City

Add your location

Address

Compare Nursing Homes around Oklahoma

The information below is reported by the Oklahoma State Department of Health, Protective Health Services.

Ignite Medical Resort Oklahoma City
NH
NC
PC
Oklahoma City (Central Oklahoma City) -75 - 52 -
St. Ann‘s Skilled Nursing & Therapy
NH
Oklahoma City (Eagle Hill) -120 - 28 -
Wilshire Nursing Skilled and Therapy
NH
NC
Oklahoma City (Northeast Oklahoma City) -56 - 12 -
Bellevue Health & Rehab Center
NH
HC
NC
PC
Oklahoma City (Central Oklahoma City) -142 - 44 -
Parc Place Medical Resort
NH
AL
IL
MC
Oklahoma City (Northeast Oklahoma City) -73 - 31 -

Frequently Asked Questions about Ignite Medical Resort Oklahoma City

What neighborhood is Ignite Medical Resort Oklahoma City in?

Ignite Medical Resort Oklahoma City is in the Central Oklahoma City neighborhood.

Is Ignite Medical Resort Oklahoma City in a walkable area?

Ignite Medical Resort Oklahoma City has a walk score of 52. Moderately walkable. Some errands can be accomplished on foot, with a mix of nearby amenities.

What is the occupancy rate at Ignite Medical Resort Oklahoma City?

Ignite Medical Resort Oklahoma City's occupancy is 93.7%.

Does Ignite Medical Resort Oklahoma City operate as a for-profit or non-profit?

Ignite Medical Resort Oklahoma City is registered as a for-profit.

Are there photos of Ignite Medical Resort Oklahoma City?

Yes — there are 4 photos of Ignite Medical Resort Oklahoma City in the photo gallery on this page.

What is the address of Ignite Medical Resort Oklahoma City?

Ignite Medical Resort Oklahoma City is located at 6312 N Portland Ave, Oklahoma City, OK 73112.

What is the phone number of Ignite Medical Resort Oklahoma City?

(405) 946-6932 will put you in contact with the team at Ignite Medical Resort Oklahoma City.

Guides for Better Senior Living

Care Cost Calculator: See Prices in Your Area

Nursing Home Data Explorer

Don’t Wait Too Long: 7 Red Flag Signs Your Parent Needs Assisted Living Now

The True Cost of Assisted Living in 2025 – And How Families Are Paying For It

Understanding Senior Living Costs: Pricing Models, Discounts & Financial Assistance