Wilshire Nursing Skilled and Therapy
Nursing Home & Nursing Care · Oklahoma City, OK
CMS overall rating Info CMS (the Centers for Medicare & Medicaid Services) is the federal agency that rates nursing home quality. Its Overall Rating runs from 1 to 5 stars, combining health inspections, staffing, and quality measures, with inspections weighted most heavily.

Wilshire Nursing Skilled and Therapy

Nursing Home & Nursing Care · Oklahoma City, OK
CMS overall rating Info CMS (the Centers for Medicare & Medicaid Services) is the federal agency that rates nursing home quality. Its Overall Rating runs from 1 to 5 stars, combining health inspections, staffing, and quality measures, with inspections weighted most heavily.
Calculator: See prices in your area
Wilshire Nursing Skilled and Therapy accepts Medicare, Medicaid, and private pay.

Overview of Wilshire Nursing Skilled and Therapy

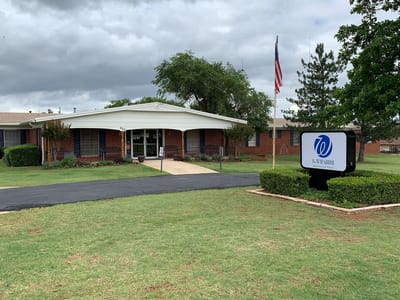
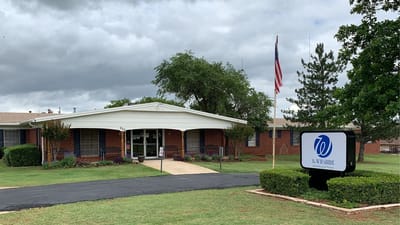
Enjoy unrivaled care and support with the outstanding senior living community of Wilshire Nursing Skilled and Therapy in East Wilshire Boulevard, Oklahoma City, OK providing nursing services and therapy. The community features a variety of care services including cardiac, catheter, and colostomy care, diabetes management, and wound care, among others. Let go of your woes with a team of competent and highly trained professionals attending to your special needs and aspirations.

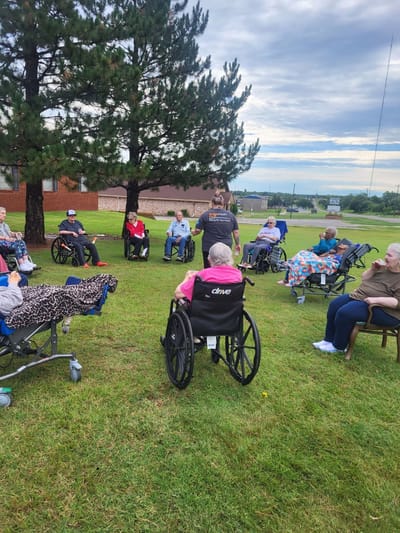
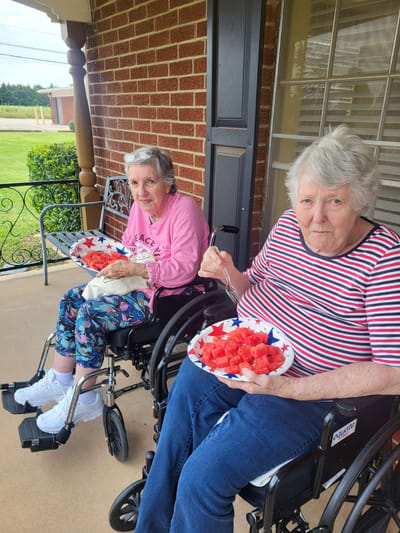
Fill your days with happiness and keep an active lifestyle through enjoyable activities and exciting events. Prioritizing residents’ dietary needs and tastes, the community prepares healthy and delicious meals approved by dietitians. Wilshire Nursing Skilled and Therapy strives to improve seniors’ well-being with excellent services and extensive amenities.

Quality ratings

Measured by Centers for Medicare & Medicaid Services (CMS)

Overall rating Info The Overall CMS Rating combines results from health inspections, staffing levels and quality measures. Health inspections carry the most weight. Staffing and quality scores can increase or decrease the final rating based on performance compared to state and national standards.
Health Inspection Info Based on the results of the facility's three most recent standard inspections and any complaint investigations. CMS reviews the number, scope, and severity of deficiencies, with more recent findings weighted more heavily.
Staffing Info Measures average nursing staff hours per resident per day, including Registered Nurses (RNs) and total nursing staff. Ratings are adjusted based on the level of care residents require and are compared to state and national benchmarks.
Quality Measures Info Based on clinical and physical health indicators reported to CMS, such as hospital readmissions, falls, pressure ulcers, and improvements in mobility. These measures reflect how well residents' health needs are being managed.

Staffing hours breakdown

Info Daily nursing hours per resident by staff type, reported to CMS. Higher is generally better — compare this facility to state and national averages to see where staffing stands.

Hours per resident per day — compared to state averages

Total nursing care / resident Info Total adjusted nursing hours per resident per day, combining RN, LPN, and aide time. CMS adjusts this for case-mix so facilities can be fairly compared.
4h 50m per day
Rank #21 / 51Nurse hours — State benchmarkedThis home is ranked 21st out of 51 homes in Oklahoma. Shows adjusted nurse hours per resident per day benchmarked to the Oklahoma average, with a ranking across 51 Oklahoma facilities. More hours mean more direct care. The national average is about 3.5 hrs; below 3.0 is a red flag.Rankings are based only on facilities in Oklahoma that report data for that category. Facilities without available data are excluded from the ranking.Click the rank badge to see the full State ranking.Click here to see the full State ranking.
vs avg

4 of 6 metrics below state avg

Standout metric Weekend RN is +54% above state avg
Staff type Hours / Day / Resident vs state avg
Registered Nurse (RN) Info RNs hold the highest nursing license and can assess residents, interpret test results, and direct care plans. More RN hours per day often signals stronger clinical oversight and faster response to health changes. 29m per day ▲ 43% State avg: 20m per day · National avg: 41m per day
LPN / LVN Info Licensed Practical Nurses (LPNs) or Licensed Vocational Nurses (LVNs) deliver routine hands-on care — medication administration, wound dressing, and monitoring vital signs. They work under RN supervision and make up a large share of daily bedside care. 49m per day ▼ 13% State avg: 56m per day · National avg: 52m per day
Nurse Aide Info Certified Nurse Aides (CNAs) provide the most direct day-to-day assistance: bathing, dressing, feeding, and mobility. Nurse aide hours are typically the largest staffing category and directly affect residents' quality of life. 2h 28m per day ▼ 4% State avg: 2h 34m per day · National avg: 2h 21m per day
Weekend Total Nursing Info Combined nursing hours (RN + LPN + Nurse Aide) per resident per day on weekends. Staffing often drops on weekends — this figure reveals whether the facility maintains adequate coverage outside of weekday hours. 3h 22m per day ▼ 3% State avg: 3h 29m per day · National avg: 3h 26m per day
Physical Therapist Info Hours per resident per day provided by licensed Physical Therapists (PTs) or PT Assistants. PT services help residents recover mobility after injury or illness and are especially important for post-acute (short-stay) rehabilitation. 1m per day ▼ 28% State avg: 1m per day · National avg: 4m per day
Weekend RN Info Registered nurse hours specifically on weekends. Facilities sometimes reduce RN presence on Saturdays and Sundays — a low weekend RN figure compared to weekday hours can indicate reduced clinical oversight when most administrative staff are absent. 26m per day ▲ 54% State avg: 17m per day · National avg: 29m per day

Capacity and availability

This home usually has availability

Lower occupancy than the state average
Occupancy rate
41.1% Rank #129 / 132Occupancy rate — State benchmarkedThis home is ranked 129th out of 132 homes in Oklahoma. Shows this facility's occupancy rate versus the Oklahoma average, with its Statewide rank out of 132. Higher occupancy signals strong local demand and financial stability.Rankings are based only on facilities in Oklahoma that report data for that category. Facilities without available data are excluded from the ranking.Click the rank badge to see the full State ranking.Click here to see the full State ranking.
Avg. Length of Stay
112 days
Bed community size
56-bed community Rank #88 / 141Bed count — State benchmarkedThis home is ranked 88th out of 141 homes in Oklahoma. Shows this facility's certified or reported bed count compared to other Oklahoma facilities. Larger communities may offer more amenities, programs, and on-site services for residents and families.Rankings are based only on facilities in Oklahoma that report data for that category. Facilities without available data are excluded from the ranking.Click the rank badge to see the full State ranking.Click here to see the full State ranking.
A moderately sized community that may balance personal attention with shared amenities and social activities.
Walk Score
Walk Score: 12 / 100 Rank #173 / 208Walk Score — State benchmarkedThis home is ranked 173rd out of 208 homes in Oklahoma. Shows how walkable this facility's neighborhood is compared to the average Walk Score across Oklahoma facilities. Higher scores benefit residents, families, and staff.Rankings are based only on facilities in Oklahoma that report data for that category. Facilities without available data are excluded from the ranking.Click the rank badge to see the full State ranking.Click here to see the full State ranking.
Car-dependent. Most errands require a car, with limited nearby walkable options.

Payment & Insurance

2 services
Accept Medicaid
Accept Medicare

Therapy & Rehabilitation

2 services
Rehabilitation Services
Respite Care

Staffing & Medical

2 services
Doctor on Staff
24-Hour Staffing

Amenities & Lifestyle

Specific ProgramsSkilled Nursing & Therapy, Therapy Services, Physician Services, Housekeeping & Laundry, 24/7 Care, Dietary Services, Medical Transportation
Touring HoursMo 00:00-00:00, Tu 00:00-00:00, We 00:00-00:00, Th 00:00-00:00, Fr 00:00-00:00, Sa 00:00-00:00, Su 00:00-00:00

Contact Wilshire Nursing Skilled and Therapy

Staffing Data

Reporting period: October 1 – December 31, 2025 (Q4 2025). Source: CMS Payroll-Based Journal report.

Total staff 92
Employees 57
Contractors 35
Staff to resident ratio 3.17 : 1
0% compared with State average

State average ratio: 0 : 0

Avg staff/day 21
Average shift 7.3 hours
0% compared with State average

State average: 0 hours

Total staff hours (quarter) 14,019

Nursing staff breakdown

Q4 2025 · Oct 1 – Dec 31 More info This data comes from the CMS Payroll-Based Journal report covering October 1 – December 31, 2025.
Registered Nurse

Manages medical care and health needs.

RN Staff Info All 7 RN Staff are full-time employees. No contractors work on this role. 7
Average shift length Info Average shift length. Calculated as total hours divided by days worked and average staff per day. 9.2 hours
Licensed Practical Nurse

Assists with medical care and medications.

LPN Staff Info 20 total: 16 full-time employees and 4 contractors. 20
Average shift length Info Average shift length. Calculated as total hours divided by days worked and average staff per day. 7.8 hours
Certified Nursing Assistant

Helps with daily care and mobility.

CNA Staff Info 29 total: 22 full-time employees and 7 contractors. 29
Average shift length Info Average shift length. Calculated as total hours divided by days worked and average staff per day. 7.7 hours

Contractor staffing

Q4 2025 · Oct 1 – Dec 31 More info This data comes from the CMS Payroll-Based Journal report covering October 1 – December 31, 2025.

Total hours from contractors

11%

1,537 contractor hours this quarter

Certified Nursing Assistant: 7 Respiratory Therapy Technician: 6 Physical Therapy Assistant: 6 Licensed Practical Nurse: 4 Medication Aide/Technician: 4 Respiratory Therapist: 3 Therapeutic Recreation Specialist: 2 Occupational Therapy Assistant: 2 Qualified Social Worker: 1

Staff by category

Q4 2025 · Oct 1 – Dec 31 More info This data comes from the CMS Payroll-Based Journal report covering October 1 – December 31, 2025.
Certified Nursing Assistant 22 7 29 6,211 92 100% 7.7
Licensed Practical Nurse 16 4 20 1,968 92 100% 7.8
Medication Aide/Technician 5 4 9 1,900 92 100% 9.6
Registered Nurse 7 0 7 1,099 85 92% 9.2
RN Director of Nursing 2 0 2 704 64 70% 7.7
Administrator 1 0 1 528 66 72% 8
Nurse Practitioner 1 0 1 474 61 66% 7.8
Dietitian 2 0 2 455 45 49% 7.8
Occupational Therapy Assistant 0 2 2 208 26 28% 8
Mental Health Service Worker 1 0 1 205 24 26% 8.5
Therapeutic Recreation Specialist 0 2 2 69 61 66% 1.1
Respiratory Therapist 0 3 3 68 59 64% 1.2
Qualified Social Worker 0 1 1 52 27 29% 1.9
Physical Therapy Assistant 0 6 6 40 19 21% 2.1
Respiratory Therapy Technician 0 6 6 39 19 21% 2.1
29 Certified Nursing Assistant
% of Days 100%
20 Licensed Practical Nurse
% of Days 100%
9 Medication Aide/Technician
% of Days 100%
7 Registered Nurse
% of Days 92%
2 RN Director of Nursing
% of Days 70%
1 Administrator
% of Days 72%
1 Nurse Practitioner
% of Days 66%
2 Dietitian
% of Days 49%
2 Occupational Therapy Assistant
% of Days 28%
1 Mental Health Service Worker
% of Days 26%
2 Therapeutic Recreation Specialist
% of Days 66%
3 Respiratory Therapist
% of Days 64%
1 Qualified Social Worker
% of Days 29%
6 Physical Therapy Assistant
% of Days 21%
6 Respiratory Therapy Technician
% of Days 21%

Penalties and fines

Federal penalties imposed by CMS for regulatory violations, including civil money penalties (fines) and denials of payment for new Medicare/Medicaid admissions.

Source: CMS Penalties Database

No penalties in the past 3 years

No civil money penalties or payment denials were reported in the last 3 years.

Quality of care over time

These measures show how residents usually do over time at this home, based on health outcomes and preventive care.

High-risk clinical events score Info A composite score based on pressure ulcers, falls with injury, weight loss, walking ability decline, and activities of daily living decline. 5.6
37% better than State average

State average: 8.9

Functional decline score Info A composite score based on activities of daily living decline, walking ability decline, and incontinence. 14.6
11% better than State average

State average: 16.3

Long-stay resident measures
Average State avg: 3.7 Info CMS star rating based on long-stay quality measure performance. 5 stars = significantly above average, 1 star = significantly below average.
Need for Help with Daily Activities Increased Info Percent of long-stay residents whose need for help with daily activities has increased 3.7%
74% better than State average

State average: 14.4%

Walking Ability Worsened Info Percent of long-stay residents whose ability to move independently worsened 7.9%
53% better than State average

State average: 16.8%

Low Risk Residents with Bowel/Bladder Incontinence Info Percent of low risk long-stay residents who lose control of their bowels or bladder 32.1%
81% worse than State average

State average: 17.8%

Falls with Major Injury Info Percent of long-stay residents experiencing one or more falls with major injury 8.4%
92% worse than State average

State average: 4.4%

High Risk Residents with Pressure Ulcers Info Percent of long-stay high risk residents with pressure ulcers 6.8%
30% worse than State average

State average: 5.2%

Urinary Tract Infection Info Percent of long-stay residents with a urinary tract infection 0.0%
100% better than State average

State average: 3.0%

Lost Too Much Weight Info Percent of long-stay residents who lose too much weight 1.2%
67% better than State average

State average: 3.7%

Depressive Symptoms Info Percent of long-stay residents who have depressive symptoms 1.2%
64% better than State average

State average: 3.3%

Antipsychotic Use Info Percent of long-stay residents who received an antipsychotic medication 22.1%
42% worse than State average

State average: 15.5%

Pneumococcal Vaccine Info Percent of long-stay residents assessed and appropriately given the pneumococcal vaccine 93.7%
In line with State average

State average: 90.6%

Influenza Vaccine Info Percent of long-stay residents assessed and appropriately given the seasonal influenza vaccine 96.2%
In line with State average

State average: 94.6%

Short-stay resident measures
Below average State avg: 2.9 Info CMS star rating based on short-stay quality measure performance. 5 stars = much above average, 1 star = much below average.
Pneumococcal Vaccine Info Percent of short-stay residents assessed and appropriately given the pneumococcal vaccine 88.8%
18% better than State average

State average: 75.0%

Antipsychotic medication increase Info Percent of short-stay residents who newly received an antipsychotic medication 0.0%
100% better than State average

State average: 2.0%

Influenza Vaccine Info Percent of short-stay residents assessed and appropriately given the seasonal influenza vaccine 86.0%
16% better than State average

State average: 74.0%

Re-hospitalized after SNF stay Info Percentage of short-stay residents who were re-hospitalized after their nursing home admission. 23.8%
12% better than State average

State average: 27.0%

Emergency department visits Info Percentage of short-stay residents who had an outpatient emergency department visit. 23.9%
40% worse than State average

State average: 17.1%

Falls with major injury Info Percentage of SNF residents who experience falls with major injury during their stay. 0.0%
100% better than State average

State average: 0.8%

Breakdown by payment type

Medicare

33% of new residents, usually for short-term rehab.

Typical stay 20 days

Private pay

46% of new residents, often for short stays.

Typical stay 1 - 2 months

Medicaid

20% of new residents, often for long-term daily care.

Typical stay 1 - 2 years

Facility Characteristics

Source: CMS Long-Term Care Facility Characteristics (Data as of Jan 2026)

Total residents 29
Medicaid
24
82.8% of residents
Private pay or other
5
17.2% of residents
Programs & Services
Residents Group

Residents meet regularly to discuss policies, care quality, and activities

Active Resident Council

Organized group of residents that meets regularly to discuss facility policies, quality of life, and activities.

Finances and operations

Based on CMS SNF Cost Report for fiscal year ending in 12/2023.

For-profit
Operated by a business corporation.
Net patient revenue Info Net patient revenue — what the home actually collects for resident care, after contractual allowances, bad debt and discounts are subtracted from its gross charges (CMS cost report, Worksheet G-3). It covers resident care only; money the home earns from other sources is shown separately as "Other income."
$2.3M
Net patient income Info Net patient income: net patient revenue minus the home's total operating expenses. A positive figure means it earns more from resident care than it spends to deliver it; a negative figure means the opposite. It excludes non-operating "other income."
-$124.8K
For-profit Operated by a business corporation.
Net patient revenue Info Net patient revenue — what the home actually collects for resident care, after contractual allowances, bad debt and discounts are subtracted from its gross charges (CMS cost report, Worksheet G-3). It covers resident care only; money the home earns from other sources is shown separately as "Other income."
$2.3M Rank #53 / 55Revenue — State benchmarkedThis home is ranked 53rd out of 55 homes in Oklahoma. Shows this facility's annual revenue compared to the Oklahoma average. Higher revenue generally means more resources for staffing and capital — read alongside Payroll %.Rankings are based only on facilities in Oklahoma that report data for that category. Facilities without available data are excluded from the ranking.Click the rank badge to see the full State ranking.Click here to see the full State ranking.
Net patient income Info Net patient income: net patient revenue minus the home's total operating expenses. A positive figure means it earns more from resident care than it spends to deliver it; a negative figure means the opposite. It excludes non-operating "other income."
-$124.8K
Other income Info Money the home earns outside of resident care — such as investments, grants, rentals and other non-operating sources (CMS cost report, Worksheet G-3). It is tracked separately from net patient revenue: it is not part of that figure, and it is not included in net patient income.
$63
Payroll costs Info Staff salaries plus wage-related costs — benefits such as payroll taxes, health insurance and retirement — from the home's own accounting records (CMS cost report, Worksheet A). Contract or agency labor is counted separately, under other operating costs. Rank #53 / 55Payroll — State benchmarkedThis home is ranked 53rd out of 55 homes in Oklahoma. Shows total annual staff payroll benchmarked to the Oklahoma average. Higher payroll investment relative to peers often signals better staffing and less reliance on cheaper contract labor.Rankings are based only on facilities in Oklahoma that report data for that category. Facilities without available data are excluded from the ranking.Click the rank badge to see the full State ranking.Click here to see the full State ranking.
$1.6M 68.4% of net patient revenue Info Payroll as a share of revenue: staff salaries and wage-related benefits divided by net patient revenue. A higher figure means more of each revenue dollar goes to staff pay. Rank #4 / 55Payroll % — State benchmarkedThis home is ranked 4th out of 55 homes in Oklahoma. Shows payroll as a percentage of revenue versus the Oklahoma average. Well-run Oklahoma facilities typically land around 55–61% — the top third Statewide. Below 25% may signal understaffing or heavy agency use — read with Staffing ratings.Rankings are based only on facilities in Oklahoma that report data for that category. Facilities without available data are excluded from the ranking.Click the rank badge to see the full State ranking.Click here to see the full State ranking.
Other operating costs Info Everything it costs to run the home apart from payroll — food, utilities, supplies, maintenance, contract labor and administration. Calculated as total operating expense minus payroll (staff salaries and wage-related benefits).
$849.3K
Total costs Info The home's total operating expense for the year — all the costs of running it, salaries included (CMS cost report, Worksheet G-3).
$2.4M

What does this home offer?

Building type icon
Building type icon

Building Type: Single-story

Who this home usually serves

TYPE OF STAY

Mix of rehab and long-term care

This home supports both short-term rehab and long-term care, with residents staying for a wide range of durations.

New residents most often arrive under private pay (46% of admissions), and a typical private pay stay runs around 1 - 2 months.

Admissions
69 total

Coverage residents most often arrive under.

Medicare 33%
Private pay 46%
Medicaid 20%
Discharges
75 total

Coverage residents most often leave under.

Medicare 49%
Private pay 51%

Places of interest near Wilshire Nursing Skilled and Therapy

Address 5.8 miles from city center Info Estimated distance in miles from Oklahoma City's city center to Wilshire Nursing Skilled and Therapy's address, calculated via Google Maps.

Calculate Travel Distance to Wilshire Nursing Skilled and Therapy

Add your location

Address

Compare Nursing Homes around Oklahoma

The information below is reported by the Oklahoma State Department of Health, Protective Health Services.

Wilshire Nursing Skilled and Therapy
NH
NC
Oklahoma City (Northeast Oklahoma City) - 56 - 12 -
St. Ann‘s Skilled Nursing & Therapy
NH
Oklahoma City (Eagle Hill) - 120 - 28 -
Ignite Medical Resort Oklahoma City
NH
NC
PC
Oklahoma City (Central Oklahoma City) - 75 - 52 -
Bellevue Health & Rehab Center
NH
HC
NC
PC
Oklahoma City (Central Oklahoma City) - 142 - 44 -
Parc Place Medical Resort
NH
AL
IL
MC
Oklahoma City (Northeast Oklahoma City) - 73 - 31 -

Frequently Asked Questions about Wilshire Nursing Skilled and Therapy

What neighborhood is Wilshire Nursing Skilled and Therapy in?

Wilshire Nursing Skilled and Therapy is in the Northeast Oklahoma City neighborhood.

Is Wilshire Nursing Skilled and Therapy in a walkable area?

Wilshire Nursing Skilled and Therapy has a walk score of 12. Car-dependent. Most errands require a car, with limited nearby walkable options.

What is the occupancy rate at Wilshire Nursing Skilled and Therapy?

Wilshire Nursing Skilled and Therapy's occupancy is 41.1%.

Does Wilshire Nursing Skilled and Therapy operate as a for-profit or non-profit?

Wilshire Nursing Skilled and Therapy is registered as a for-profit.

Are there photos of Wilshire Nursing Skilled and Therapy?

Yes — there are 7 photos of Wilshire Nursing Skilled and Therapy in the photo gallery on this page.

What is the address of Wilshire Nursing Skilled and Therapy?

Wilshire Nursing Skilled and Therapy is located at 505 E Wilshire Blvd, Oklahoma City, Ok 73114, Usa.

What is the phone number of Wilshire Nursing Skilled and Therapy?

(405) 478-0531 will put you in contact with the team at Wilshire Nursing Skilled and Therapy.

Guides for Better Senior Living

Care Cost Calculator: See Prices in Your Area

Nursing Home Data Explorer

Don’t Wait Too Long: 7 Red Flag Signs Your Parent Needs Assisted Living Now

The True Cost of Assisted Living in 2025 – And How Families Are Paying For It

Understanding Senior Living Costs: Pricing Models, Discounts & Financial Assistance