Explore Open Rooms

1 Contact details
2 What type of senior care service are you looking for?
3 What budget do you have in mind for senior care?
4 How soon do you need to find care?
5 Additional details

Thank you for your interest!

Our team will be in touch shortly to help with next steps.

Nursing Home

Immanuel Campus of Care

Nursing Home

Immanuel Campus of Care

11301 N 99th Ave, Peoria, AZ 85345 View map
Overview of Immanuel Campus of Care

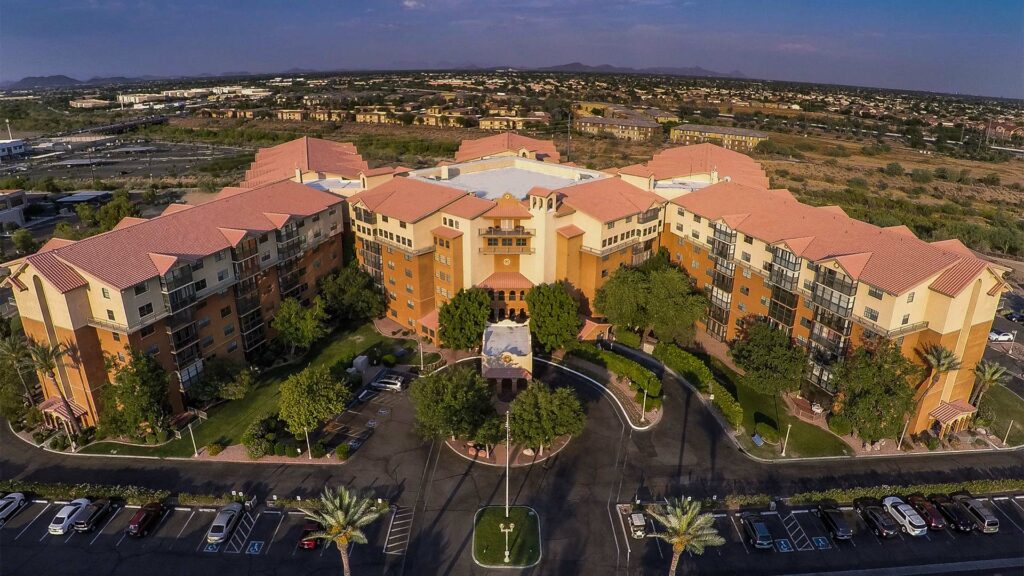
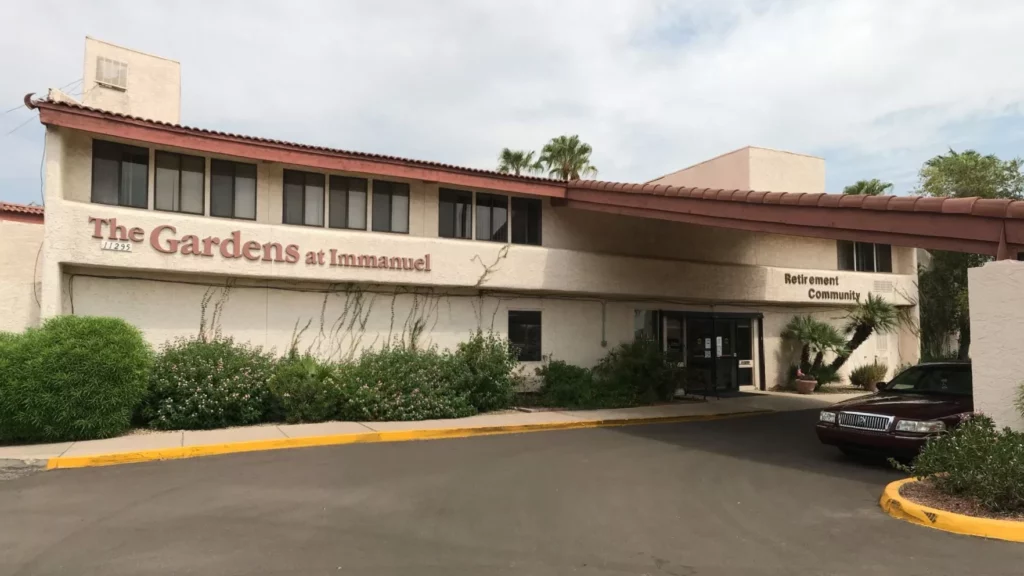
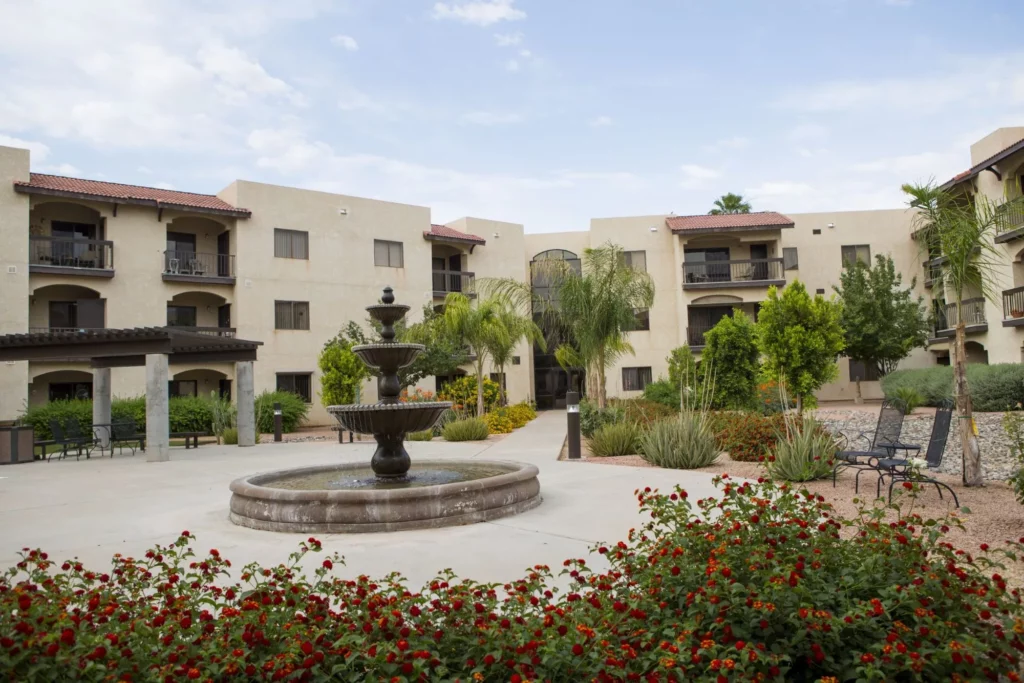
A community with unparalleled care for memory care, assisted living, skilled nursing, and rehabilitative care, Immanuel Campus of Care is delivered with integrity and respect for its seniors. The resident-focused community focuses on conducting results-driven programs with cutting-edge technologies that specifically cater to the varying needs of the residents. For over 25 years, the retirement home has been committed to providing seniors with a safe and comfortable environment for a transformative experience.

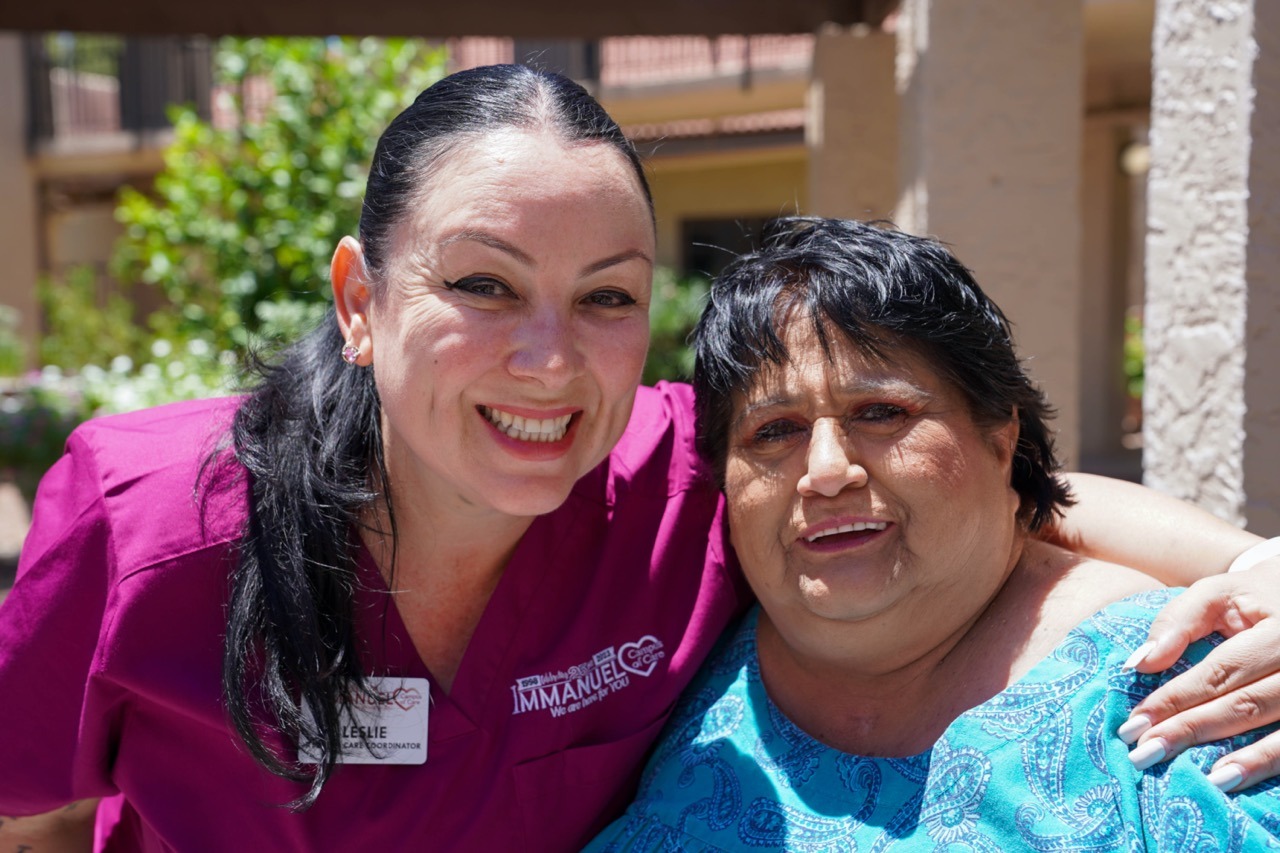
Immanuel’s nursing home care services include pain management, diabetes management, restorative nursing, wound care, and a team of 24/7 nurses. Assisted living and memory care services include ADLS, medication management, stimulating activities, and enriching programs.

(623) 977-8373

Quality ratings

Measured by Centers for Medicare & Medicaid Services (CMS)

Overall rating Info The Overall CMS Rating combines results from health inspections, staffing levels and quality measures. Health inspections carry the most weight. Staffing and quality scores can increase or decrease the final rating based on performance compared to state and national standards.
2/5
Arizona average: 3.5/5
Health Inspection Info Based on the results of the facility's three most recent standard inspections and any complaint investigations. CMS reviews the number, scope, and severity of deficiencies, with more recent findings weighted more heavily.
1/5
Arizona average: 2.8/5
Staffing Info Measures average nursing staff hours per resident per day, including Registered Nurses (RNs) and total nursing staff. Ratings are adjusted based on the level of care residents require and are compared to state and national benchmarks.
5/5
Arizona average: 3.5/5
Quality Measures Info Based on clinical and physical health indicators reported to CMS, such as hospital readmissions, falls, pressure ulcers, and improvements in mobility. These measures reflect how well residents' health needs are being managed.
5/5
Arizona average: 4.6/5

Nursing care per resident

Info This shows how many total hours of nursing staff time are available per resident each day. Higher numbers usually mean more staff support.
5h 50m per day

This home provides 40% more nursing time per resident than the Arizona average.

Arizona average: 4h 11m per day

Staffing hours breakdown

Info Hours of care per resident per day, broken down by staff type. Data from CMS Medicare.
Staff type Facility State avg National avg
Registered Nurse (RN) Info Registered nurse hours per resident per day. 33m per day 43m per day 41m per day
Nurse Aide Info Nurse aide hours per resident per day. 3h 11m per day 2h 22m per day 2h 21m per day
Total Nursing (Weekend) Info Total number of nurse staff hours per resident per day on weekends. 4h 31m per day 3h 38m per day 3h 26m per day
Physical Therapist Info Physical therapist staff hours per resident per day. 1m per day 6m per day 4m per day
RN (Weekend) Info Registered nurse hours per resident per day on weekends. 31m per day 31m per day 29m per day

Capacity and availability

High-capacity home

May provide extensive amenities, services and programs.

Total beds 228

This home usually has availability

Lower occupancy suggests more openings may be available.

Lower demand than the Arizona average
Occupancy rate 76.6%
Residents per day (avg) 162
Occupancy rate
76.6%
Residents per day (avg)
162

Who this home usually serves

TYPE OF STAY

Mostly long-term care residents

Most residents stay for extended periods and receive ongoing daily care.

Might be optimal for
Long-term daily care Ongoing support needs

Breakdown by payment type

Medicare

3% of new residents, usually for short-term rehab.

Typical stay 15 days

Private pay

18% of new residents, often for short stays.

Typical stay 4 - 5 months

Medicaid

80% of new residents, often for long-term daily care.

Typical stay 1 years

Finances and operations

Voluntary non-profit community
Home revenue
$36.2M
Surplus of revenue
$1.7M
Voluntary non-profit community
Home revenue
$36,206,262.00
Surplus of revenue
$1,716,350.00
Payroll costs Info The portion of the home's budget spent on staff, including nurses, caregivers, and other employees who support care and operations.
$15.6M
43% of revenue
Other operating costs Info All remaining costs needed to run the home, such as food, utilities, building maintenance, supplies and administrative expenses.
$14.7M
Total costs $30.3M
Bed community size
228-bed community
A large-scale community that may provide a wide range of amenities, services, and structured programs.
Walk Score
Walk Score: 28 / 100
Somewhat walkable. A few nearby services may be reachable on foot, but most trips require transportation.
BBB Rating
BBB Rating: A+ (Not Accredited)
An independent rating from the Better Business Bureau based on factors such as complaint history, transparency, and business practices.
How BBB ratings work

About this community

Occupancy

Occupancy rate
77%
In line with Arizona average
Occupied beds
175 / 228
Average residents 84 per day

License details

Facility type
Nursing Care Institution
Status Active
Expiration April 30, 2026

Additional licensing details

License number: NCI-066
CMS Certification Number: 35250
Qualification: Health Care

Ownership & operating entity

Immanuel Campus of Care is legally operated by Immanuel Campus Of Care, and administrated by SUSAN MCCARTHY-ROBINSON.

Care Services

Nursing Services
Rehabilitation Services
Respite Care
Memory Care
Independent Living
Skilled Nursing
Licensed Nurses/CNAs
24-Hour Staffing

All Levels of Care

Independent Living
Assisted Living
Memory Care
Skilled Nursing
Behavioral Health

Programs & Activities

Specific Programs
Assisted Living, Memory Care, Counseling Clinic, Independent Living, Medical & Mental Health, Skilled Nursing

Types of Care at Immanuel Campus of Care

Independent Living Assisted Living Skilled Nursing
Contact Immanuel Campus of Care

Performance summary

Key indicators of commitment to quality care and safety.

Ratings

Quality Rating
B Above average

Based on state quality rating data.

Inspection History

In Arizona, the Department of Health Services, Bureau of Long Term Care Licensing performs regular onsite inspections and investigates complaints for all licensed residential and nursing facilities.

47 visits/inspections

45 complaint inspections

Arizona average: 6 complaint visits

Arizona average: 5 inspections

45 complaints

Formal expressions of dissatisfaction or concern made by residents, or their families regarding various aspects of the care, services, and environment provided.

Arizona average: 6 complaints

Latest inspection

Date:September 18, 2025
Type:Complaint
Results:No deficiencies

24 violations

Violations indicate regulatory issues. A higher number implies the facility had several areas requiring improvement.

Arizona average: 12 violations

23 deficiencies

Deficiencies indicate regulatory issues. A higher number implies the facility had several areas requiring improvement.

Inspection Report Summary for Immanuel Campus of Care

The most recent inspection on September 18, 2025, had no deficiencies cited. Earlier inspections showed a pattern of deficiencies primarily related to abuse prevention, resident rights, and some safety issues, with several complaint investigations resulting in citations in these areas. There were no fines, immediate jeopardy findings, or license actions listed in the available reports. Most complaint investigations were unsubstantiated, with only a few substantiated cases involving abuse prevention. The trend suggests improvement over time, as recent inspections have been free of deficiencies following a period of cited issues.

Health Inspection History

Inspections
Total health inspections 19

Arizona average 6.3


Last Health inspection on Jul 2025

Total health citations 37

Arizona average 23.2

Citations per inspection
1.95

Arizona average 3.82


Health citations are formal notices following inspections when they fail to comply with safety and care standards.

12 of 37 citations resulted from standard inspections; 23 of 37 resulted from complaint investigations; and 2 of 37 came from combined inspections (standard and complaint).

Breakdown of citation severity (last 3 years)
Critical Health citations More info 0
100% better than Arizona average

Arizona average: 0.1


Serious Health citations More info 2
233% worse than Arizona average

Arizona average: 0.6

0 critical citations More info Arizona average: 0.1

2 serious citations More info Arizona average: 0.6

35 moderate citations More info Arizona average: 22.3

0 minor citations More info Arizona average: 0.2
Citations history (last 3 years)
Abuse/Neglect moderate citation Info Issues related to protecting resident's from harm, including abuse, neglect, or mistreatment. Jul 15, 2025
Corrected

Abuse/Neglect moderate citation Info Issues related to protecting resident's from harm, including abuse, neglect, or mistreatment. Jul 15, 2025
Corrected

Abuse/Neglect moderate citation Info Issues related to protecting resident's from harm, including abuse, neglect, or mistreatment. Jul 15, 2025
Corrected

Abuse/Neglect moderate citation Info Issues related to protecting resident's from harm, including abuse, neglect, or mistreatment. Jul 03, 2025
Corrected

Compare Nursing Homes around Peoria The information below is reported by the Arizona Department of Health Services, Bureau of Long Term Care Licensing.

3 facilities compared · CMS & AZ Dept. of Health data · Updated Mar 2026

Freedom Plaza Arizona
AL

Assisted Living A licensed, long-term care setting for seniors or individuals with disabilities who need help with daily activities — like bathing, dressing, and medication management — but not 24-hour skilled nursing. Offers housing, meals, and around-the-clock support while aiming to maximize resident independence.

MC

Memory Care Secured, specialized care for people living with Alzheimer's or dementia. Staff trained in cognitive impairment, with higher staff-to-resident ratios and an environment designed to reduce confusion and wandering risk.

NH

Nursing Home Licensed facility providing 24/7 skilled nursing care for residents with complex, ongoing medical needs. Staffed by RNs, LPNs, and CNAs. Inspected and star-rated annually by CMS. Accepts Medicare (short-term rehab) and Medicaid (long-term care).

Peoria
213
56.5%
-22%
4.67
+21%
+15%
0
12
0
61
A+
28
Freedom Plaza Limited Partnership Lllp
$14,6M
$13,0M
89%
35256
Studio / 1 Bed / 2 Bed
Immanuel Campus of Care
AL

Assisted Living A licensed, long-term care setting for seniors or individuals with disabilities who need help with daily activities — like bathing, dressing, and medication management — but not 24-hour skilled nursing. Offers housing, meals, and around-the-clock support while aiming to maximize resident independence.

IL

Independent Living Lifestyle-focused communities for older adults offering dining, activities, and transportation with minimal personal care. Best for active, independent seniors who want community without medical support.

NH

Nursing Home Licensed facility providing 24/7 skilled nursing care for residents with complex, ongoing medical needs. Staffed by RNs, LPNs, and CNAs. Inspected and star-rated annually by CMS. Accepts Medicare (short-term rehab) and Medicaid (long-term care).

Peoria
228
76.6%
+5%
5.84
-28%
+44%
2
37
2
162
A+
28
Coppersands Inc
$32,2M
$15,6M
48.4%
35250
-
Sierra Winds
-
AL

Assisted Living A licensed, long-term care setting for seniors or individuals with disabilities who need help with daily activities — like bathing, dressing, and medication management — but not 24-hour skilled nursing. Offers housing, meals, and around-the-clock support while aiming to maximize resident independence.

IL

Independent Living Lifestyle-focused communities for older adults offering dining, activities, and transportation with minimal personal care. Best for active, independent seniors who want community without medical support.

NH

Nursing Home Licensed facility providing 24/7 skilled nursing care for residents with complex, ongoing medical needs. Staffed by RNs, LPNs, and CNAs. Inspected and star-rated annually by CMS. Accepts Medicare (short-term rehab) and Medicaid (long-term care).

Peoria
70
66.7%
-8%
-
-
-
-
+8%
-
0
0
0
-
A-
47
Brown, Shannon
$13,4M
$5,6M
41.6%
35231
-

Places of interest near Immanuel Campus of Care

Address 2.5 miles from city center — 5.53 miles to nearest hospital (Banner Thunderbird Medical Center)

Address 11301 N 99th Ave, Peoria, AZ 85345

Calculate Travel Distance to Immanuel Campus of Care

Add your location

Address

Staffing Data (Q2 2025)

This data corresponds to Q2 2025 and is based on CMS Payroll-Based Journal.

Total staff 251
Employees 240
Contractors 11
Staff to resident ratio 1.63:1
11% worse than Arizona average

Arizona average ratio: 1.83:1

Avg staff/day 117
Average shift 7.9 hours
7% worse than Arizona average

Arizona average: 8.5 hours

Total staff hours (quarter) 84,121
Nursing staff breakdown
Registered Nurse

Manages medical care and health needs.

Total count 18
Average shift length Info Average shift length. Calculated as total hours divided by days worked and average staff per day. 9.4 hours

No contractors work on this role.

Licensed Practical Nurse

Assists with medical care and medications.

Total count 51
Average shift length Info Average shift length. Calculated as total hours divided by days worked and average staff per day. 9.4 hours

No contractors work on this role.

Certified Nursing Assistant

Helps with daily care and mobility.

Total count 137
Average shift length Info Average shift length. Calculated as total hours divided by days worked and average staff per day. 7.5 hours

No contractors work on this role.

Contractor staffing

Total hours from contractors

1.5%

1,271 contractor hours this quarter

Qualified Social Worker: 3 Speech Language Pathologist: 2 Other Physician: 2 Respiratory Therapy Technician: 1 Physical Therapy Assistant: 1 Physical Therapy Aide: 1 Medical Director: 1
Staff by category
Certified Nursing Assistant137013745,41691100%7.5
Licensed Practical Nurse5105116,61491100%9.4
Other Dietary Services Staff140146,74891100%7.7
Registered Nurse180185,79891100%9.4
Clinical Nurse Specialist8082,9479099%6.9
Diagnostic X-ray Services Staff3031,1206470%8
Dental Services Staff2029846470%8
RN Director of Nursing2028886470%7.7
Occupational Therapy Aide1015126470%8
Dietitian1015126470%8
Physical Therapy Aide0115106571%7.8
Administrator1014485662%8
Nurse Practitioner1014405560%8
Mental Health Service Worker1014245358%8
Speech Language Pathologist0223154549%7
Respiratory Therapy Technician0112604145%6.3
Physical Therapy Assistant0111013235%3.2
Medical Director011361213%3
Qualified Social Worker0332789%3.4
Other Physician022231314%1.8
137 Certified Nursing Assistant
% of Days 100%
51 Licensed Practical Nurse
% of Days 100%
14 Other Dietary Services Staff
% of Days 100%
18 Registered Nurse
% of Days 100%
8 Clinical Nurse Specialist
% of Days 99%
3 Diagnostic X-ray Services Staff
% of Days 70%
2 Dental Services Staff
% of Days 70%
2 RN Director of Nursing
% of Days 70%
1 Occupational Therapy Aide
% of Days 70%
1 Dietitian
% of Days 70%
1 Physical Therapy Aide
% of Days 71%
1 Administrator
% of Days 62%
1 Nurse Practitioner
% of Days 60%
1 Mental Health Service Worker
% of Days 58%
2 Speech Language Pathologist
% of Days 49%
1 Respiratory Therapy Technician
% of Days 45%
1 Physical Therapy Assistant
% of Days 35%
1 Medical Director
% of Days 13%
3 Qualified Social Worker
% of Days 9%
2 Other Physician
% of Days 14%

Facility Characteristics

Source: CMS Long-Term Care Facility Characteristics (Data as of Jan 2026)

Total census
154 residents
Residents by payment source
Medicare
1 resident (0.6%)
Medicaid
153 residents (99.4%)
Programs & Services
Residents' Group

Residents meet regularly to discuss policies, care quality, and activities

CCRC

Part of a Continuing Care Retirement Community offering multiple care levels

Active Resident Council

Organized group of residents that meets regularly to discuss facility policies, quality of life, and activities.

Quality of care over time

These measures show how residents usually do over time at this home, based on health outcomes and preventive care.

High-risk clinical events score Info A composite score based on pressure ulcers, falls with injury, weight loss, walking ability decline, and activities of daily living decline. 6.6
14% better than Arizona average

Arizona average: 7.6

Functional decline score Info A composite score based on activities of daily living decline, walking ability decline, and incontinence. 13.1
19% better than Arizona average

Arizona average: 16.1

Long-stay resident measures
Significantly above average Arizona avg: 3.7 Info CMS star rating based on long-stay quality measure performance. 5 stars = significantly above average, 1 star = significantly below average.
Need for Help with Daily Activities Increased Info Percent of long-stay residents whose need for help with daily activities has increased 9.4%
16% better than Arizona average

Arizona average: 11.2%

Walking Ability Worsened Info Percent of long-stay residents whose ability to move independently worsened 12.2%
23% better than Arizona average

Arizona average: 15.8%

Low Risk Residents with Bowel/Bladder Incontinence Info Percent of low risk long-stay residents who lose control of their bowels or bladder 17.6%
16% better than Arizona average

Arizona average: 20.8%

Falls with Major Injury Info Percent of long-stay residents experiencing one or more falls with major injury 1.7%
19% better than Arizona average

Arizona average: 2.1%

High Risk Residents with Pressure Ulcers Info Percent of long-stay high risk residents with pressure ulcers 5.2%
In line with Arizona average

Arizona average: 5.1%

Urinary Tract Infection Info Percent of long-stay residents with a urinary tract infection 1.2%
11% better than Arizona average

Arizona average: 1.3%

Lost Too Much Weight Info Percent of long-stay residents who lose too much weight 4.3%
21% better than Arizona average

Arizona average: 5.4%

Depressive Symptoms Info Percent of long-stay residents who have depressive symptoms 0.0%
100% better than Arizona average

Arizona average: 4.5%

Antipsychotic Use Info Percent of long-stay residents who received an antipsychotic medication 53.0%
417% worse than Arizona average

Arizona average: 10.3%

Pneumococcal Vaccine Info Percent of long-stay residents assessed and appropriately given the pneumococcal vaccine 98.5%
In line with Arizona average

Arizona average: 97.2%

Influenza Vaccine Info Percent of long-stay residents assessed and appropriately given the seasonal influenza vaccine 99.4%
5% better than Arizona average

Arizona average: 94.6%

Short-stay resident measures
Pneumococcal Vaccine Info Percent of short-stay residents assessed and appropriately given the pneumococcal vaccine 86.6%
5% worse than Arizona average

Arizona average: 91.5%

Antipsychotic medication increase Info Percent of short-stay residents who newly received an antipsychotic medication 13.2%
1198% worse than Arizona average

Arizona average: 1.0%

Influenza Vaccine Info Percent of short-stay residents assessed and appropriately given the seasonal influenza vaccine 84.6%
In line with Arizona average

Arizona average: 87.3%

Penalties and fines

Federal penalties imposed by CMS for regulatory violations, including civil money penalties (fines) and denials of payment for new Medicare/Medicaid admissions.

Source: CMS Penalties Database (Data as of Jan 2026)

Total fines amount $19K
39% lower than Arizona average

Arizona average: $30K

Number of fines 2
19% more fines than Arizona average

Arizona average: 1.7

Payment Denials Info Serious action where Medicare and/or Medicaid temporarily stops payments for new residents until issues are fixed. 0
100% fewer payment denials than Arizona average

Arizona average: 0.1

Fines amount comparison
This facility $19K
Arizona average $30K
Penalty History

Penalties are imposed by CMS for violations of federal nursing home regulations.

Civil Money Penalty Info Fines imposed for noncompliance, which can be assessed per day or per instance of violation. Jan 31, 2025
$9K
Civil Money Penalty Info Fines imposed for noncompliance, which can be assessed per day or per instance of violation. Mar 7, 2024
$9K

Last updated: Jan 2026

Guides for Better Senior Living

Care Cost Calculator: See Prices in Your Area

Nursing Home Data Explorer

Don’t Wait Too Long: 7 Red Flag Signs Your Parent Needs Assisted Living Now

The True Cost of Assisted Living in 2025 – And How Families Are Paying For It

Understanding Senior Living Costs: Pricing Models, Discounts & Financial Assistance

Financial Aid for Arizona Seniors

Get financial aid guidance

Arizona Long Term Care System

ALTCS

Age 65+ or disabled, Arizona resident, Medicaid-eligible, nursing home-level care need.

~$2,829/month (300% FBR, individual).

$2,000 (individual), $3,000 (couple).

Covers tribal members; rural outreach.

Non-Medical Home and Community Based Services

AZ DES Non-Medical HCBS

Age 60+, Arizona resident, at risk of institutionalization.

~$2,000/month (individual, varies).

$10,000 (individual).

Limited funding; waitlists common.

Senior Community Service Employment Program (SCSEP)

AZ SCSEP

Age 55+, Arizona resident, unemployed, low-income.

~$1,519/month (125% of poverty level, individual).

Not specified; income-driven.

Wages at highest of federal/state/local minimum ($14.35/hour in 2025).

Weatherization Assistance Program (WAP)

AZ WAP

Age 60+ priority, Arizona resident, own/rent home, low-income.

~$2,510/month (200% of poverty level, individual).

Not applicable; income-focused.

High demand in rural desert areas; limited annual funds.

Section 202 Supportive Housing for the Elderly

AZ Section 202

Age 62+, Arizona resident, very low income, able to live independently with support.

~$1,645/month (50% of area median income, individual, varies by county).

$10,000 (individual, excludes home if owned).

Limited units; high demand in metro areas like Phoenix.

Arizona CARES Program

AZ CARES

Caregivers of Arizona residents 60+ needing help with 3+ daily activities; no caregiver age limit.

No strict limit; cost-sharing above ~$2,500/month threshold.

Not applicable; need-based.

Focus on rural access; complements ALTCS respite.

AZ DES Non-Medical Home and Community Based Services (HCBS)

AZ DES Non-Medical HCBS

Age 60+ or disabled, Arizona resident, need assistance with daily activities, not eligible for Medicaid/ALTCS.

Above Medicaid threshold but low-income (~$1,500-$2,500/month, varies by region).

Not specified; income-driven eligibility.

Targets those ineligible for ALTCS; prioritizes rural and tribal areas.

Tour Icon
Planning a tour? Check our touring checklist.
Chat Icon
Thinking of living here? We can help you speak to a current resident