


Total staff
235
Employees
234
Contractors
1
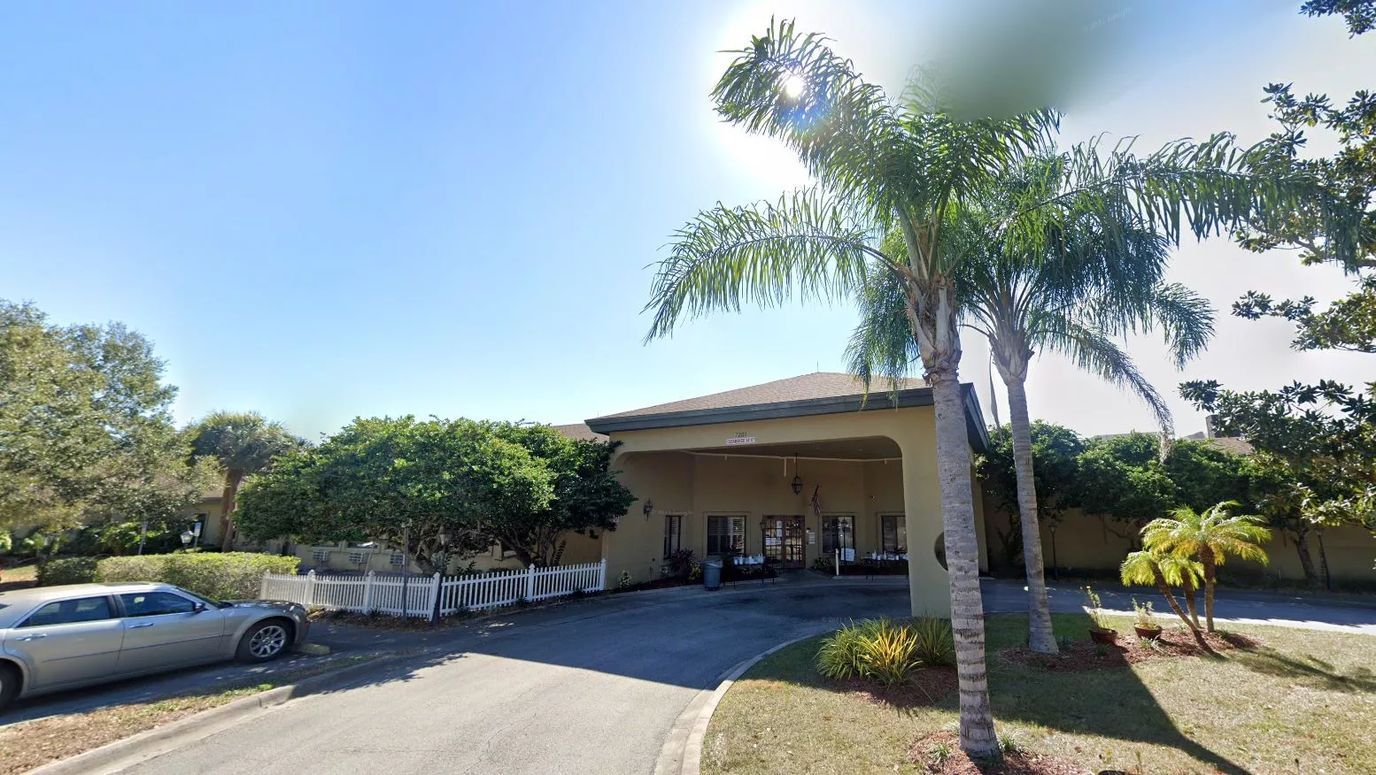


Indian River Center, a 179-bed nursing facility operated by Cazzie King, is located at 7201 Greenboro Dr in Melbourne, Brevard County, Florida. The community accepts Medicare, Medicaid, and private-pay residents, with most stays running approximately 88 days and a service model balancing short-term rehabilitation and longer-term care.
The facility received a 1-star overall CMS rating, with health inspection, staffing, and quality measures each rated at 1 star. Health inspection findings place it 64.4 percent below Florida averages. Between 2024 and 2025, a single $74,000 federal penalty was imposed in March 2025, aligning with state-average enforcement dollars. No payment denials or otherwise serious federal actions suspending new admissions appear in the recent record.
Nursing hours total 3 hours 44 minutes per resident per day, running 8 percent below Florida’s 4 hours 2 minutes benchmark and placing the facility 174th among 252 state facilities. The staff-to-resident ratio of 1.39:1 stands only 6 percent worse than the state average. Notably, 234 of 235 staff are permanent employees rather than contractors.
Long-stay residents experience hospitalizations at 1.03 per 1,000 days; substantially better than Florida’s 2.10 average. Yet unintended weight loss appears in 12.4 percent of this population, more than twice the state rate of 6.0 percent. Emergency department visits occur at elevated rates: 2.72 per 1,000 resident days for long-stay populations and 15.9 percent for short-stay, both outpacing state comparisons by wide margins. Short-stay residents show particular difficulty returning home successfully, with only 34.6 percent achieving independent discharge versus a 50.6 percent state average.
The facility maintains occupancy at 92.3 percent, nearly 10 percent above the Florida average, reflecting strong local demand.
Net income of $6.6 million on $19.2 million in revenue indicates a financially stable operation, with payroll consuming 51.1 percent of revenue.
The gap between Indian River’s operational strength and its low regulatory rating warrants careful examination of the underlying inspection concerns before placement, particularly for residents with mobility or nutritional vulnerabilities.
| Staff type | Hours / Day / Resident | vs state avg |
|---|---|---|
|
Registered Nurse (RN)
| 29m per day | ▼ 33% State avg: 44m per day · National avg: 41m per day |
|
LPN / LVN
| 50m per day | ▲ 6% State avg: 47m per day · National avg: 52m per day |
|
Nurse Aide
| 2h 5m per day | ▼ 11% State avg: 2h 20m per day · National avg: 2h 21m per day |
|
Weekend Total Nursing
| 3h 10m per day | ▼ 10% State avg: 3h 31m per day · National avg: 3h 26m per day |
|
Physical Therapist
| 3m per day | ▼ 46% State avg: 5m per day · National avg: 4m per day |
|
Weekend RN
| 23m per day | ▼ 30% State avg: 32m per day · National avg: 29m per day |
Reporting period: October 1 – December 31, 2025 (Q4 2025). Source: CMS Payroll-Based Journal report.
Manages medical care and health needs.
Assists with medical care and medications.
Helps with daily care and mobility.
Total hours from contractors
70 contractor hours this quarter
| Certified Nursing Assistant | 131 | 0 | 131 | 32,926 | 92 | 100% | 8.1 |
| Licensed Practical Nurse | 36 | 0 | 36 | 12,247 | 92 | 100% | 7.5 |
| Registered Nurse | 23 | 0 | 23 | 6,401 | 92 | 100% | 8.2 |
| Dietitian | 7 | 0 | 7 | 2,332 | 92 | 100% | 7.3 |
| Physical Therapy Aide | 9 | 0 | 9 | 1,907 | 73 | 79% | 7.3 |
| Speech Language Pathologist | 9 | 0 | 9 | 1,533 | 79 | 86% | 7 |
| Clinical Nurse Specialist | 3 | 0 | 3 | 943 | 64 | 70% | 7.8 |
| RN Director of Nursing | 2 | 0 | 2 | 898 | 66 | 72% | 8 |
| Respiratory Therapy Technician | 3 | 0 | 3 | 712 | 78 | 85% | 6.9 |
| Qualified Social Worker | 2 | 0 | 2 | 510 | 73 | 79% | 7 |
| Occupational Therapy Aide | 1 | 0 | 1 | 496 | 62 | 67% | 8 |
| Physical Therapy Assistant | 3 | 0 | 3 | 477 | 64 | 70% | 7.2 |
| Administrator | 1 | 0 | 1 | 466 | 59 | 64% | 7.9 |
| Mental Health Service Worker | 1 | 0 | 1 | 453 | 57 | 62% | 7.9 |
| Dental Services Staff | 1 | 0 | 1 | 417 | 57 | 62% | 7.3 |
| Nurse Practitioner | 1 | 0 | 1 | 408 | 51 | 55% | 8 |
| Medical Director | 0 | 1 | 1 | 70 | 14 | 15% | 5 |
| Medication Aide/Technician | 1 | 0 | 1 | 5 | 1 | 1% | 5 |
Includes penalties issued in 2025
Federal penalties imposed by CMS for regulatory violations, including civil money penalties (fines) and denials of payment for new Medicare/Medicaid admissions.
Source: CMS Penalties Database (Data as of Jan 2026)
Florida average: $72K
Florida average: 2.6
Florida average: 0.1
Penalties are imposed by CMS for violations of federal nursing home regulations.
1 penalty in the past 3 years
Mar 15, 2025 · $74K
Last updated: Jan 2026
These measures show how residents usually do over time at this home, based on health outcomes and preventive care.
Florida average: 7.4
Florida average: 12.4
Florida average: 10.5%
Florida average: 12.9%
Florida average: 13.5%
Florida average: 2.6%
Florida average: 5.4%
Florida average: 0.9%
Florida average: 6.0%
Florida average: 3.3%
Florida average: 97.7%
Florida average: 99.2%
Florida average: 2.10
Florida average: 1.18
Florida average: 94.0%
Florida average: 1.5%
Florida average: 94.7%
Florida average: 26.2%
Florida average: 9.3%
Florida average: 0.8%
Florida average: 53.7%
Florida average: 50.6%
Quality measures are calculated from Minimum Data Set (MDS) assessments. For most measures, lower percentages indicate better care quality.
31% of new residents, usually for short-term rehab.
47% of new residents, often for short stays.
23% of new residents, often for long-term daily care.
Source: CMS Long-Term Care Facility Characteristics (Data as of Jan 2026)
Residents meet regularly to discuss policies, care quality, and activities
Organized group of residents that meets regularly to discuss facility policies, quality of life, and activities.
Data sourced from CMS Long-Term Care Facility Characteristics quarterly report. Payer mix reflects the current resident census by primary payment source.
Historical financial and operational data for Indian River Center from 2012–2023, based on CMS SNF Cost Reports.
Key figures below are for fiscal year ending in 09/2023.
Based on CMS SNF Cost Report for fiscal year ending in 09/2023.
This home supports both short-term rehab and long-term care, with residents staying for a wide range of durations.
New residents most often arrive under private pay (47% of admissions), and a typical private pay stay runs around 1 - 2 months.
Coverage residents most often arrive under.
Coverage residents most often leave under.
![]() 4.3 miles from city center
4.3 miles from city center
![]() Estimated distance in miles from Melbourne's city center to Indian River Center's address, calculated via Google Maps.
— 1.1 miles to nearest hospital (Orlando Health Melbourne Hospital)
Estimated distance in miles from Melbourne's city center to Indian River Center's address, calculated via Google Maps.
— 1.1 miles to nearest hospital (Orlando Health Melbourne Hospital)
Add your location
Info below is compiled from CMS reports & the FL Agency for Health Care Administration (AHCA), senior community websites & trusted data sources such as Walk Score & BBB.
Communities are listed from highest to lowest based on our ranking methodology.
| Life Care Center of Melbourne | NH SNF | Melbourne | 120
Facility
120
FL AVG
88
Rank
#253 / 1058 |
96.3%
Facility
96.3%
FL AVG
84.4
Rank
#6 / 125 | +14% | 3.81
Facility
3.81
FL AVG
4.04
Rank
#119 / 181 | -11% | -6% | $0
Facility
$0
FL AVG
$78.9k
Rank
#1 / 185 | - | 12
Facility
12
FL AVG
19.7
Rank
#50 / 181 | 4.0
Facility
4.0
FL AVG
4.5
Rank
#77 / 181 | - | 116 | - |
39
Facility
39
FL AVG
40
Rank
#744 / 1487 | Dana Delena | $15.4MFiscal year ending 12/2023
Facility
$15.4MFiscal year ending 12/2023
FL AVG
$15.7M
Rank
#60 / 184 | $8.4MFiscal year ending 12/2023
Facility
$8.4MFiscal year ending 12/2023
FL AVG
$6.1M
Rank
#95 / 184 | 54.6%Fiscal year ending 12/2023
Facility
54.6%Fiscal year ending 12/2023
FL AVG
39.8%
Rank
#151 / 184 | 105291 | ||||
| West Melbourne Health and Rehabilitation Center | NH MC PC SNF | West Melbourne (New Haven Avenue) | 180
Facility
180
FL AVG
88
Rank
#56 / 1058 | - | - | 4.92
Facility
4.92
FL AVG
4.04
Rank
#26 / 181 | -11% | +22% | $0
Facility
$0
FL AVG
$78.9k
Rank
#1 / 185 | - | 34
Facility
34
FL AVG
19.7
Rank
#164 / 181 | 4.9
Facility
4.9
FL AVG
4.5
Rank
#117 / 181 | 2 | 25 | C+ |
79
Facility
79
FL AVG
40
Rank
#114 / 1487 | Denise Caiati | $17.0MFiscal year ending 05/2024
Facility
$17.0MFiscal year ending 05/2024
FL AVG
$15.7M
Rank
#95 / 184 | $10.8MFiscal year ending 05/2024
Facility
$10.8MFiscal year ending 05/2024
FL AVG
$6.1M
Rank
#50 / 184 | 63.6%Fiscal year ending 05/2024
Facility
63.6%Fiscal year ending 05/2024
FL AVG
39.8%
Rank
#20 / 184 | 105376 | ||||
| Indian River Center | NH MC PC RC SNF | Melbourne | 179
Facility
179
FL AVG
88
Rank
#75 / 1058 |
96.0%
Facility
96.0%
FL AVG
84.4
Rank
#8 / 125 | +14% | 3.73
Facility
3.73
FL AVG
4.04
Rank
#137 / 181 | -19% | -8% | $74.4k
Facility
$74.4k
FL AVG
$78.9k
Rank
#162 / 185 | - | 16
Facility
16
FL AVG
19.7
Rank
#78 / 181 | 3.2
Facility
3.2
FL AVG
4.5
Rank
#48 / 181 | 3 | 172 | - |
34
Facility
34
FL AVG
40
Rank
#851 / 1487 | Cazzie King | $19.2MFiscal year ending 09/2023
Facility
$19.2MFiscal year ending 09/2023
FL AVG
$15.7M
Rank
#96 / 184 | $8.8MFiscal year ending 09/2023
Facility
$8.8MFiscal year ending 09/2023
FL AVG
$6.1M
Rank
#66 / 184 | 45.6%Fiscal year ending 09/2023
Facility
45.6%Fiscal year ending 09/2023
FL AVG
39.8%
Rank
#43 / 184 | 105673 |
Indian River Center is located in Melbourne, Florida.
Here are the financial assistance programs available to residents in Florida.
Indian River Center has a walk score of 34. Somewhat walkable. A few nearby services may be reachable on foot, but most trips require transportation.
Indian River Center's occupancy is 92.3%.
No, Indian River Center has a no-pet policy.
Indian River Center is registered as a for-profit.
Yes — there are 6 photos of Indian River Center in the photo gallery on this page.
Indian River Center is located at 7201 Greenboro Dr, Melbourne, FL 32904.
(321) 727-0990 will put you in contact with the team at Indian River Center.
Care Cost Calculator: See Prices in Your Area
Nursing Home Data Explorer
Don’t Wait Too Long: 7 Red Flag Signs Your Parent Needs Assisted Living Now
The True Cost of Assisted Living in 2025 – And How Families Are Paying For It
Understanding Senior Living Costs: Pricing Models, Discounts & Financial Assistance


