
Inspirations Assisted Living & Memory Care of Linthicum
Assisted Living & Memory Care · Hyattsville, MD
Inspirations Assisted Living & Memory Care of Linthicum
Assisted Living & Memory Care · Hyattsville, MD
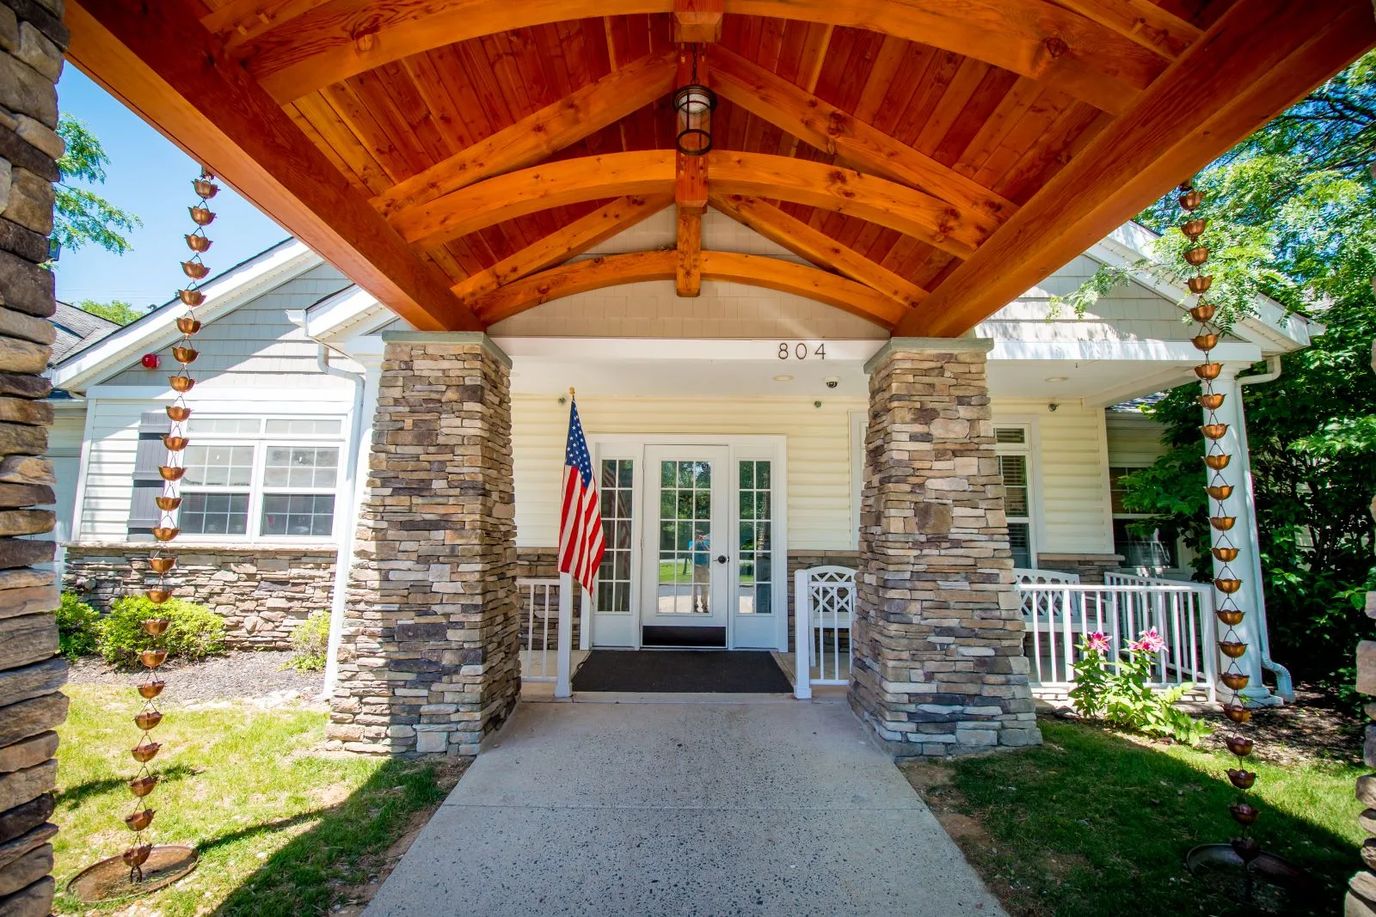
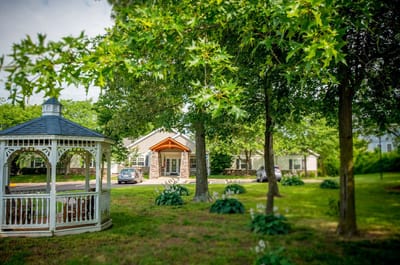
At Inspirations Assisted Living & Memory Care of Linthicum, Maryland, residents can enjoy a picturesque setting that lets them bask in the sun and breathe in the fresh air of the tight-knit community. With all-inclusive care options, residents receive medication management and assistance with showering, dressing, mobility, incontinence, and dining. The community is private pay, and family members are welcome to visit around the clock.
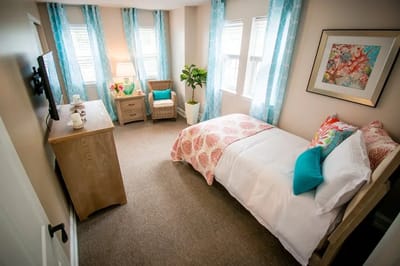
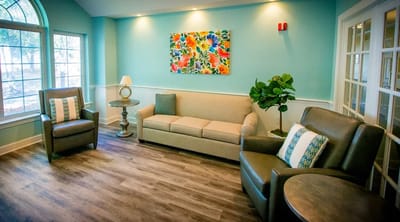
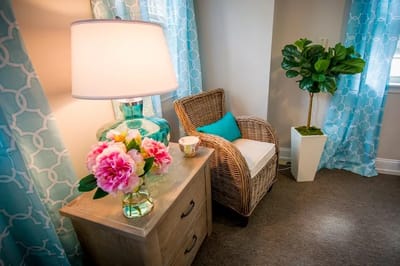
The well-lit open spaces and secured environment, as well as field trips, raised gardens, free Wi-Fi and flat screen TV suites with private full bathrooms and custom ADA vanities make for a comfortable stay. The superior staff-to-resident ratio ensures that residents receive the attention and care they need, while the well-lit, homey interior creates a collected and calm atmosphere. They also offer art, music, animal, and other holistic therapies, as well as life enrichment activities that allow residents to discover their passions and achieve their dreams.
Types of Care at Inspirations Assisted Living & Memory Care of Linthicum
Assisted Living
Memory Care
11 years in operation Rank #151 / 209Years in operation — State benchmarkedThis home is ranked 151st out of 209 homes in Maryland. Shows how long this facility has been in operation compared to other Maryland SNFs. Longer operating histories may benefit residents, families, and staff.Click the rank badge to see the full State ranking.Click here to see the full State ranking.
A community with a solid operating history and experience delivering ongoing care.
Walk Score: 59 / 100 Rank #327 / 986Walk Score — State benchmarkedThis home is ranked 327th out of 986 homes in Maryland. Shows how walkable this facility's neighborhood is compared to the average Walk Score across Maryland SNFs. Higher scores benefit residents, families, and staff.Click the rank badge to see the full State ranking.Click here to see the full State ranking.
Moderately walkable. Some errands can be accomplished on foot, with a mix of nearby amenities.
BBB Rating: A+ (Not Accredited)
An independent rating from the Better Business Bureau based on factors such as complaint history, transparency, and business practices.
How BBB ratings work
Staffing
Key information about the people who lead and staff this community.
ContactMr. Kacey Troyer, Owner
Places of interest near Inspirations Assisted Living & Memory Care of Linthicum
26.6 miles from city center
Estimated distance in miles from Linthicum Heights's city center to Inspirations Assisted Living & Memory Care of Linthicum's address, calculated via Google Maps.
— 5.24 miles to nearest hospital (Ascension Saint Agnes Hospital)
Calculate Travel Distance to Inspirations Assisted Living & Memory Care of Linthicum
Add your location
Financial Assistance for
Assisted Living in Maryland
Inspirations Assisted Living & Memory Care of Linthicum is located in Linthicum Heights, Maryland.
Here are the financial assistance programs available to residents in Maryland.
Compare Assisted Living around Hyattsville
The information below is reported by the Maryland Department of Health, Office of Health Care Quality.
Filter by care type
| Independence Court of Hyattsville |
AL Assisted Living A licensed, long-term care setting for seniors or individuals with disabilities who need help with daily activities — like bathing, dressing, and medication management — but not 24-hour skilled nursing. Offers housing, meals, and around-the-clock support while aiming to maximize resident independence.
MC Memory Care Secured, specialized care for people living with Alzheimer's or dementia. Staff trained in cognitive impairment, with higher staff-to-resident ratios and an environment designed to reduce confusion and wandering risk.
RC Respite Care Short-term temporary care — days to weeks — to give family caregivers a break. Full care provided during the stay. Often used after hospitalization or to trial a facility before a permanent placement decision. | Hyattsville (Queens Chapel Manor) | 130 | Yes | 64 | - | 35 | - |
44% Male Residents — State Benchmarked 44% of residents are male, compared to the Maryland average of 31%. A relatively balanced gender mix for assisted living, where facilities typically skew heavily female. |
56% Female Residents — State Benchmarked 56% of residents are female, compared to the Maryland average of 69%. Closer to an even gender split than most assisted living facilities, which typically have 65–75% female residents. |
24% White Residents — State Benchmarked 24% of residents are reported as White, compared to the Maryland average of 82%. A lower White share than the Maryland average — the community may draw a more diverse resident mix relative to other facilities in Maryland. |
68% African American Residents — State Benchmarked 68% of residents are reported as African American or Black, compared to the Maryland average of 12%. A higher African American share than the typical Maryland average — useful context when comparing cultural fit and community composition. |
8% Other Ethnicity Residents — State Benchmarked 8% of residents fall into categories other than White or African American (combined), compared to the Maryland average of 6%. This column aggregates Hispanic, Asian, multiracial, and any other labeled groups that are not classified as White or African American. Reported subgroups in this total: Other (6%), Asian (2%). |
18% Residents Age 65–74 — State Benchmarked 18% of residents are 65–74, compared to the Maryland average of 12%. A higher share of younger seniors often signals a more independent, active resident community with lower acuity care needs. |
42% Residents Age 75–84 — State Benchmarked 42% of residents are 75–84, compared to the Maryland average of 31%. A high concentration in this mid-range bracket, where residents typically need moderate support with daily activities. |
22% Residents Age 85–94 — State Benchmarked 22% of residents are 85–94, compared to the Maryland average of 44%. The population here skews younger than the statewide norm, which may indicate a more active, lower-acuity community. |
14% Residents Age 95+ — State Benchmarked 14% of residents are 95 or older, compared to the Maryland average of 16%. In line with the statewide profile for the oldest resident bracket. |
| The Terraces at Tuckerman Lane |
NH Nursing Home Licensed facility providing 24/7 skilled nursing care for residents with complex, ongoing medical needs. Staffed by RNs, LPNs, and CNAs. Inspected and star-rated annually by CMS. Accepts Medicare (short-term rehab) and Medicaid (long-term care).
AL Assisted Living A licensed, long-term care setting for seniors or individuals with disabilities who need help with daily activities — like bathing, dressing, and medication management — but not 24-hour skilled nursing. Offers housing, meals, and around-the-clock support while aiming to maximize resident independence.
MC Memory Care Secured, specialized care for people living with Alzheimer's or dementia. Staff trained in cognitive impairment, with higher staff-to-resident ratios and an environment designed to reduce confusion and wandering risk.
RC Respite Care Short-term temporary care — days to weeks — to give family caregivers a break. Full care provided during the stay. Often used after hospitalization or to trial a facility before a permanent placement decision. | North Bethesda | 101 | No | 39 | studio / suite / 1 bed | 28 | - |
45% Male Residents — State Benchmarked 45% of residents are male, compared to the Maryland average of 31%. A relatively balanced gender mix for assisted living, where facilities typically skew heavily female. |
55% Female Residents — State Benchmarked 55% of residents are female, compared to the Maryland average of 69%. Closer to an even gender split than most assisted living facilities, which typically have 65–75% female residents. |
75% White Residents — State Benchmarked 75% of residents are reported as White, compared to the Maryland average of 82%. Close to the average for this category among assisted living facilities in Maryland with reported race/ethnicity data. |
15% African American Residents — State Benchmarked 15% of residents are reported as African American or Black, compared to the Maryland average of 12%. In line with the Maryland average for African American residents among facilities reporting this breakdown. |
9% Other Ethnicity Residents — State Benchmarked 9% of residents fall into categories other than White or African American (combined), compared to the Maryland average of 6%. This column aggregates Hispanic, Asian, multiracial, and any other labeled groups that are not classified as White or African American. Reported subgroups in this total: Asian (5%), Hispanic (3%), American Indian (2%). |
11% Residents Age 65–74 — State Benchmarked 11% of residents are 65–74, compared to the Maryland average of 12%. In line with the statewide profile for this youngest senior bracket in assisted living. |
26% Residents Age 75–84 — State Benchmarked 26% of residents are 75–84, compared to the Maryland average of 31%. Below the state norm — the resident mix may skew either younger or older than this typical middle bracket. |
48% Residents Age 85–94 — State Benchmarked 48% of residents are 85–94, compared to the Maryland average of 44%. This is typically the most common age bracket in assisted living — this facility is in line with the statewide norm. |
14% Residents Age 95+ — State Benchmarked 14% of residents are 95 or older, compared to the Maryland average of 16%. In line with the statewide profile for the oldest resident bracket. |
| Malta House |
NH Nursing Home Licensed facility providing 24/7 skilled nursing care for residents with complex, ongoing medical needs. Staffed by RNs, LPNs, and CNAs. Inspected and star-rated annually by CMS. Accepts Medicare (short-term rehab) and Medicaid (long-term care).
AL Assisted Living A licensed, long-term care setting for seniors or individuals with disabilities who need help with daily activities — like bathing, dressing, and medication management — but not 24-hour skilled nursing. Offers housing, meals, and around-the-clock support while aiming to maximize resident independence. | Chillum (Avondale Terrace) | 16 | Yes | 43 | - | 30 | - |
25% Male Residents — State Benchmarked 25% of residents are male, compared to the Maryland average of 31%. This facility caters to a majority female resident pool (75% female), consistent with the broader assisted living trend where women significantly outnumber men. |
75% Female Residents — State Benchmarked 75% of residents are female, compared to the Maryland average of 69%. Women comprise the large majority, consistent with national assisted living demographics where women live longer and enter care facilities at higher rates. |
58% White Residents — State Benchmarked 58% of residents are reported as White, compared to the Maryland average of 82%. A lower White share than the Maryland average — the community may draw a more diverse resident mix relative to other facilities in Maryland. |
42% African American Residents — State Benchmarked 42% of residents are reported as African American or Black, compared to the Maryland average of 12%. A higher African American share than the typical Maryland average — useful context when comparing cultural fit and community composition. |
0% Other Ethnicity Residents — State Benchmarked 0% of residents fall into categories other than White or African American (combined), compared to the Maryland average of 6%. This column aggregates Hispanic, Asian, multiracial, and any other labeled groups that are not classified as White or African American. |
17% Residents Age 65–74 — State Benchmarked 17% of residents are 65–74, compared to the Maryland average of 12%. A higher share of younger seniors often signals a more independent, active resident community with lower acuity care needs. |
33% Residents Age 75–84 — State Benchmarked 33% of residents are 75–84, compared to the Maryland average of 31%. This is the second most common age bracket in assisted living, representing residents with moderate care needs. |
42% Residents Age 85–94 — State Benchmarked 42% of residents are 85–94, compared to the Maryland average of 44%. This is typically the most common age bracket in assisted living — this facility is in line with the statewide norm. |
8% Residents Age 95+ — State Benchmarked 8% of residents are 95 or older, compared to the Maryland average of 16%. Most residents here have not yet reached the oldest-old bracket, suggesting a younger overall community. |
| Inspirations Assisted Living & Memory Care of Linthicum |
AL Assisted Living A licensed, long-term care setting for seniors or individuals with disabilities who need help with daily activities — like bathing, dressing, and medication management — but not 24-hour skilled nursing. Offers housing, meals, and around-the-clock support while aiming to maximize resident independence.
MC Memory Care Secured, specialized care for people living with Alzheimer's or dementia. Staff trained in cognitive impairment, with higher staff-to-resident ratios and an environment designed to reduce confusion and wandering risk. | Linthicum Heights (Bwi Business District) | - | No | 59 | - | 11 | A+ | - | - | - | - | - | - | - | - | - |
| Brightview Bethesda Woodmont |
AL Assisted Living A licensed, long-term care setting for seniors or individuals with disabilities who need help with daily activities — like bathing, dressing, and medication management — but not 24-hour skilled nursing. Offers housing, meals, and around-the-clock support while aiming to maximize resident independence.
IL Independent Living Lifestyle-focused communities for older adults offering dining, activities, and transportation with minimal personal care. Best for active, independent seniors who want community without medical support.
MC Memory Care Secured, specialized care for people living with Alzheimer's or dementia. Staff trained in cognitive impairment, with higher staff-to-resident ratios and an environment designed to reduce confusion and wandering risk. | Bethesda (Rugby Avenue) | - | No | 93 | - | - | - | - | - | - | - | - | - | - | - | - |
Frequently Asked Questions about Inspirations Assisted Living & Memory Care of Linthicum
What neighborhood is Inspirations Assisted Living & Memory Care of Linthicum in?
Inspirations Assisted Living & Memory Care of Linthicum is in the BWI Business District neighborhood of MD 21090.
Is Inspirations Assisted Living & Memory Care of Linthicum in a walkable area?
Inspirations Assisted Living & Memory Care of Linthicum has a walk score of 59. Moderately walkable. Some errands can be accomplished on foot, with a mix of nearby amenities.
What is the phone number of Inspirations Assisted Living & Memory Care of Linthicum?
(833) 346-8569 will put you in contact with the team at Inspirations Assisted Living & Memory Care of Linthicum.
Is Inspirations Assisted Living & Memory Care of Linthicum Medicare or Medicaid certified?
Inspirations Assisted Living & Memory Care of Linthicum is not currently listed as a CMS-certified provider of Medicare or Medicaid.
Guides for Better Senior Living
Care Cost Calculator: See Prices in Your Area
Nursing Home Data Explorer
Don’t Wait Too Long: 7 Red Flag Signs Your Parent Needs Assisted Living Now
The True Cost of Assisted Living in 2025 – And How Families Are Paying For It
Understanding Senior Living Costs: Pricing Models, Discounts & Financial Assistance
Contact Us

Feedback
Write a review for Inspirations Assisted Living & Memory Care of Linthicum
Rate your overall experience with this community
Explore Open Rooms
1
Contact details
2
What type of senior care service are you looking for?
3
What budget do you have in mind for senior care?
4
How soon do you need to find care?
5
Additional details
Thank you for your interest!
Our team will be in touch shortly to help with next steps.
Need Help?
Let us help you or a loved one find the perfect senior home.


