


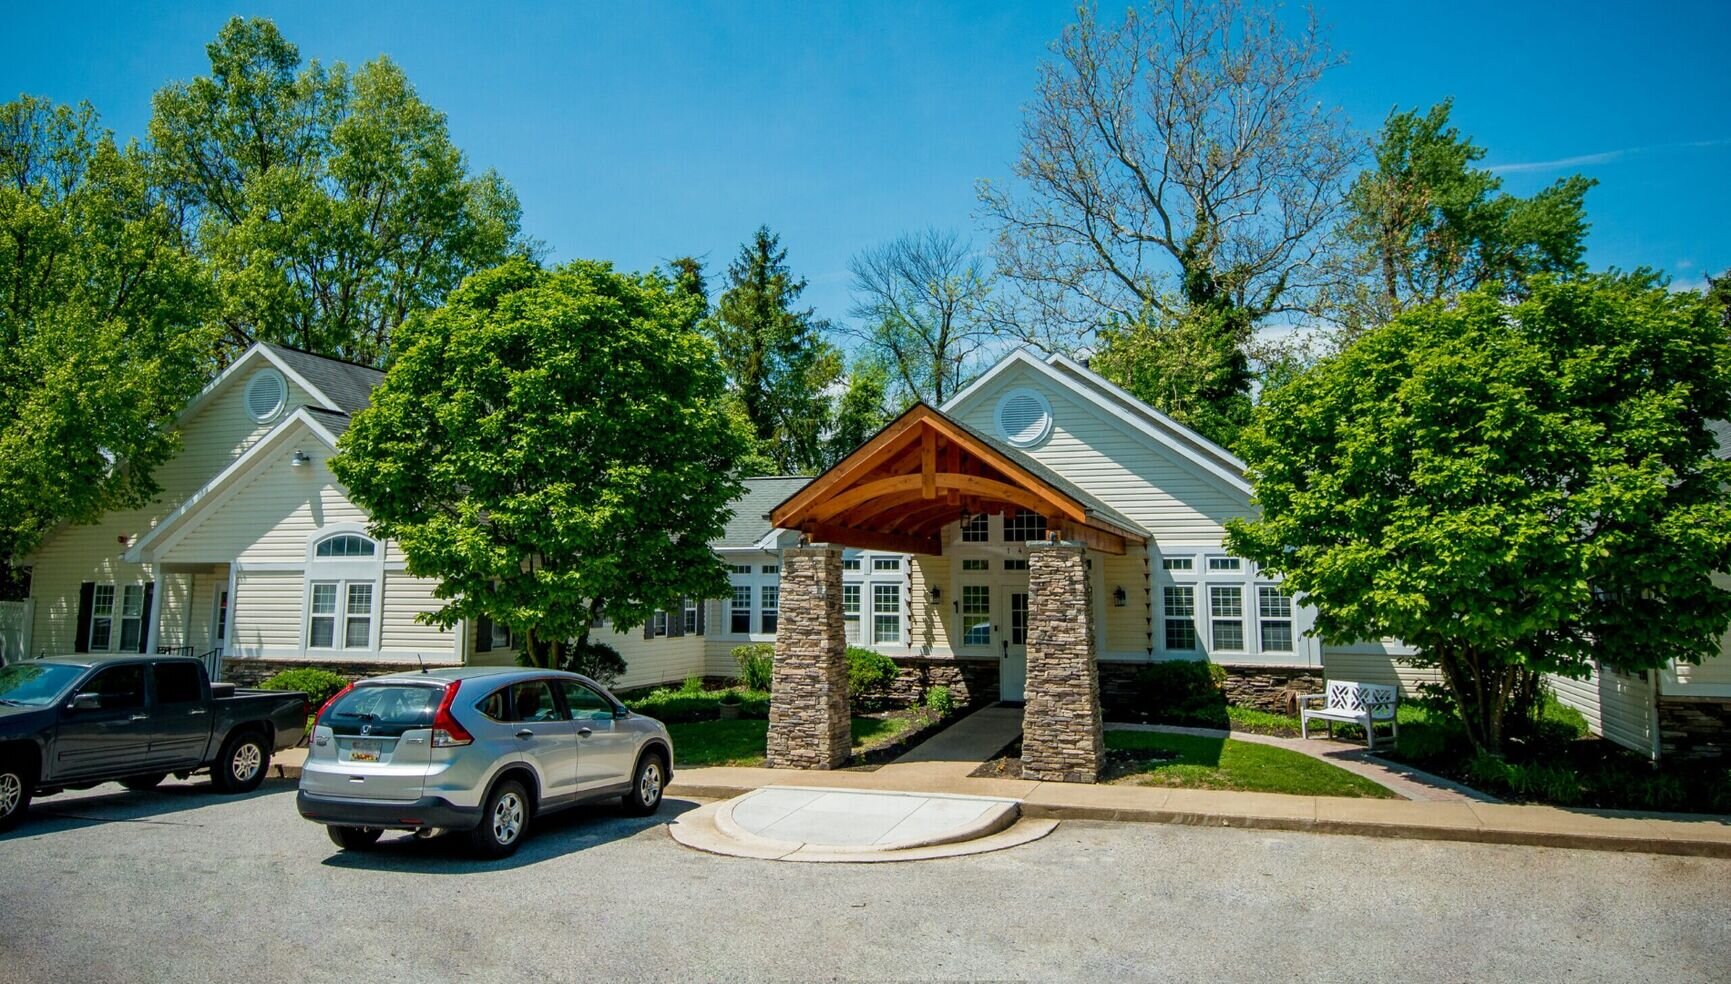
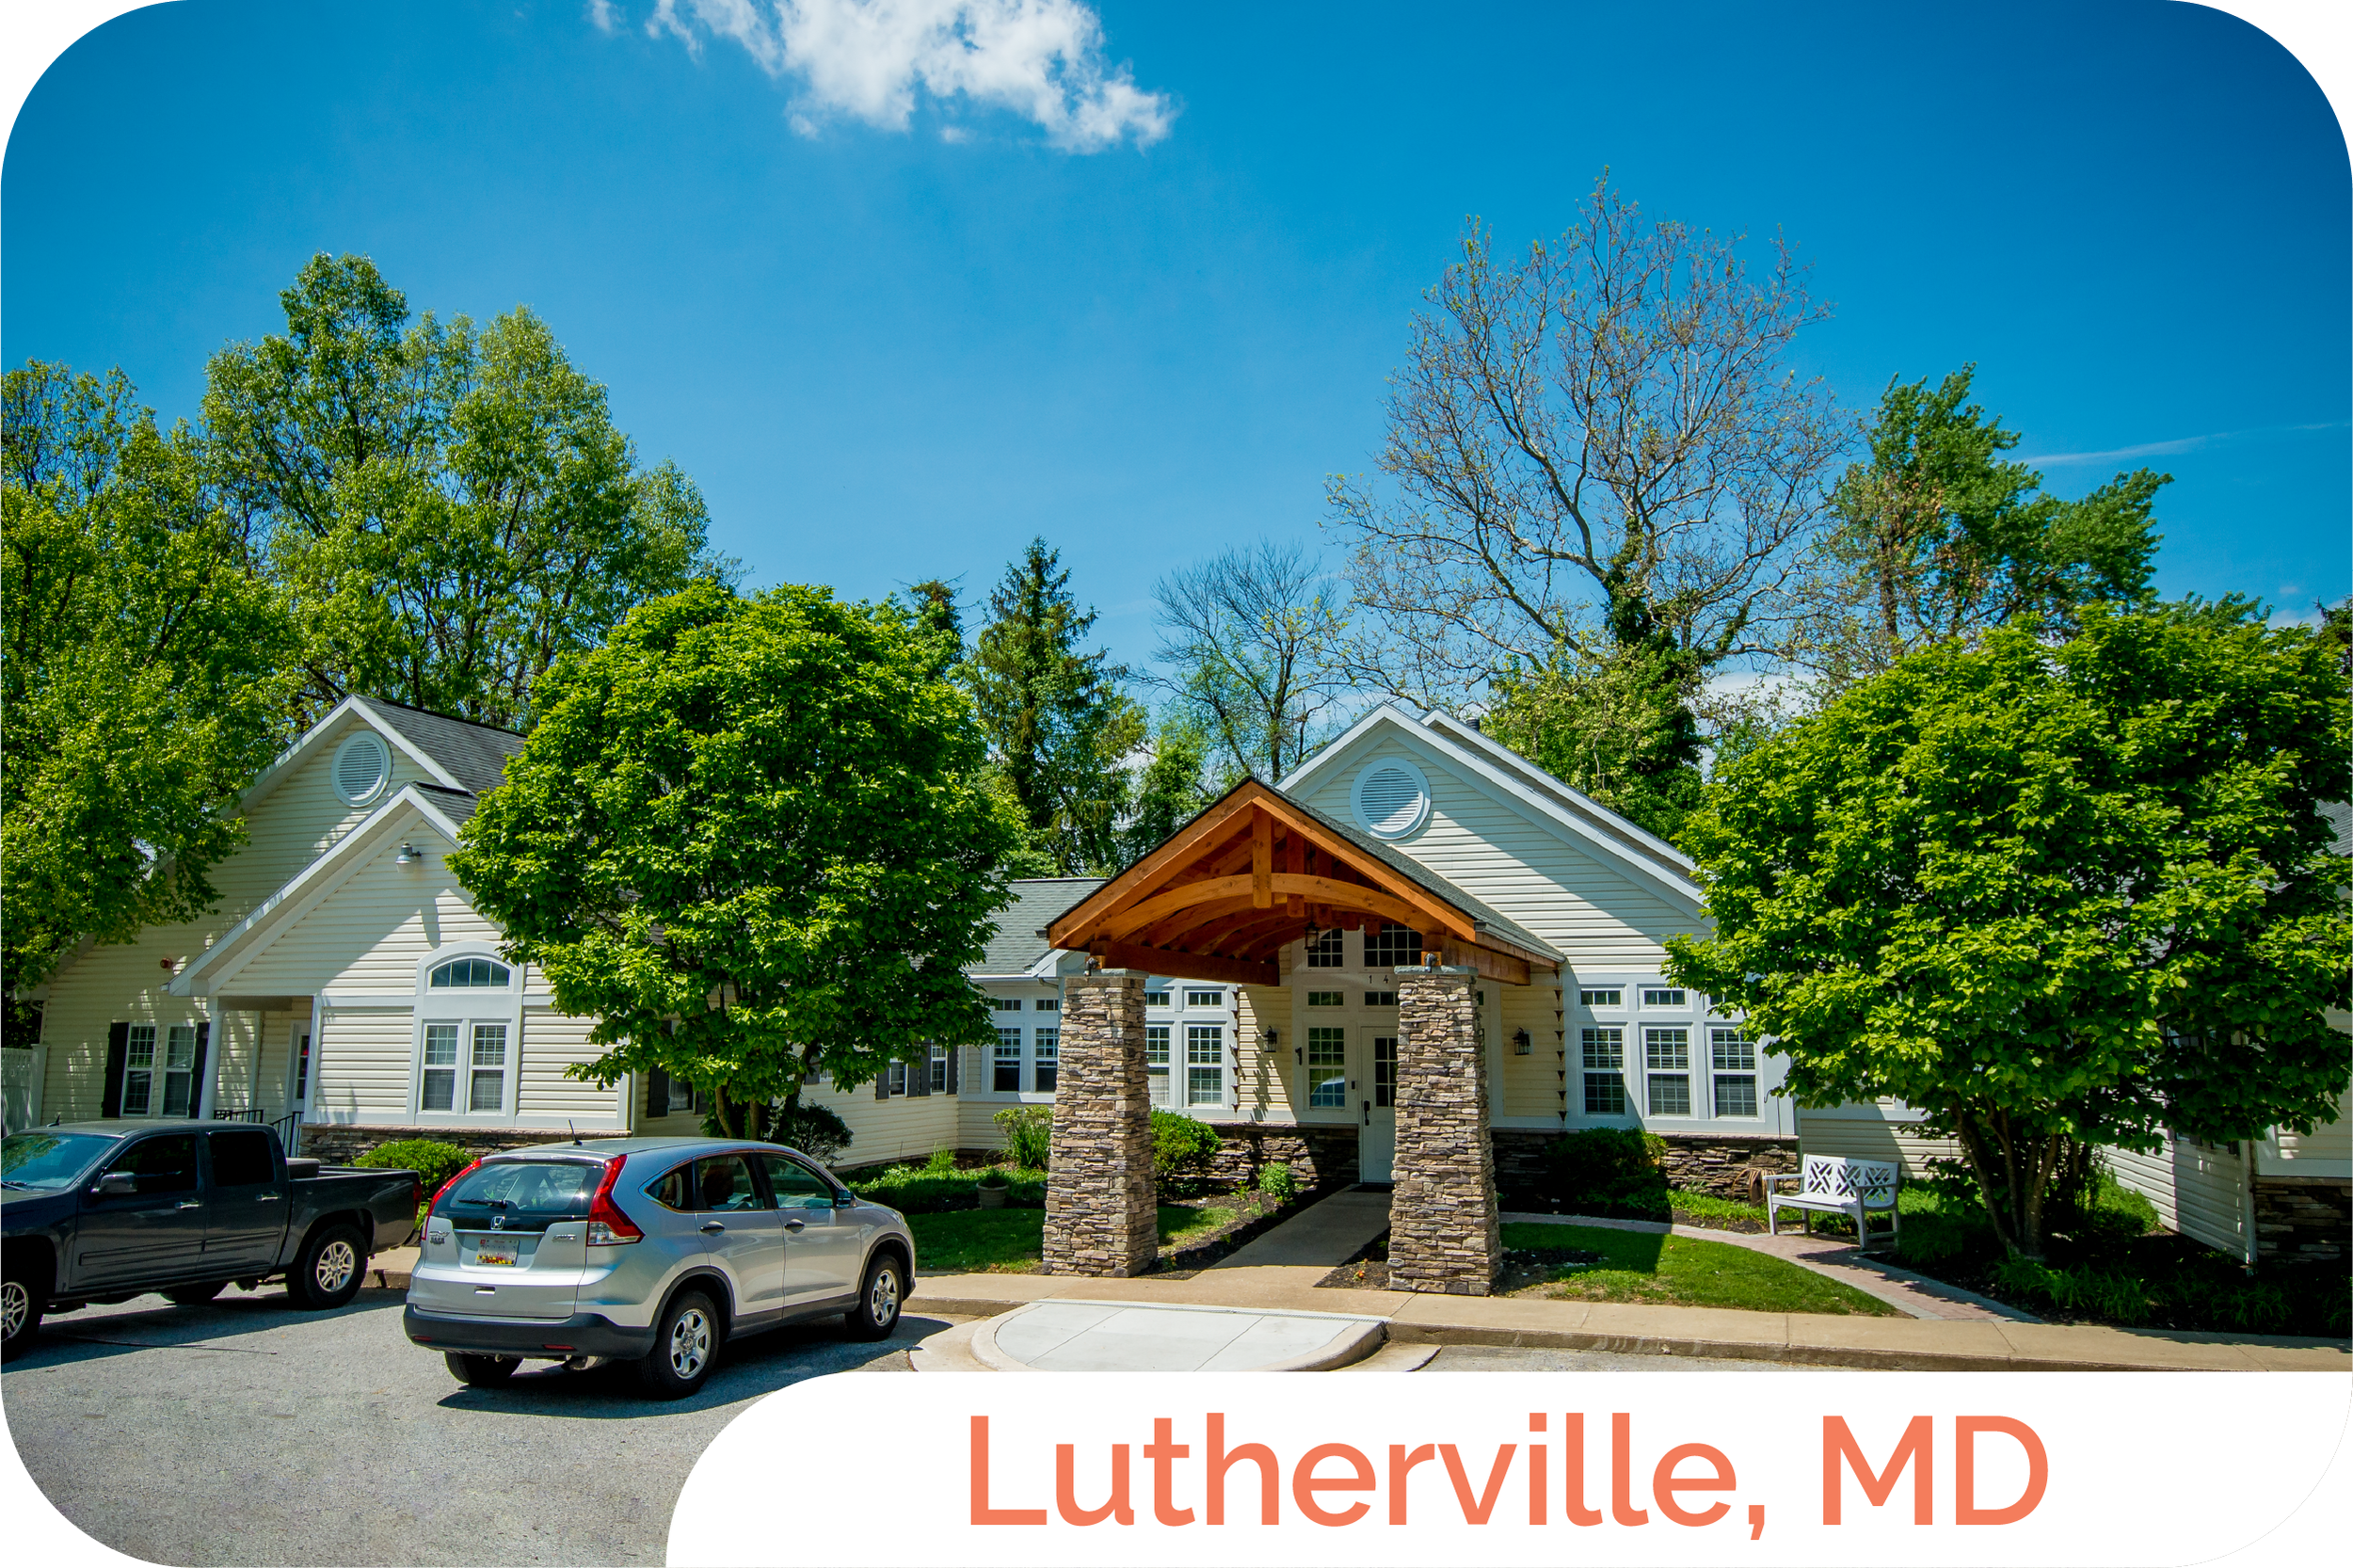
Inspirations Memory Care of Lutherville
Memory Care · Maryland, MD


Inspirations Memory Care of Lutherville
Memory Care · Maryland, MD
Overview of Inspirations Memory Care of Lutherville
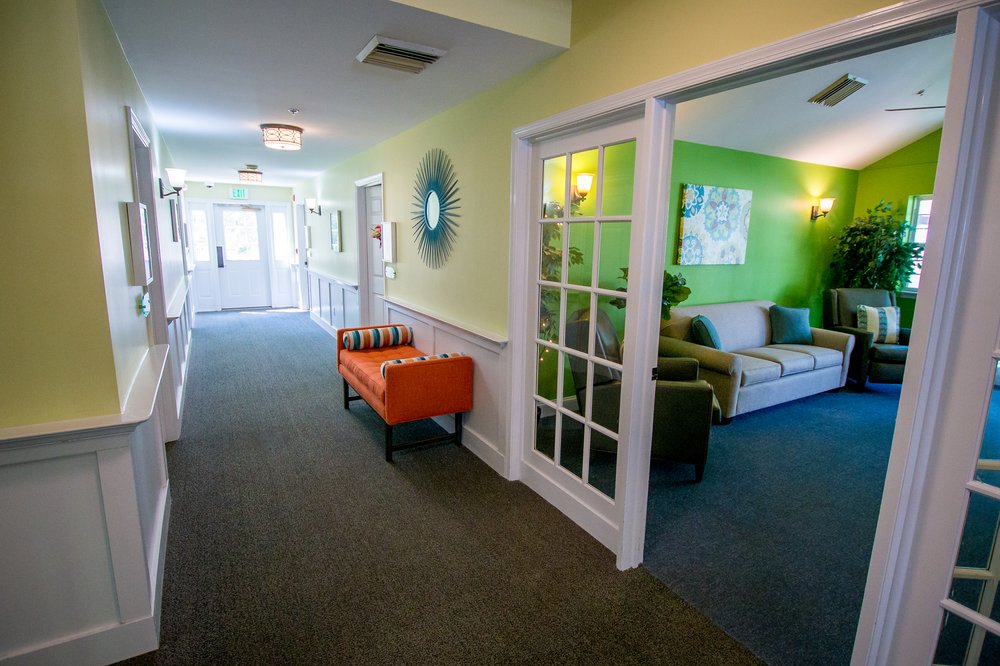
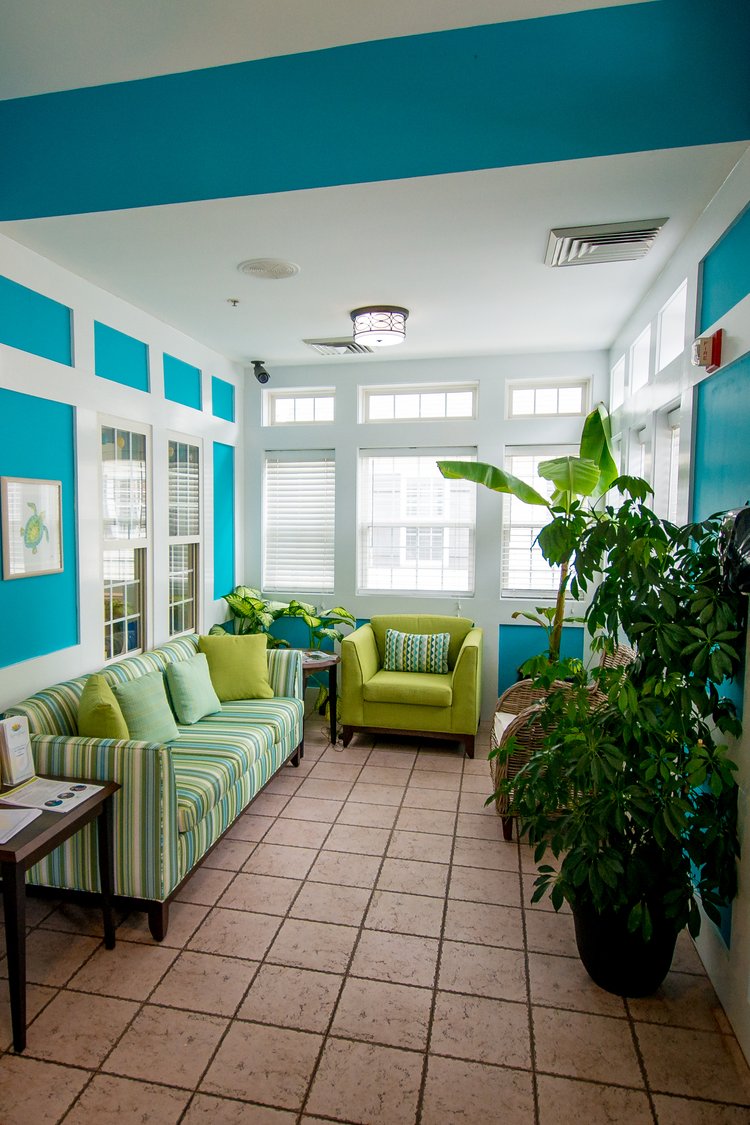
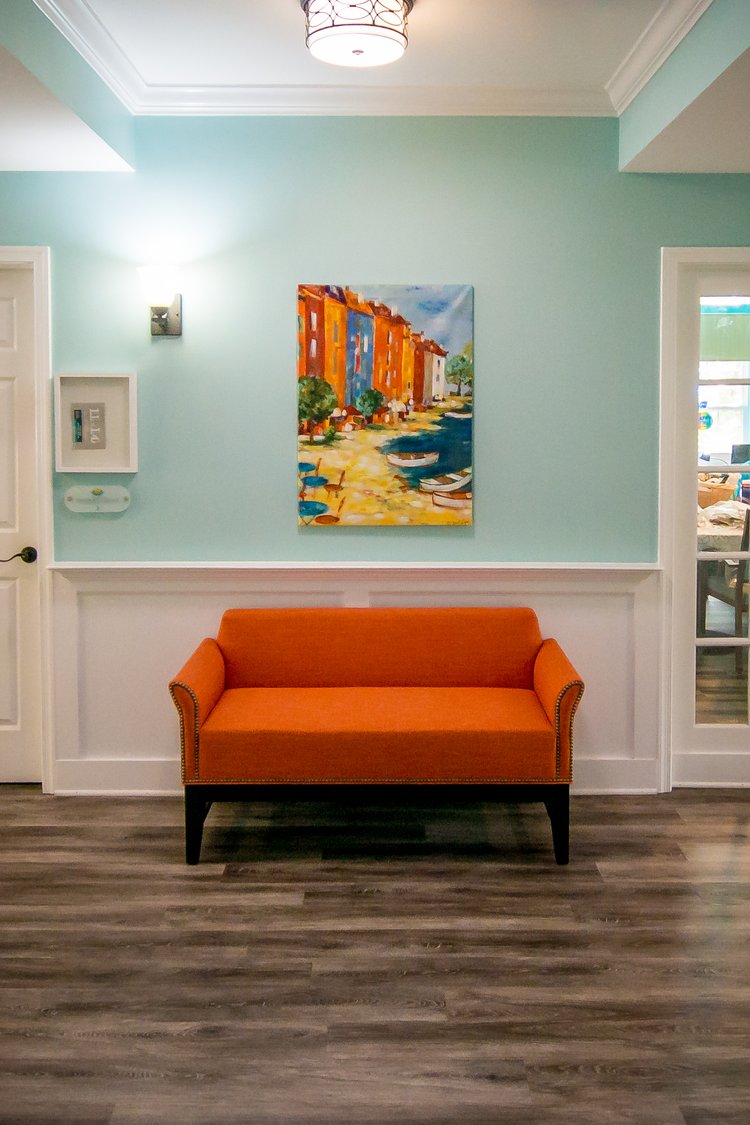
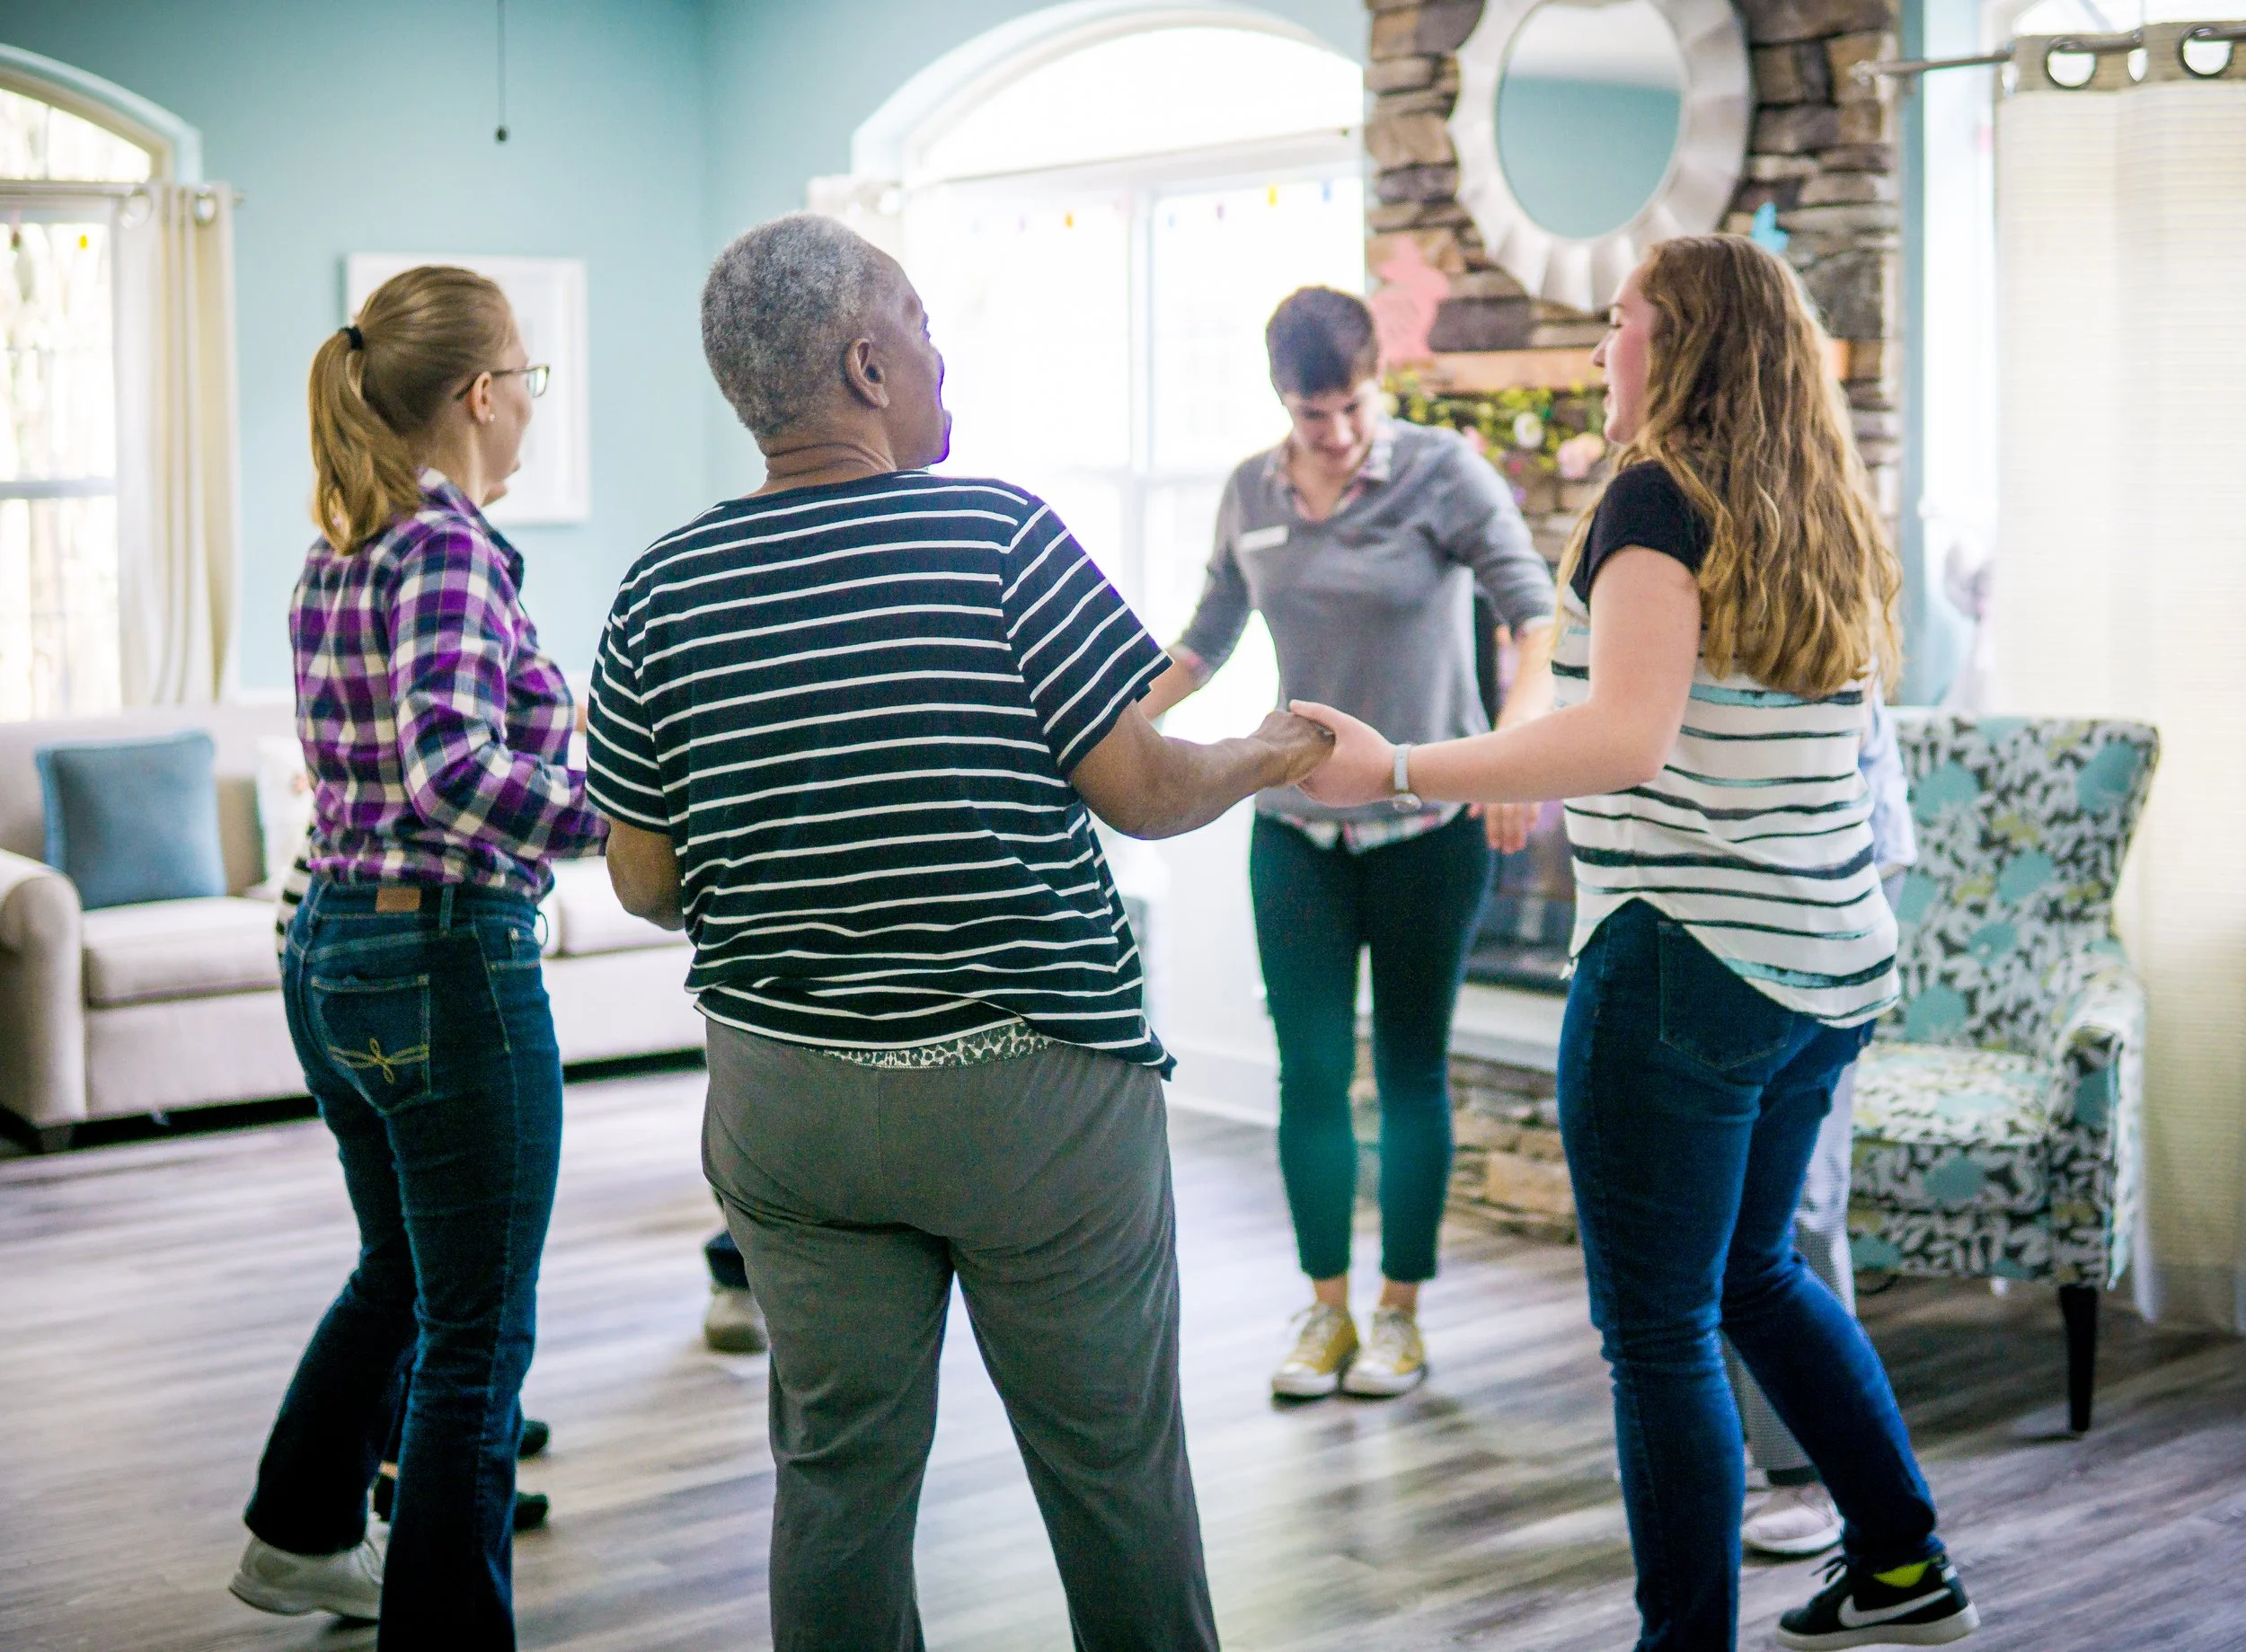
Inspirations Memory Care of Lutherville is an idyllic community in Lutherville, MD that provides a supportive and familiar environment for memory care residents. Through their excellent caregiver-to-resident ratio, the community ensures residents receive proper care and attention in their safe accommodations. From medication management to showering, dressing, and mobility assistance, residents here receive all the care and support they need to maintain their well-being while keeping their independence.
There are countless activities like dance parties, gardening, and painting for residents to enjoy, keeping them active and stimulated. To ensure residents are properly nourished, the community also makes sure to serve them healthy and delicious meals daily. At Inspirations Lutherville Memory Care, they strive to create a vibrant environment that enriches residents’ lives with loving care and fun experiences.
16-bed community
A smaller, more intimate setting that may offer a quieter environment and closer staff-resident interactions.
8 years in operation
An established community with some operational experience and growing routines.
Walk Score: 45 / 100
Somewhat walkable. A few nearby services may be reachable on foot, but most trips require transportation.
Services
About this community
CountyBaltimore
Profit StatusTrue
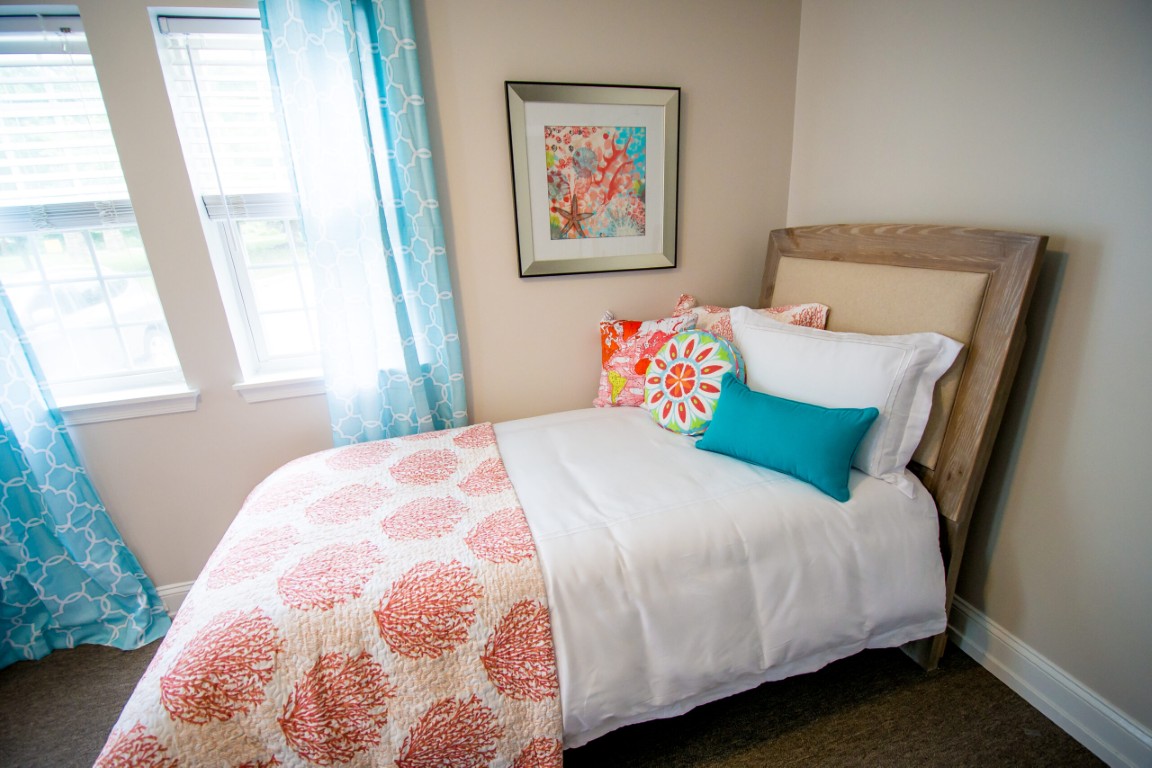
Private Room
$269 - $313 per day
Hospice Affiliations
Staffing
Key information about the people who lead and staff this community.
No CNA training program
Licensed Nurses/CNAs
Mild Alzheimer's Level
Moderate Alzheimer's Level
Severe Alzheimer's Level
Volunteer ProgramsYes
Operating HoursMo 00:00-00:00, Tu 00:00-00:00, We 00:00-00:00, Th 00:00-00:00, Fr 00:00-00:00, Sa 00:00-00:00, Su 00:00-00:00
What does this home offer?
Room Sizes: 220 - 280 sq. ft
Housing Options: Private Suites
Building Type: Single-story
Dining Services
Transportation Services
Recreational Activities
Types of Care at Inspirations Memory Care of Lutherville
Memory Care
Demographics
Resident demographic information for this facility.
Gender
- Female 50%
- Male 50%
Age Distribution
- 75-84 50%
- 85-94 41.7%
- 95+ 8.3%
Ethnicity
- White 91.7%
- Asian 8.3%
Infection Prevention & Vaccination
How this facility protects residents through staff vaccination policies and immunization practices.
Influenza Gold Star
Awarded by the Maryland Health Care Commission (MHCC) to healthcare facilities that achieve a high influenza vaccination rate.
Mandatory Vaccination Policy
The facility requires certain vaccinations for staff as part of its infection prevention measures.
Places of interest near Inspirations Memory Care of Lutherville
![]() 1.6 miles from city center
1.6 miles from city center
![]() Estimated distance in miles from Lutherville's city center to Inspirations Memory Care of Lutherville's address, calculated via Google Maps.
Estimated distance in miles from Lutherville's city center to Inspirations Memory Care of Lutherville's address, calculated via Google Maps.
Calculate Travel Distance to Inspirations Memory Care of Lutherville
Add your location
Financial Assistance for
Memory Care in Maryland
Inspirations Memory Care of Lutherville is located in Lutherville, Maryland.
Here are the financial assistance programs available to residents in Maryland.
Compare Memory Care around Maryland
The information below is reported by the Maryland Department of Health, Office of Health Care Quality.
Filter by care type
| Tribute at Black Hill by Cogir |
AL Assisted Living A licensed, long-term care setting for seniors or individuals with disabilities who need help with daily activities — like bathing, dressing, and medication management — but not 24-hour skilled nursing. Offers housing, meals, and around-the-clock support while aiming to maximize resident independence.
MC Memory Care Secured, specialized care for people living with Alzheimer's or dementia. Staff trained in cognitive impairment, with higher staff-to-resident ratios and an environment designed to reduce confusion and wandering risk. | Germantown | 154 | Yes | 3 | Private Suites | 6 | - |
25% Male Residents — State Benchmarked 25% of residents are male, compared to the Maryland average of 31%. This facility caters to a majority female resident pool (75% female), consistent with the broader assisted living trend where women significantly outnumber men. |
75% Female Residents — State Benchmarked 75% of residents are female, compared to the Maryland average of 69%. Women comprise the large majority, consistent with national assisted living demographics where women live longer and enter care facilities at higher rates. |
89% White Residents — State Benchmarked 89% of residents are reported as White, compared to the Maryland average of 82%. Close to the average for this category among assisted living facilities in Maryland with reported race/ethnicity data. |
6% African American Residents — State Benchmarked 6% of residents are reported as African American or Black, compared to the Maryland average of 12%. In line with the Maryland average for African American residents among facilities reporting this breakdown. |
5% Other Ethnicity Residents — State Benchmarked 5% of residents fall into categories other than White or African American (combined), compared to the Maryland average of 6%. This column aggregates Hispanic, Asian, multiracial, and any other labeled groups that are not classified as White or African American. Reported subgroups in this total: Hawaiian/Pacific Islander (2%), Hispanic (2%), Asian (1%). |
14% Residents Age 65–74 — State Benchmarked 14% of residents are 65–74, compared to the Maryland average of 12%. In line with the statewide profile for this youngest senior bracket in assisted living. |
32% Residents Age 75–84 — State Benchmarked 32% of residents are 75–84, compared to the Maryland average of 31%. This is the second most common age bracket in assisted living, representing residents with moderate care needs. |
45% Residents Age 85–94 — State Benchmarked 45% of residents are 85–94, compared to the Maryland average of 44%. This is typically the most common age bracket in assisted living — this facility is in line with the statewide norm. |
9% Residents Age 95+ — State Benchmarked 9% of residents are 95 or older, compared to the Maryland average of 16%. Most residents here have not yet reached the oldest-old bracket, suggesting a younger overall community. |
| Inspirations Memory Care of Lutherville |
MC Memory Care Secured, specialized care for people living with Alzheimer's or dementia. Staff trained in cognitive impairment, with higher staff-to-resident ratios and an environment designed to reduce confusion and wandering risk. | Lutherville | 16 | No | 45 | Private Suites | 8 | - |
50% Male Residents — State Benchmarked 50% of residents are male, compared to the Maryland average of 31%. An unusually high male share for assisted living, where most facilities skew heavily female. |
50% Female Residents — State Benchmarked 50% of residents are female, compared to the Maryland average of 69%. Closer to an even gender split than most assisted living facilities, which typically have 65–75% female residents. |
92% White Residents — State Benchmarked 92% of residents are reported as White, compared to the Maryland average of 82%. A higher White share than is typical for assisted living in Maryland in this dataset — compare with peer facilities for local context. |
0% African American Residents — State Benchmarked 0% of residents are reported as African American or Black, compared to the Maryland average of 12%. A lower African American share than is typical in Maryland; local markets still vary widely. |
8% Other Ethnicity Residents — State Benchmarked 8% of residents fall into categories other than White or African American (combined), compared to the Maryland average of 6%. This column aggregates Hispanic, Asian, multiracial, and any other labeled groups that are not classified as White or African American. Reported subgroups in this total: Asian (8%). | - |
50% Residents Age 75–84 — State Benchmarked 50% of residents are 75–84, compared to the Maryland average of 31%. A high concentration in this mid-range bracket, where residents typically need moderate support with daily activities. |
42% Residents Age 85–94 — State Benchmarked 42% of residents are 85–94, compared to the Maryland average of 44%. This is typically the most common age bracket in assisted living — this facility is in line with the statewide norm. |
8% Residents Age 95+ — State Benchmarked 8% of residents are 95 or older, compared to the Maryland average of 16%. Most residents here have not yet reached the oldest-old bracket, suggesting a younger overall community. |
| Inspirations Memory Care of Westminster |
MC Memory Care Secured, specialized care for people living with Alzheimer's or dementia. Staff trained in cognitive impairment, with higher staff-to-resident ratios and an environment designed to reduce confusion and wandering risk. | Westminster | 16 | No | 0 | Private Suites | 10 | - |
44% Male Residents — State Benchmarked 44% of residents are male, compared to the Maryland average of 31%. A relatively balanced gender mix for assisted living, where facilities typically skew heavily female. |
56% Female Residents — State Benchmarked 56% of residents are female, compared to the Maryland average of 69%. Closer to an even gender split than most assisted living facilities, which typically have 65–75% female residents. |
100% White Residents — State Benchmarked 100% of residents are reported as White, compared to the Maryland average of 82%. A higher White share than is typical for assisted living in Maryland in this dataset — compare with peer facilities for local context. |
0% African American Residents — State Benchmarked 0% of residents are reported as African American or Black, compared to the Maryland average of 12%. A lower African American share than is typical in Maryland; local markets still vary widely. |
0% Other Ethnicity Residents — State Benchmarked 0% of residents fall into categories other than White or African American (combined), compared to the Maryland average of 6%. This column aggregates Hispanic, Asian, multiracial, and any other labeled groups that are not classified as White or African American. | - |
44% Residents Age 75–84 — State Benchmarked 44% of residents are 75–84, compared to the Maryland average of 31%. A high concentration in this mid-range bracket, where residents typically need moderate support with daily activities. |
50% Residents Age 85–94 — State Benchmarked 50% of residents are 85–94, compared to the Maryland average of 44%. A high concentration of very elderly residents signals a higher-acuity facility with experience caring for advanced age-related needs. |
6% Residents Age 95+ — State Benchmarked 6% of residents are 95 or older, compared to the Maryland average of 16%. Most residents here have not yet reached the oldest-old bracket, suggesting a younger overall community. |
| The Cottages of Perry Hall |
MC Memory Care Secured, specialized care for people living with Alzheimer's or dementia. Staff trained in cognitive impairment, with higher staff-to-resident ratios and an environment designed to reduce confusion and wandering risk.
AL Assisted Living A licensed, long-term care setting for seniors or individuals with disabilities who need help with daily activities — like bathing, dressing, and medication management — but not 24-hour skilled nursing. Offers housing, meals, and around-the-clock support while aiming to maximize resident independence. | Parkville (Northwind Farms) | 16 | No | 6 | Private Suites | 24 | A+ |
14% Male Residents — State Benchmarked 14% of residents are male, compared to the Maryland average of 31%. This facility caters to a majority female resident pool (86% female), consistent with the broader assisted living trend where women significantly outnumber men. |
86% Female Residents — State Benchmarked 86% of residents are female, compared to the Maryland average of 69%. Women comprise the large majority, consistent with national assisted living demographics where women live longer and enter care facilities at higher rates. |
93% White Residents — State Benchmarked 93% of residents are reported as White, compared to the Maryland average of 82%. A higher White share than is typical for assisted living in Maryland in this dataset — compare with peer facilities for local context. |
7% African American Residents — State Benchmarked 7% of residents are reported as African American or Black, compared to the Maryland average of 12%. In line with the Maryland average for African American residents among facilities reporting this breakdown. |
0% Other Ethnicity Residents — State Benchmarked 0% of residents fall into categories other than White or African American (combined), compared to the Maryland average of 6%. This column aggregates Hispanic, Asian, multiracial, and any other labeled groups that are not classified as White or African American. |
14% Residents Age 65–74 — State Benchmarked 14% of residents are 65–74, compared to the Maryland average of 12%. In line with the statewide profile for this youngest senior bracket in assisted living. |
57% Residents Age 75–84 — State Benchmarked 57% of residents are 75–84, compared to the Maryland average of 31%. A high concentration in this mid-range bracket, where residents typically need moderate support with daily activities. |
29% Residents Age 85–94 — State Benchmarked 29% of residents are 85–94, compared to the Maryland average of 44%. The population here skews younger than the statewide norm, which may indicate a more active, lower-acuity community. | - |
| Apellyo Homecare/Assisted Living II, LLC |
NH Nursing Home Licensed facility providing 24/7 skilled nursing care for residents with complex, ongoing medical needs. Staffed by RNs, LPNs, and CNAs. Inspected and star-rated annually by CMS. Accepts Medicare (short-term rehab) and Medicaid (long-term care).
AL Assisted Living A licensed, long-term care setting for seniors or individuals with disabilities who need help with daily activities — like bathing, dressing, and medication management — but not 24-hour skilled nursing. Offers housing, meals, and around-the-clock support while aiming to maximize resident independence.
MC Memory Care Secured, specialized care for people living with Alzheimer's or dementia. Staff trained in cognitive impairment, with higher staff-to-resident ratios and an environment designed to reduce confusion and wandering risk. | Parkville (North Harford Road) | 5 | No | 76 | Private Suites | - | - |
0% Male Residents — State Benchmarked 0% of residents are male, compared to the Maryland average of 31%. This facility caters to a majority female resident pool (100% female), consistent with the broader assisted living trend where women significantly outnumber men. |
0% Female Residents — State Benchmarked 0% of residents are female, compared to the Maryland average of 69%. An unusually low female share — most assisted living facilities have 65–75% female residents. | - | - | - | - | - | - | - |
Frequently Asked Questions about Inspirations Memory Care of Lutherville
Is Inspirations Memory Care of Lutherville in a walkable area?
Inspirations Memory Care of Lutherville has a walk score of 45. Somewhat walkable. A few nearby services may be reachable on foot, but most trips require transportation.
How many beds does Inspirations Memory Care of Lutherville have?
Inspirations Memory Care of Lutherville has 16 beds.
Are there photos of Inspirations Memory Care of Lutherville?
Yes — there are 6 photos of Inspirations Memory Care of Lutherville in the photo gallery on this page.
What is the address of Inspirations Memory Care of Lutherville?
Inspirations Memory Care of Lutherville is located at 1414 & 1420 Front Avenue, Lutherville, MD 21093.
What is the phone number of Inspirations Memory Care of Lutherville?
(833) 346-8569 will put you in contact with the team at Inspirations Memory Care of Lutherville.
What county is Inspirations Memory Care of Lutherville located in?
Inspirations Memory Care of Lutherville is in Baltimore County.
Is Inspirations Memory Care of Lutherville Medicare or Medicaid certified?
Inspirations Memory Care of Lutherville is not currently listed as a CMS-certified provider of Medicare or Medicaid.
Guides for Better Senior Living
Care Cost Calculator: See Prices in Your Area
Nursing Home Data Explorer
Don’t Wait Too Long: 7 Red Flag Signs Your Parent Needs Assisted Living Now
The True Cost of Assisted Living in 2025 – And How Families Are Paying For It
Understanding Senior Living Costs: Pricing Models, Discounts & Financial Assistance
Contact Us

Published on
Updated on
Feedback
Write a review for Inspirations Memory Care of Lutherville
Rate your overall experience with this community
Explore Open Rooms
1
Contact details
2
What type of senior care service are you looking for?
3
What budget do you have in mind for senior care?
4
How soon do you need to find care?
5
Additional details
Thank you for your interest!
Our team will be in touch shortly to help with next steps.
Need Help?
Let us help you or a loved one find the perfect senior home.
