Explore Open Rooms
1 Contact details
2 What type of senior care service are you looking for?
3 What budget do you have in mind for senior care?
4 How soon do you need to find care?
5 Additional details

Thank you for your interest!

Our team will be in touch shortly to help with next steps.

Nursing Home in Waco

CMS overall rating Info The Overall CMS Rating combines results from health inspections, staffing levels and quality measures. Health inspections carry the most weight. Staffing and quality scores can increase or decrease the final rating based on performance compared to state and national standards.

Jeffrey Place Healthcare Center

Overview of Jeffrey Place Healthcare Center

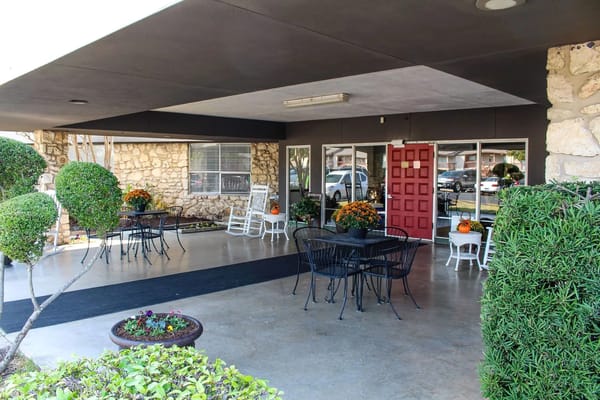
Jeffrey Place Healthcare Center, situated in Waco, Texas, is a senior nursing home with stellar reviews. The dedicated staff ensures a homey atmosphere with private and semi-private accommodations, prioritizing resident comfort over a hospital-like setting. The facility, boasting 106 units, goes beyond standard care, offering a cozy ambiance that distinguishes it from the typical nursing home.

Residents at Jeffrey Place Healthcare Center experience a welcoming environment with a focus on planned activities, fostering a sense of community and engagement. The facility excels not only in long-term care but also in providing skilled nursing services. By prioritizing individualized attention and creating a comfortable setting, Jeffrey Place Healthcare Center is redefining expectations for senior living and skilled nursing homes.

(254) 772-9480

Quality ratings

Measured by Centers for Medicare & Medicaid Services (CMS)

Overall rating Info The Overall CMS Rating combines results from health inspections, staffing levels and quality measures. Health inspections carry the most weight. Staffing and quality scores can increase or decrease the final rating based on performance compared to state and national standards.
1/5
Texas average: 2.8/5
Health Inspection Info Based on the results of the facility's three most recent standard inspections and any complaint investigations. CMS reviews the number, scope, and severity of deficiencies, with more recent findings weighted more heavily.
2/5
Texas average: 2.8/5
Staffing Info Measures average nursing staff hours per resident per day, including Registered Nurses (RNs) and total nursing staff. Ratings are adjusted based on the level of care residents require and are compared to state and national benchmarks.
1/5
Texas average: 2.1/5
Quality Measures Info Based on clinical and physical health indicators reported to CMS, such as hospital readmissions, falls, pressure ulcers, and improvements in mobility. These measures reflect how well residents' health needs are being managed.
3/5
Texas average: 3.8/5

Nursing care per resident

Info This shows how many total hours of nursing staff time are available per resident each day. Higher numbers usually mean more staff support.
3h 47m per day

This home provides 4% more nursing time per resident than the Texas average.

Texas average: 3h 38m per day

Staffing hours breakdown

Info Hours of care per resident per day, broken down by staff type. Data from CMS Medicare.
Staff type Facility State avg National avg
Registered Nurse (RN) Info Registered nurse hours per resident per day. 9m per day 26m per day 41m per day
Nurse Aide Info Nurse aide hours per resident per day. 2h 19m per day 2h 1m per day 2h 21m per day
Total Nursing (Weekend) Info Total number of nurse staff hours per resident per day on weekends. 3h 5m per day 2h 59m per day 3h 26m per day
Physical Therapist Info Physical therapist staff hours per resident per day. 2m per day 4m per day 4m per day
RN (Weekend) Info Registered nurse hours per resident per day on weekends. 7m per day 21m per day 29m per day

Capacity and availability

Smaller home

May offer a more intimate, personalized care environment.

Total beds 95

This home usually has availability

Lower occupancy suggests more openings may be available.

Lower demand than the Texas average
Occupancy rate 77.4%
Residents per day (avg) 67
Occupancy rate
77.4%
Residents per day (avg)
67

Who this home usually serves

TYPE OF STAY

Mostly long-term care residents

Most residents stay for extended periods and receive ongoing daily care.

Might be optimal for
Long-term daily care Ongoing support needs

Breakdown by payment type

Medicare

15% of new residents, usually for short-term rehab.

Typical stay 3 - 4 months

Private pay

59% of new residents, often for short stays.

Typical stay 2 - 3 months

Medicaid

26% of new residents, often for long-term daily care.

Typical stay 2 years

Finances and operations

Privately-owned community
Operated by a business corporation.
Home revenue
$8.5M
Profit
$1.3M
Privately-owned community Operated by a business corporation.
Home revenue
$8.5M
Profit
$1.3M
Payroll costs Info The portion of the home's budget spent on staff, including nurses, caregivers, and other employees who support care and operations.
$2.9M
33.7% of revenue
Other operating costs Info All remaining costs needed to run the home, such as food, utilities, building maintenance, supplies and administrative expenses.
$4.3M
Total costs $7.2M

Types of Care at Jeffrey Place Healthcare Center

Skilled Nursing

Contact Jeffrey Place Healthcare Center

Health Inspection History

Inspections
Total health inspections 13

Texas average 7.4


Last Health inspection on Jul 2025

Total health citations 39

Texas average 25.9

Citations per inspection
3

Texas average 3.67


Health citations are formal notices following inspections when they fail to comply with safety and care standards.

22 of 39 citations resulted from standard inspections; and 17 of 39 resulted from complaint investigations.

Breakdown of citation severity (last 3 years)
Critical Health citations More info 2
In line with Texas average

Texas average: 2


Serious Health citations More info 0
100% better than Texas average

Texas average: 0.4

2 critical citations More info Texas average: 2

0 serious citations More info Texas average: 0.4

37 moderate citations More info Texas average: 23

0 minor citations More info Texas average: 0.4
Citations history (last 3 years)
Pharmacy moderate citation Info Issues related to medication management, including how drugs are stored, administered, and monitored. Jul 29, 2025
Corrected

Pharmacy moderate citation Info Issues related to medication management, including how drugs are stored, administered, and monitored. Jul 11, 2025
Corrected

Quality of Care critical citation Info Issues related to how well residents receive appropriate treatment and support for their medical and daily care needs. Jul 11, 2025
Corrected

Infection Control moderate citation Info Issues related to preventing and controlling infections, including hygiene practices and safety protocols. Feb 06, 2025
Corrected

Compare Nursing Homes around Waco The information below is reported by the Texas Health and Human Services Commission.

5 facilities compared · CMS & TX Dept. of Health data · Updated Apr 2026

Filter by care type
Wesley Woods Rehabilitation and Healthcare
MC

Memory Care Secured, specialized care for people living with Alzheimer's or dementia. Staff trained in cognitive impairment, with higher staff-to-resident ratios and an environment designed to reduce confusion and wandering risk.

NH

Nursing Home Licensed facility providing 24/7 skilled nursing care for residents with complex, ongoing medical needs. Staffed by RNs, LPNs, and CNAs. Inspected and star-rated annually by CMS. Accepts Medicare (short-term rehab) and Medicaid (long-term care).

Waco (West Waco)
120
83.4%
+31%
3.83
-15%
+5%
3
30
1.9
4
112
A+
39
-
$10.8M
$4.9M
45%
676211
Quality Care of Waco
NH

Nursing Home Licensed facility providing 24/7 skilled nursing care for residents with complex, ongoing medical needs. Staffed by RNs, LPNs, and CNAs. Inspected and star-rated annually by CMS. Accepts Medicare (short-term rehab) and Medicaid (long-term care).

Waco (Dean Highland)
202
22.1%
-65%
3.23
-23%
-11%
3
19
3.2
5
63
-
29
Waco Opco Llc
$3.6M
$2.6M
70.6%
455478
Jeffrey Place Healthcare Center
NH

Nursing Home Licensed facility providing 24/7 skilled nursing care for residents with complex, ongoing medical needs. Staffed by RNs, LPNs, and CNAs. Inspected and star-rated annually by CMS. Accepts Medicare (short-term rehab) and Medicaid (long-term care).

Waco (Richland Hills)
95
77.4%
+22%
3.78
-73%
+4%
1
39
3.0
2
67
-
72
Alexander, Maci
$7.8M
$2.9M
36.5%
455489
Lakeshore Village Nursing and Rehab
NH

Nursing Home Licensed facility providing 24/7 skilled nursing care for residents with complex, ongoing medical needs. Staffed by RNs, LPNs, and CNAs. Inspected and star-rated annually by CMS. Accepts Medicare (short-term rehab) and Medicaid (long-term care).

Waco (Cedar Ridge)
151
81.9%
+29%
3.79
-57%
+4%
3
49
4.9
8
124
-
38
Waco Nursing And Rehab Center Llc
$14.7M
$0.0M
0%
675438
Greenview Nursing and Rehab
NH

Nursing Home Licensed facility providing 24/7 skilled nursing care for residents with complex, ongoing medical needs. Staffed by RNs, LPNs, and CNAs. Inspected and star-rated annually by CMS. Accepts Medicare (short-term rehab) and Medicaid (long-term care).

Waco (Richland Hills)
128
69.9%
+10%
3.29
-40%
-10%
4
37
2.1
8
91
-
55
Richland Nursing And Rehab Center Llc
$10.1M
$0.0M
0%
455638

Places of interest near Jeffrey Place Healthcare Center

Address 3.4 miles from city center — 0.66 miles to nearest hospital (Anthony Medical & Chiropractic Center - Waco)

Calculate Travel Distance to Jeffrey Place Healthcare Center

Add your location

Address

Staffing Data (Q2 2025)

This data corresponds to Q2 2025 and is based on CMS Payroll-Based Journal.

Total staff 98
Employees 96
Contractors 2
Staff to resident ratio 1.56:1
0% compared with Texas average

Texas average ratio: 1.51:1

Avg staff/day 39
Average shift 7.2 hours
11% worse than Texas average

Texas average: 8.1 hours

Total staff hours (quarter) 25,471
Nursing staff breakdown
Registered Nurse

Manages medical care and health needs.

Total count 2
Average shift length Info Average shift length. Calculated as total hours divided by days worked and average staff per day. 8.6 hours

No contractors work on this role.

Licensed Practical Nurse

Assists with medical care and medications.

Total count 18
Average shift length Info Average shift length. Calculated as total hours divided by days worked and average staff per day. 7 hours

No contractors work on this role.

Certified Nursing Assistant

Helps with daily care and mobility.

Total count 40
Average shift length Info Average shift length. Calculated as total hours divided by days worked and average staff per day. 7.1 hours

No contractors work on this role.

Contractor staffing

Total hours from contractors

0.2%

54 contractor hours this quarter

Medical Director: 1 Occupational Therapy Aide: 1
Staff by category
Certified Nursing Assistant400409,63791100%7.1
Licensed Practical Nurse180184,74791100%7
Medication Aide/Technician130133,94591100%7.6
Physical Therapy Aide5051,8977481%9.1
Speech Language Pathologist6061,4588391%7.7
Nurse Practitioner1015126470%8
Therapeutic Recreation Specialist1015126470%8
RN Director of Nursing1015036673%7.6
Administrator1014886167%8
Mental Health Service Worker1014625662%8.3
Respiratory Therapy Technician2024037380%3.5
Qualified Social Worker3033657178%3.6
Registered Nurse2022322730%8.6
Physical Therapy Assistant1011904246%4.5
Nurse Aide in Training101671314%5.1
Occupational Therapy Aide0113967%6.5
Medical Director0111533%5
40 Certified Nursing Assistant
% of Days 100%
18 Licensed Practical Nurse
% of Days 100%
13 Medication Aide/Technician
% of Days 100%
5 Physical Therapy Aide
% of Days 81%
6 Speech Language Pathologist
% of Days 91%
1 Nurse Practitioner
% of Days 70%
1 Therapeutic Recreation Specialist
% of Days 70%
1 RN Director of Nursing
% of Days 73%
1 Administrator
% of Days 67%
1 Mental Health Service Worker
% of Days 62%
2 Respiratory Therapy Technician
% of Days 80%
3 Qualified Social Worker
% of Days 78%
2 Registered Nurse
% of Days 30%
1 Physical Therapy Assistant
% of Days 46%
1 Nurse Aide in Training
% of Days 14%
1 Occupational Therapy Aide
% of Days 7%
1 Medical Director
% of Days 3%

Facility Characteristics

Source: CMS Long-Term Care Facility Characteristics (Data as of Jan 2026)

Total census
63 residents
Residents by payment source
Medicare
4 residents (6.3%)
Medicaid
53 residents (84.1%)
Private pay or other
6 residents (9.5%)
Programs & Services
Residents' Group

Residents meet regularly to discuss policies, care quality, and activities

Active Resident Council

Organized group of residents that meets regularly to discuss facility policies, quality of life, and activities.

Quality of care over time

These measures show how residents usually do over time at this home, based on health outcomes and preventive care.

High-risk clinical events score Info A composite score based on pressure ulcers, falls with injury, weight loss, walking ability decline, and activities of daily living decline. 11.6
35% worse than Texas average

Texas average: 8.6

Functional decline score Info A composite score based on activities of daily living decline, walking ability decline, and incontinence. 21.2
32% worse than Texas average

Texas average: 16.0

Long-stay resident measures
Average Texas avg: 4.2 Info CMS star rating based on long-stay quality measure performance. 5 stars = significantly above average, 1 star = significantly below average.
Need for Help with Daily Activities Increased Info Percent of long-stay residents whose need for help with daily activities has increased 22.9%
42% worse than Texas average

Texas average: 16.2%

Walking Ability Worsened Info Percent of long-stay residents whose ability to move independently worsened 25.8%
59% worse than Texas average

Texas average: 16.2%

Low Risk Residents with Bowel/Bladder Incontinence Info Percent of low risk long-stay residents who lose control of their bowels or bladder 14.8%
5% better than Texas average

Texas average: 15.7%

Falls with Major Injury Info Percent of long-stay residents experiencing one or more falls with major injury 3.0%
9% better than Texas average

Texas average: 3.2%

High Risk Residents with Pressure Ulcers Info Percent of long-stay high risk residents with pressure ulcers 3.9%
13% better than Texas average

Texas average: 4.4%

Urinary Tract Infection Info Percent of long-stay residents with a urinary tract infection 0.0%
100% better than Texas average

Texas average: 0.8%

Lost Too Much Weight Info Percent of long-stay residents who lose too much weight 2.5%
27% better than Texas average

Texas average: 3.5%

Depressive Symptoms Info Percent of long-stay residents who have depressive symptoms 1.6%
44% better than Texas average

Texas average: 2.9%

Antipsychotic Use Info Percent of long-stay residents who received an antipsychotic medication 11.5%
45% worse than Texas average

Texas average: 7.9%

Pneumococcal Vaccine Info Percent of long-stay residents assessed and appropriately given the pneumococcal vaccine 100.0%
In line with Texas average

Texas average: 97.3%

Influenza Vaccine Info Percent of long-stay residents assessed and appropriately given the seasonal influenza vaccine 100.0%
In line with Texas average

Texas average: 97.9%

Hospitalizations per 1,000 days Info Number of hospitalizations per 1,000 long-stay resident days. 1.95
8% better than Texas average

Texas average: 2.13

ED visits per 1,000 days Info Number of outpatient emergency department visits per 1,000 long-stay resident days. 3.03
46% worse than Texas average

Texas average: 2.07

Short-stay resident measures
Pneumococcal Vaccine Info Percent of short-stay residents assessed and appropriately given the pneumococcal vaccine 100.0%
11% better than Texas average

Texas average: 90.4%

Antipsychotic medication increase Info Percent of short-stay residents who newly received an antipsychotic medication 14.7%
915% worse than Texas average

Texas average: 1.4%

Influenza Vaccine Info Percent of short-stay residents assessed and appropriately given the seasonal influenza vaccine 100.0%
14% better than Texas average

Texas average: 88.0%

Re-hospitalized after SNF stay Info Percentage of short-stay residents who were re-hospitalized after their nursing home admission. 40.4%
56% worse than Texas average

Texas average: 25.9%

Emergency department visits Info Percentage of short-stay residents who had an outpatient emergency department visit. 18.8%
57% worse than Texas average

Texas average: 12.0%

Penalties and fines

Federal penalties imposed by CMS for regulatory violations, including civil money penalties (fines) and denials of payment for new Medicare/Medicaid admissions.

Source: CMS Penalties Database (Data as of Jan 2026)

Total fines amount $30K
63% lower than Texas average

Texas average: $80K

Number of fines 2
20% fewer fines than Texas average

Texas average: 2.5

Payment Denials Info Serious action where Medicare and/or Medicaid temporarily stops payments for new residents until issues are fixed. 1
354% more payment denials than Texas average

Texas average: 0.2

Fines amount comparison
This facility $30K
Texas average $80K
Penalty History

Penalties are imposed by CMS for violations of federal nursing home regulations.

Civil Money Penalty Info Fines imposed for noncompliance, which can be assessed per day or per instance of violation. Jul 11, 2025
$22K
Civil Money Penalty Info Fines imposed for noncompliance, which can be assessed per day or per instance of violation. Apr 8, 2024
$8K
Payment Denial Info Serious action where Medicare and/or Medicaid temporarily stops payments for new residents until issues are fixed. Apr 8, 2024
3 days

Last updated: Jan 2026

Guides for Better Senior Living

Care Cost Calculator: See Prices in Your Area

Nursing Home Data Explorer

Don’t Wait Too Long: 7 Red Flag Signs Your Parent Needs Assisted Living Now

The True Cost of Assisted Living in 2025 – And How Families Are Paying For It

Understanding Senior Living Costs: Pricing Models, Discounts & Financial Assistance

Financial Aid for Texas Seniors

Get financial aid guidance

Community Care for the Aged and Disabled (CCAD)

TX Medicaid CCAD

Age 65+ or disabled, Texas resident, Medicaid-eligible, care need (not always nursing home level).

~$2,829/month (300% FBR, individual).

$2,000 (individual), $3,000 (couple).

Large state; rural access challenges.

Texas Community Care Services

TX CCS

Age 60+, Texas resident, at risk of decline.

~$2,000/month (individual, varies).

$5,000 (individual).

Limited funding; high demand in urban areas.

Area Agency on Aging (AAA) Services

Texas AAA Services

Age 60+, TX resident; no income/asset limits.

None; donations encouraged.

Not assessed.

28 AAAs; includes Meals on Wheels in some areas.

Medicare Savings Program (MSP)

Texas Medicare Savings Program

Age 65+ or disabled, TX resident, Medicare Part A/B.

~$2,510/month (QMB), ~$3,380/month (SLMB), ~$3,598/month (QI)—individual.

$9,430 (individual), $14,130 (couple).

Includes Extra Help for Part D; no waitlist.

Low-Income Home Energy Assistance Program (LIHEAP)

Texas Comprehensive Energy Assistance Program (CEAP)

Age 60+ prioritized, TX resident, low-income.

~$3,970/month (185% FPL).

Not assessed.

Priority for elderly/disabled; covers gas, electric, propane.

Family Caregiver Support Program (FCSP)

Texas Family Caregiver Support Program

Caregivers of 60+ needing care or 55+ caregivers of others; TX resident; 2+ ADLs.

No strict cap; prioritizes low-income (~$24,980/year).

Not assessed.

High rural demand; includes grandparent caregivers.

Senior Community Service Employment Program (SCSEP)

Texas SCSEP

Age 55+, unemployed, low-income, TX resident.

~$1,983/month (125% FPL).

Not specified.

Priority for veterans, rural residents; AARP partnership.

VA Aid and Attendance (A&A) and Housebound Benefits

Texas VA Aid and Attendance/Housebound

Age 65+ or disabled veteran/spouse, TX resident, wartime service, ADL help (A&A) or homebound.

Net income < ~$1,984/month (veteran with dependent, A&A); pension offsets income.

~$155,356 (net worth).

High veteran population; supports rural/urban needs.

Property Tax Exemption for Seniors

Texas Senior Property Tax Exemption

Age 65+, TX resident, homeowner (homestead).

None; tax-based eligibility.

Not assessed.

$25,000+ exemption; optional freeze in some counties; saves ~$500-$1,000/year.

Senior Farmers’ Market Nutrition Program (SFMNP)

Texas SFMNP

Age 60+, TX resident, low-income.

~$2,322/month (185% FPL).

Not assessed.

Vouchers (~$50/season); serves ~20,000 via 28 AAAs.