Jennings Terrace
Nursing Home & Assisted Living · Aurora, IL
CMS overall rating Info CMS (the Centers for Medicare & Medicaid Services) is the federal agency that rates nursing home quality. Its Overall Rating runs from 1 to 5 stars, combining health inspections, staffing, and quality measures, with inspections weighted most heavily.

Jennings Terrace

Nursing Home & Assisted Living · Aurora, IL
CMS overall rating Info CMS (the Centers for Medicare & Medicaid Services) is the federal agency that rates nursing home quality. Its Overall Rating runs from 1 to 5 stars, combining health inspections, staffing, and quality measures, with inspections weighted most heavily.
Calculator: See prices in your area
Jennings Terrace accepts Medicare, Medicaid, and private pay.

Overview of Jennings Terrace

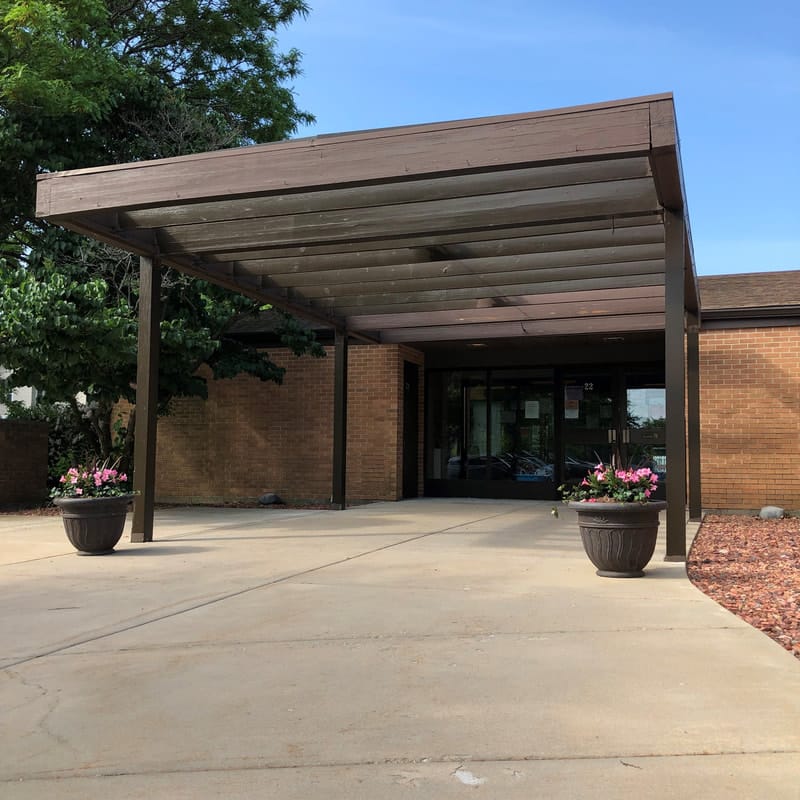
Jennings Terrace is an esteemed senior housing establishment proudly serving the Fox Valley area in Aurora, Illinois, for a remarkable duration of eight years. Jennings Terrace is dedicated to providing affordable and secure housing options tailored to the unique needs of seniors. With a comprehensive range of services, including skilled nursing and sheltered care, they ensure the utmost comfort and well-being of their residents. From elegantly designed single-room suites to spacious two-room options, residents can choose their preferred accommodations.

For those seeking respite care, Jennings Terrace offers private suites designed to deliver personalized and exceptional experiences. Additionally, they extend their compassionate services to individuals requiring hospice care, creating a supportive environment during challenging times. With on-site access to essential medical services such as x-rays and lab draws, as well as specialized podiatry and optometry offerings, residents receive comprehensive care within the convenience of their community.

(630) 897-6947

Quality ratings

Measured by Centers for Medicare & Medicaid Services (CMS)

Overall rating Info The Overall CMS Rating combines results from health inspections, staffing levels and quality measures. Health inspections carry the most weight. Staffing and quality scores can increase or decrease the final rating based on performance compared to state and national standards.
▲ 58.7% Above IL avg. ▲ 58.7% Above IL avg.IL average: 2.5Click the badge to see the full State ranking.Click here to see the full State ranking.
Health Inspection Info Based on the results of the facility's three most recent standard inspections and any complaint investigations. CMS reviews the number, scope, and severity of deficiencies, with more recent findings weighted more heavily.
▲ 44.1% Above IL avg. ▲ 44.1% Above IL avg.IL average: 2.8Click the badge to see the full State ranking.Click here to see the full State ranking.
Staffing Info Measures average nursing staff hours per resident per day, including Registered Nurses (RNs) and total nursing staff. Ratings are adjusted based on the level of care residents require and are compared to state and national benchmarks.
▼ 6.4% Below IL avg. ▼ 6.4% Below IL avg.IL average: 2.1Click the badge to see the full State ranking.Click here to see the full State ranking.
Quality Measures Info Based on clinical and physical health indicators reported to CMS, such as hospital readmissions, falls, pressure ulcers, and improvements in mobility. These measures reflect how well residents' health needs are being managed.
▼ 29.0% Below IL avg. ▼ 29.0% Below IL avg.IL average: 2.8Click the badge to see the full State ranking.Click here to see the full State ranking.

Staffing hours breakdown

Info Daily nursing hours per resident by staff type, reported to CMS. Higher is generally better — compare this facility to state and national averages to see where staffing stands.

Hours per resident per day — compared to Illinois state averages

Total nursing care / resident Info This home is ranked 83rd out of 172 homes in Illinois for nurse hours. Total adjusted nursing hours per resident per day, combining RN, LPN, and aide time. CMS adjusts this for case-mix so facilities can be fairly compared.
2h 56m per day
Rank #83 / 172Nurse hours — State benchmarkedThis home is ranked 83rd out of 172 homes in Illinois. Shows adjusted nurse hours per resident per day benchmarked to the Illinois average, with a ranking across 172 Illinois facilities. More hours mean more direct care. The national average is about 3.5 hrs; below 3.0 is a red flag.Ranking totals vary by category as each rank only includes facilities that report data for that metric. Homes missing that data point aren't included in the ranking.Click the rank badge to see the full State ranking.Click here to see the full State ranking.
This facility Illinois avg (3h 6m per day)
vs Illinois avg
-5%

4 of 6 metrics below state avg

Standout metric Physical Therapist is +86% above state avg
Staff typeHours / Day / Residentvs state avg
Registered Nurse (RN) Info RNs hold the highest nursing license and can assess residents, interpret test results, and direct care plans. More RN hours per day often signals stronger clinical oversight and faster response to health changes. 38m per day ▼ 13% State avg: 44m per day · National avg: 41m per day
LPN / LVN Info Licensed Practical Nurses (LPNs) or Licensed Vocational Nurses (LVNs) deliver routine hands-on care — medication administration, wound dressing, and monitoring vital signs. They work under RN supervision and make up a large share of daily bedside care. 23m per day ▼ 38% State avg: 38m per day · National avg: 52m per day
Nurse Aide Info Certified Nurse Aides (CNAs) provide the most direct day-to-day assistance: bathing, dressing, feeding, and mobility. Nurse aide hours are typically the largest staffing category and directly affect residents' quality of life. 1h 54m per day ▼ 11% State avg: 2h 8m per day · National avg: 2h 21m per day
Weekend Total Nursing Info Combined nursing hours (RN + LPN + Nurse Aide) per resident per day on weekends. Staffing often drops on weekends — this figure reveals whether the facility maintains adequate coverage outside of weekday hours. 2h 39m per day ▼ 14% State avg: 3h 5m per day · National avg: 3h 26m per day
Physical Therapist Info Hours per resident per day provided by licensed Physical Therapists (PTs) or PT Assistants. PT services help residents recover mobility after injury or illness and are especially important for post-acute (short-stay) rehabilitation. 6m per day ▲ 86% State avg: 3m per day · National avg: 4m per day
Weekend RN Info Registered nurse hours specifically on weekends. Facilities sometimes reduce RN presence on Saturdays and Sundays — a low weekend RN figure compared to weekday hours can indicate reduced clinical oversight when most administrative staff are absent. 35m per day ▲ 4% State avg: 34m per day · National avg: 29m per day

Capacity and availability

This home usually has availability

Lower occupancy than the Illinois average: 69.3%
Occupancy rate
51.7% Rank #179 / 204Occupancy rate — State benchmarkedThis home is ranked 179th out of 204 homes in Illinois. Shows this facility's occupancy rate versus the Illinois average, with its Statewide rank out of 204. Higher occupancy signals strong local demand and financial stability.Ranking totals vary by category as each rank only includes facilities that report data for that metric. Homes missing that data point aren't included in the ranking.Click the rank badge to see the full State ranking.Click here to see the full State ranking.
Avg. Length of Stay
1,172 days
Bed community size
60-bed community Rank #255 / 426Bed count — State benchmarkedThis home is ranked 255th out of 426 homes in Illinois. Shows this facility's certified or reported bed count compared to other Illinois facilities. Larger communities may offer more amenities, programs, and on-site services for residents and families.Ranking totals vary by category as each rank only includes facilities that report data for that metric. Homes missing that data point aren't included in the ranking.Click the rank badge to see the full State ranking.Click here to see the full State ranking.
A moderately sized community that may balance personal attention with shared amenities and social activities.
Walk Score
Walk Score: 80 / 100 Rank #104 / 648Walk Score — State benchmarkedThis home is ranked 104th out of 648 homes in Illinois. Shows how walkable this facility's neighborhood is compared to the average Walk Score across Illinois facilities. Higher scores benefit residents, families, and staff.Ranking totals vary by category as each rank only includes facilities that report data for that metric. Homes missing that data point aren't included in the ranking.Click the rank badge to see the full State ranking.Click here to see the full State ranking.
Very walkable. Most errands can be accomplished on foot, and many essentials are within a short walk.

About this community

Contact Jennings Terrace

Staffing Data

Reporting period: October 1 – December 31, 2025 (Q4 2025). Source: CMS Payroll-Based Journal report.

Total staff 61
Employees 50
Contractors 11
Staff to resident ratio 1.33 : 1
26% fewer staff per resident than Illinois average
Illinois average ratio: 1.80 : 1 Illinois average ratio: 1.80 : 1See full Illinois ranking
Avg staff/day 23
Average shift 7.4 hours
0% compared with Illinois average
Illinois average: 7.6 hours Illinois average shift: 7.6 hoursSee full Illinois ranking
Total staff hours (quarter) 15,604

Nursing staff breakdown

Q4 2025 · Oct 1 – Dec 31 More info This data comes from the CMS Payroll-Based Journal report covering October 1 – December 31, 2025.
Registered Nurse

Manages medical care and health needs.

RN Staff Info All 11 RN Staff are full-time employees. No contractors work on this role. 11
Average shift length Info Average shift length. Calculated as total hours divided by days worked and average staff per day. 7.2 hours
Licensed Practical Nurse

Assists with medical care and medications.

LPN Staff Info All 6 LPN Staff are full-time employees. No contractors work on this role. 6
Average shift length Info Average shift length. Calculated as total hours divided by days worked and average staff per day. 8.3 hours
Certified Nursing Assistant

Helps with daily care and mobility.

CNA Staff Info All 22 CNA Staff are full-time employees. No contractors work on this role. 22
Average shift length Info Average shift length. Calculated as total hours divided by days worked and average staff per day. 8.8 hours

Contractor staffing

Q4 2025 · Oct 1 – Dec 31 More info This data comes from the CMS Payroll-Based Journal report covering October 1 – December 31, 2025.

Total hours from contractors

5.3%

833 contractor hours this quarter

Physical Therapy Assistant: 2 Physical Therapy Aide: 2 Medical Director: 1 Diagnostic X-ray Services Staff: 1 Respiratory Therapy Technician: 1 Dietitian: 1 Mental Health Service Worker: 1 Occupational Therapy Aide: 1 Qualified Social Worker: 1

Staff by category

Q4 2025 · Oct 1 – Dec 31 More info This data comes from the CMS Payroll-Based Journal report covering October 1 – December 31, 2025.
Certified Nursing Assistant220228,39092100%8.8
Registered Nurse110112,56592100%7.2
Licensed Practical Nurse6061,3328693%8.3
Other Dietary Services Staff5057397480%6.4
Administrator1015286672%8
Respiratory Therapy Technician0114115257%7.9
Mental Health Service Worker1124026672%5.8
RN Director of Nursing1013975054%7.9
Nurse Practitioner1012646672%4
Medical Director0111986672%3
Dietitian1121386672%2
Diagnostic X-ray Services Staff011731415%5.2
Physical Therapy Aide022694953%1.4
Physical Therapy Assistant022411516%2.8
Occupational Therapy Assistant1012878%4
Occupational Therapy Aide011241516%1.6
Qualified Social Worker011589%0.7
22 Certified Nursing Assistant
% of Days 100%
11 Registered Nurse
% of Days 100%
6 Licensed Practical Nurse
% of Days 93%
5 Other Dietary Services Staff
% of Days 80%
1 Administrator
% of Days 72%
1 Respiratory Therapy Technician
% of Days 57%
2 Mental Health Service Worker
% of Days 72%
1 RN Director of Nursing
% of Days 54%
1 Nurse Practitioner
% of Days 72%
1 Medical Director
% of Days 72%
2 Dietitian
% of Days 72%
1 Diagnostic X-ray Services Staff
% of Days 15%
2 Physical Therapy Aide
% of Days 53%
2 Physical Therapy Assistant
% of Days 16%
1 Occupational Therapy Assistant
% of Days 8%
1 Occupational Therapy Aide
% of Days 16%
1 Qualified Social Worker
% of Days 9%

Penalties and fines

Federal penalties imposed by CMS for regulatory violations, including civil money penalties (fines) and denials of payment for new Medicare/Medicaid admissions.

Source: CMS Penalties Database

No penalties in the past 3 years

No civil money penalties or payment denials were reported in the last 3 years.

Quality of care over time

These measures show how residents usually do over time at this home, based on health outcomes and preventive care.

High-risk clinical events score Info A composite score based on pressure ulcers, falls with injury, weight loss, walking ability decline, and activities of daily living decline. 15.2
57% worse than Illinois average

Illinois average: 9.7

Functional decline score Info A composite score based on activities of daily living decline, walking ability decline, and incontinence. 29.3
58% worse than Illinois average

Illinois average: 18.6

Long-stay resident measures
Below average Illinois avg: 3.6 Info CMS star rating based on long-stay quality measure performance. 5 stars = significantly above average, 1 star = significantly below average.
Need for Help with Daily Activities Increased Info Percent of long-stay residents whose need for help with daily activities has increased 30.0%
94% worse than Illinois average

Illinois average: 15.5%

Walking Ability Worsened Info Percent of long-stay residents whose ability to move independently worsened 34.1%
85% worse than Illinois average

Illinois average: 18.4%

Low Risk Residents with Bowel/Bladder Incontinence Info Percent of low risk long-stay residents who lose control of their bowels or bladder 23.9%
10% worse than Illinois average

Illinois average: 21.6%

Falls with Major Injury Info Percent of long-stay residents experiencing one or more falls with major injury 3.7%
11% worse than Illinois average

Illinois average: 3.4%

High Risk Residents with Pressure Ulcers Info Percent of long-stay high risk residents with pressure ulcers 5.7%
8% worse than Illinois average

Illinois average: 5.3%

Urinary Tract Infection Info Percent of long-stay residents with a urinary tract infection 0.0%
100% better than Illinois average

Illinois average: 1.8%

Lost Too Much Weight Info Percent of long-stay residents who lose too much weight 2.7%
59% better than Illinois average

Illinois average: 6.5%

Depressive Symptoms Info Percent of long-stay residents who have depressive symptoms 1.3%
97% better than Illinois average

Illinois average: 48.1%

Antipsychotic Use Info Percent of long-stay residents who received an antipsychotic medication 15.6%
23% better than Illinois average

Illinois average: 20.2%

Pneumococcal Vaccine Info Percent of long-stay residents assessed and appropriately given the pneumococcal vaccine 100.0%
12% better than Illinois average

Illinois average: 89.2%

Influenza Vaccine Info Percent of long-stay residents assessed and appropriately given the seasonal influenza vaccine 97.9%
7% better than Illinois average

Illinois average: 91.6%

Hospitalizations per 1,000 days Info Number of hospitalizations per 1,000 long-stay resident days. 3.75
83% worse than Illinois average

Illinois average: 2.05

ED visits per 1,000 days Info Number of outpatient emergency department visits per 1,000 long-stay resident days. 2.36
5% worse than Illinois average

Illinois average: 2.25

Short-stay resident measures
Pneumococcal Vaccine Info Percent of short-stay residents assessed and appropriately given the pneumococcal vaccine 73.3%
7% better than Illinois average

Illinois average: 68.3%

Antipsychotic medication increase Info Percent of short-stay residents who newly received an antipsychotic medication 0.0%
100% better than Illinois average

Illinois average: 2.3%

Breakdown by payment type

Medicare

14% of new residents, usually for short-term rehab.

Typical stay 4 - 5 months

Private pay

49% of new residents, often for short stays.

Typical stay 2 years

Medicaid

37% of new residents, often for long-term daily care.

Typical stay 2 years

Facility Characteristics

Source: CMS Long-Term Care Facility Characteristics (Data as of Jan 2026)

Total residents 46
Medicare
1
2.2% of residents
Medicaid
31
67.4% of residents
Private pay or other
14
30.4% of residents
Programs & Services
Residents Group

Residents meet regularly to discuss policies, care quality, and activities

Active Resident Council

Organized group of residents that meets regularly to discuss facility policies, quality of life, and activities.

Finances and operations

Based on CMS SNF Cost Report for fiscal year ending in 06/2024.

Governmental community
Operated by a subsidized facility district.
Net patient revenue Info Net patient revenue — what the home actually collects for resident care, after contractual allowances, bad debt and discounts are subtracted from its gross charges (CMS cost report, Worksheet G-3). It covers resident care only; money the home earns from other sources is shown separately as "Other income."
$5.6M
Net patient income Info Net patient income: net patient revenue minus the home's total operating expenses. A positive figure means it earns more from resident care than it spends to deliver it; a negative figure means the opposite. It excludes non-operating "other income."
-$646.2K
Governmental community Operated by a subsidized facility district.
Net patient revenue Info Net patient revenue — what the home actually collects for resident care, after contractual allowances, bad debt and discounts are subtracted from its gross charges (CMS cost report, Worksheet G-3). It covers resident care only; money the home earns from other sources is shown separately as "Other income."
$5.6M Rank #152 / 171Revenue — State benchmarkedThis home is ranked 152nd out of 171 homes in Illinois. Shows this facility's annual revenue compared to the Illinois average. Higher revenue generally means more resources for staffing and capital — read alongside Payroll %.Ranking totals vary by category as each rank only includes facilities that report data for that metric. Homes missing that data point aren't included in the ranking.Click the rank badge to see the full State ranking.Click here to see the full State ranking.
Net patient income Info Net patient income: net patient revenue minus the home's total operating expenses. A positive figure means it earns more from resident care than it spends to deliver it; a negative figure means the opposite. It excludes non-operating "other income."
-$646.2K
Other income Info Money the home earns outside of resident care — such as investments, grants, rentals and other non-operating sources (CMS cost report, Worksheet G-3). It is tracked separately from net patient revenue: it is not part of that figure, and it is not included in net patient income.
$1.8M
Payroll costs Info Staff salaries plus wage-related costs — benefits such as payroll taxes, health insurance and retirement — from the home's own accounting records (CMS cost report, Worksheet A). Contract or agency labor is counted separately, under other operating costs. Rank #153 / 171Payroll — State benchmarkedThis home is ranked 153rd out of 171 homes in Illinois. Shows total annual staff payroll benchmarked to the Illinois average. Higher payroll investment relative to peers often signals better staffing and less reliance on cheaper contract labor.Ranking totals vary by category as each rank only includes facilities that report data for that metric. Homes missing that data point aren't included in the ranking.Click the rank badge to see the full State ranking.Click here to see the full State ranking.
$3.5M 62.6% of net patient revenue Info Payroll as a share of revenue: staff salaries and wage-related benefits divided by net patient revenue. A higher figure means more of each revenue dollar goes to staff pay. Rank #71 / 171Payroll % — State benchmarkedThis home is ranked 71st out of 171 homes in Illinois. Shows payroll as a percentage of revenue versus the Illinois average. Well-run Illinois facilities typically land around 54–67% — the top third Statewide. Below 25% may signal understaffing or heavy agency use — read with Staffing ratings.Ranking totals vary by category as each rank only includes facilities that report data for that metric. Homes missing that data point aren't included in the ranking.Click the rank badge to see the full State ranking.Click here to see the full State ranking.
Other operating costs Info Everything it costs to run the home apart from payroll — food, utilities, supplies, maintenance, contract labor and administration. Calculated as total operating expense minus payroll (staff salaries and wage-related benefits).
$2.7M
Total costs Info The home's total operating expense for the year — all the costs of running it, salaries included (CMS cost report, Worksheet G-3).
$6.2M

Who this home usually serves

TYPE OF STAY

Mostly long-term care residents

Most residents stay for extended periods and receive ongoing daily care.

New residents most often arrive under private pay (49% of admissions), and a typical private pay stay runs around 2 years.

Admissions
49 total

Coverage residents most often arrive under.

Medicare 14%
Private pay 49%
Medicaid 37%
Discharges
31 total

Coverage residents most often leave under.

Medicare 41%
Private pay 41%
Medicaid 18%

Places of interest near Jennings Terrace

Address 1 mile from the city center — 2.36 miles to nearest hospital (Mercy Medical Center - Emergency Department)

Calculate Travel Distance to Jennings Terrace

Add your location

Address

Compare Nursing Home around Aurora

The information below is reported by the Illinois Department of Public Health, Office of Health Care Regulation.

2 facilities compared · CMS & IL Dept. of Health data

Alden Courts of Waterford
NH
AL
MC
RC
Aurora
60
Facility 60
IL AVG 86
Rank #255 / 426
90.0%
Facility 90.0%
IL AVG 69.3%
Rank #34 / 204
+30%
3.60
Facility 3.60
IL AVG 3.10
Rank #53 / 172
+38%+16%
$0
Facility $0
IL AVG $151.3k
Rank #1 / 173
20
Facility 20
IL AVG 36.8
Rank #42 / 172
3.3
Facility 3.3
IL AVG 3.7
Rank #69 / 172
-56A+
58
Facility 58
IL AVG 51
Rank #253 / 648
Steven Kroll
$6.8M
Facility $6.8M
IL AVG $12.2M
Rank #154 / 171
$3.8M
Facility $3.8M
IL AVG $4.8M
Rank #155 / 171
56.2%
Facility 56.2%
IL AVG 44.3%
Rank #50 / 171
146182
Jennings Terrace
NH
AL
Aurora
60
Facility 60
IL AVG 86
Rank #255 / 426
51.7%
Facility 51.7%
IL AVG 69.3%
Rank #179 / 204
-25%
2.93
Facility 2.93
IL AVG 3.10
Rank #83 / 172
+27%-5%
$0
Facility $0
IL AVG $151.3k
Rank #1 / 173
21
Facility 21
IL AVG 36.8
Rank #45 / 172
5.3
Facility 5.3
IL AVG 3.7
Rank #154 / 172
-48-
80
Facility 80
IL AVG 51
Rank #104 / 648
Jomarie Silver
$5.6M
Facility $5.6M
IL AVG $12.2M
Rank #152 / 171
$3.5M
Facility $3.5M
IL AVG $4.8M
Rank #153 / 171
62.6%
Facility 62.6%
IL AVG 44.3%
Rank #71 / 171
146197

Financial Assistance for
Nursing Home in Illinois

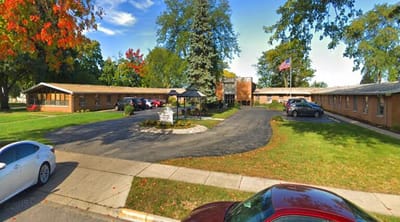
Jennings Terrace is located in Aurora, Illinois.
Here are the financial assistance programs available to residents in Illinois.

Get Financial aid guidance

Community Care Program

Illinois CCP

Age 60+
General Illinois resident, at risk of nursing home placement.
Income Limits (2025) ~$1,215/month individual
Asset Limits $17,500 individual, excludes home, car
IL

High demand in urban areas; waitlists possible.

Benefits
In-home care (3-5 hours/day) Adult day services ($65/day) Emergency home response systems ($30/month)

Illinois Respite Program

IL Respite (via NFCSP)

Age Caregiver of someone 60+ (or with dementia)
General Illinois resident.
Income Limits No strict limit; prioritizes low-income.
Asset Limits Not applicable.
IL

Limited slots; urban/rural balance.

Benefits
In-home respite (4-6 hours/day) Adult day care (~$65/day) Short-term facility care (up to 5 days)

Supportive Living Program (SLP)

Illinois Medicaid Supportive Living Program

Age 65+ or 22-64 with disability
General Illinois resident, Medicaid-eligible, needs moderate assistance (not nursing home-level).
Income Limits (2025) ~$2,829/month (300% FBR, individual); QIT allowed.
Asset Limits $2,000 (individual), $3,000 (couple) (excludes home, car).
IL

~200 SLP sites statewide; room/board not covered.

Benefits
Personal care (5-7 hours/day, e.g., bathing, mobility) Meals Housekeeping Medication management Respite (~240 hours/year)

Persons Who Are Elderly Waiver

Illinois Medicaid Elderly Waiver

Age 65+
General Illinois resident, Medicaid-eligible, nursing home-level care need.
Income Limits (2025) ~$2,829/month 300% FBR, individual
Asset Limits $2,000 (individual), $3,000 (couple).
IL

Part of HealthChoice Illinois; consumer-directed options available.

Benefits
Personal care (5-7 hours/day, e.g., dressing, eating) Homemaker Adult day care (~$60/day) Respite (240 hours/year) Home mods ($1,000 avg.)

Medicare Savings Program (MSP)

Illinois Medicare Savings Program

Age 65+ or disabled
General Illinois resident, Medicare Part A/B.
Income Limits (2025) ~$2,510/month (QMB), ~$3,380/month (SLMB), ~$3,598/month (QI)—individual.
Asset Limits $9,430 (individual), $14,130 (couple).
IL

Three tiers; no waitlist.

Benefits
Covers Part B premiums ($174.70/month) Deductibles ($240/year) Copays (~20%)

Optional State Supplementation (OSS)

Illinois Optional State Supplementation

Age 65+ or disabled
General Illinois resident, in approved facility, SSI recipient or low-income.
Income Limits (2025) ~$1,004/month including SSI
Asset Limits $2,000 (individual), $3,000 (couple).
IL

~$50-$500/month based on facility type.

Benefits
Cash (~$50-$500/month) for room/board in personal care homes or SLFs

VA Aid and Attendance (A&A) and Housebound Benefits

Illinois VA Aid and Attendance/Housebound

Age 65+ or disabled veteran/spouse
General Illinois resident, wartime service, need for ADL help (A&A) or homebound.
Income Limits (2025) Net income < ~$1,984/month (veteran with dependent, A&A); pension offsets income.
Asset Limits ~$155,356 net worth limit
IL

High veteran demand in urban/rural areas.

Benefits
Cash (~$1,433-$2,642/month veteran, ~$951-$1,318 spouse) for care costs (e.g., in-home, assisted living)

Frequently Asked Questions about Jennings Terrace

Is Jennings Terrace in a walkable area?

Jennings Terrace has a walk score of 80. Very walkable. Most errands can be accomplished on foot, and many essentials are within a short walk.

What is the occupancy rate at Jennings Terrace?

Jennings Terrace's occupancy is 51.7%.

Are there photos of Jennings Terrace?

Yes — there are 5 photos of Jennings Terrace in the photo gallery on this page.
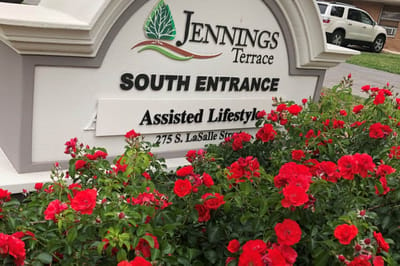
What is the phone number of Jennings Terrace?

(630) 897-6947 will put you in contact with the team at Jennings Terrace.

Is Jennings Terrace Medicare or Medicaid certified?

Yes — Jennings Terrace is a CMS-certified provider of Medicare and Medicaid.

Guides for Better Senior Living

Care Cost Calculator: See Prices in Your Area

Nursing Home Data Explorer

Don’t Wait Too Long: 7 Red Flag Signs Your Parent Needs Assisted Living Now

The True Cost of Assisted Living in 2025 – And How Families Are Paying For It

Understanding Senior Living Costs: Pricing Models, Discounts & Financial Assistance