Jersey Shore Center
Nursing Home · Shrewsbury, NJ
CMS overall rating Info The Overall CMS Rating is scored from 1 to 5 stars and combines results from health inspections, staffing levels, and quality measures. Health inspections carry the most weight. Staffing and quality scores can increase or decrease the final rating based on performance compared to state and national standards.

Jersey Shore Center

Nursing Home · Shrewsbury, NJ
CMS overall rating Info The Overall CMS Rating is scored from 1 to 5 stars and combines results from health inspections, staffing levels, and quality measures. Health inspections carry the most weight. Staffing and quality scores can increase or decrease the final rating based on performance compared to state and national standards.
Calculator: See prices in your area
Jersey Shore Center accepts Medicare, Medicaid, and private pay.

Overview of Jersey Shore Center

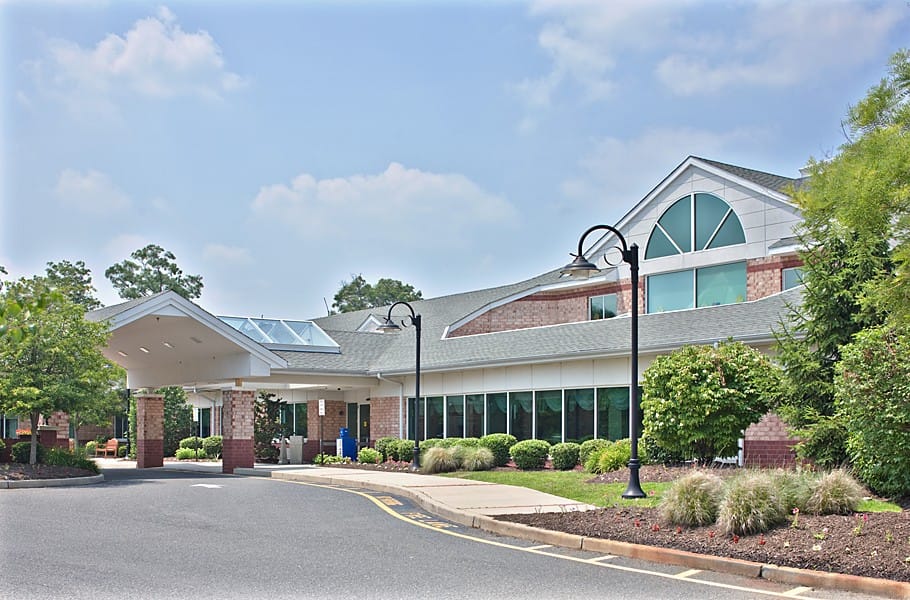
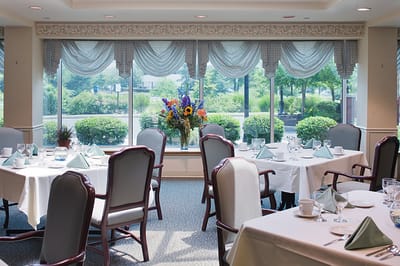
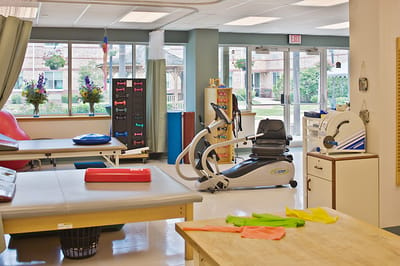
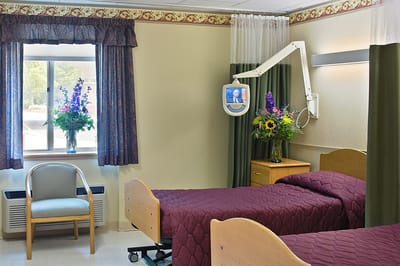
Jersey Shore Center is a nursing home in Eatontown, NJ, offering long-term care, memory care, respite care, rehabilitation, and skilled nursing. Here, older adults experience the utmost comfort and safety, especially with an accessible and clean setting. High-quality services, including restaurant-style dining, housekeeping, and round-the-clock support, are also provided to enrich residents’ living experiences. Dedicated to residents’ welfare, the community provides individualized care tailored to their unique needs and preferences.

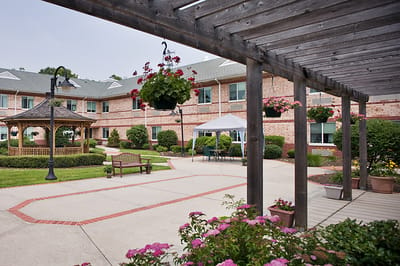
Fun events, educational programs, and cultural activities provide residents with more opportunities to learn and make friends. A fitness room, gardens, and courtyards also ensure residents can focus on their recovery and wellness. Residents also experience a stress-free retirement, with restaurants, shops, a bank, and public transportation nearby. This nursing home provides excellent services to help older adults thrive, making it one of the best options for senior living in New Jersey.

(732) 544-1557

Quality ratings

Measured by Centers for Medicare & Medicaid Services (CMS)

Overall rating Info The Overall CMS Rating combines results from health inspections, staffing levels and quality measures. Health inspections carry the most weight. Staffing and quality scores can increase or decrease the final rating based on performance compared to state and national standards.
▲ 22.7% Above NJ avg. ▲ 22.7% Above NJ avg.Click the badge to see the full State ranking.Click here to see the full State ranking.
Health Inspection Info Based on the results of the facility's three most recent standard inspections and any complaint investigations. CMS reviews the number, scope, and severity of deficiencies, with more recent findings weighted more heavily.
▲ 8.0% Above NJ avg. ▲ 8.0% Above NJ avg.Click the badge to see the full State ranking.Click here to see the full State ranking.
Staffing Info Measures average nursing staff hours per resident per day, including Registered Nurses (RNs) and total nursing staff. Ratings are adjusted based on the level of care residents require and are compared to state and national benchmarks.
▼ 34.4% Below NJ avg. ▼ 34.4% Below NJ avg.Click the badge to see the full State ranking.Click here to see the full State ranking.
Quality Measures Info Based on clinical and physical health indicators reported to CMS, such as hospital readmissions, falls, pressure ulcers, and improvements in mobility. These measures reflect how well residents' health needs are being managed.
▲ 16.1% Above NJ avg. ▲ 16.1% Above NJ avg.Click the badge to see the full State ranking.Click here to see the full State ranking.

Staffing hours breakdown

Info Daily nursing hours per resident by staff type, reported to CMS. Higher is generally better — compare this facility to state and national averages to see where staffing stands.

Hours per resident per day — compared to New Jersey state averages

Total nursing care / resident Info This home is ranked 244th out of 274 homes in New Jersey. Total adjusted nursing hours per resident per day, combining RN, LPN, and aide time. CMS adjusts this for case-mix so facilities can be fairly compared.
3h 6m per day
Rank #244 / 274Nurse hours — State benchmarkedThis home is ranked 244th out of 274 homes in New Jersey. Shows adjusted nurse hours per resident per day benchmarked to the New Jersey average, with a ranking across 274 New Jersey SNFs. More hours mean more direct care. The national average is about 3.5 hrs; below 3.0 is a red flag.Click the rank badge to see the full State ranking.Click here to see the full State ranking.
This facility New Jersey avg (3h 53m per day)
vs New Jersey avg
-20%
Staff typeHours / Day / Residentvs state avg
Weekend Total Nursing Info Combined nursing hours (RN + LPN + Nurse Aide) per resident per day on weekends. Staffing often drops on weekends — this figure reveals whether the facility maintains adequate coverage outside of weekday hours. 2h 53m per day

Types of Care at Jersey Shore Center

Nursing Home

Capacity and availability

This home usually has limited availability

Occupancy between 85% and 95% suggests balanced demand.

Higher occupancy than the New Jersey average: 77%
Occupancy rate 91% Rank #86 / 493Occupancy rate — State benchmarkedThis home is ranked 86th out of 493 homes in New Jersey. Shows this facility's occupancy rate versus the New Jersey average, with its Statewide rank out of 493. Higher occupancy signals strong local demand and financial stability.Click the rank badge to see the full State ranking.Click here to see the full State ranking.
Avg. Length of Stay 108 days
Occupancy rate
91% Rank #86 / 493Occupancy rate — State benchmarkedThis home is ranked 86th out of 493 homes in New Jersey. Shows this facility's occupancy rate versus the New Jersey average, with its Statewide rank out of 493. Higher occupancy signals strong local demand and financial stability.Click the rank badge to see the full State ranking.Click here to see the full State ranking.
Avg. Length of Stay
108 days
Walk Score
Walk Score: 85 / 100 Rank #62 / 640Walk Score — State benchmarkedThis home is ranked 62nd out of 640 homes in New Jersey. Shows how walkable this facility's neighborhood is compared to the average Walk Score across New Jersey SNFs. Higher scores benefit residents, families, and staff.Click the rank badge to see the full State ranking.Click here to see the full State ranking.
Very walkable. Most errands can be accomplished on foot, and many essentials are within a short walk.

Contact Jersey Shore Center

Staffing Data

Reporting period: October 1 – December 31, 2025 (Q4 2025). Source: CMS Payroll-Based Journal report.

Total staff 151
Employees 129
Contractors 22
Staff to resident ratio 1.24:1
31% worse than New Jersey average
New Jersey average ratio: 1.79:1 New Jersey average ratio: 1.79:1See full New Jersey ranking
Avg staff/day 60
Average shift 8 hours
0% compared with New Jersey average
New Jersey average: 8 hours New Jersey average shift: 8 hoursSee full New Jersey ranking
Total staff hours (quarter) 44,206

Nursing staff breakdown

Q4 2025 · Oct 1 – Dec 31 More info This data comes from the CMS Payroll-Based Journal report covering October 1 – December 31, 2025.
Registered Nurse

Manages medical care and health needs.

RN Staff 20
Average shift length Info Average shift length. Calculated as total hours divided by days worked and average staff per day. 7.7 hours

This role is partially covered by contractors.

Licensed Practical Nurse

Assists with medical care and medications.

LPN Staff 26
Average shift length Info Average shift length. Calculated as total hours divided by days worked and average staff per day. 8.6 hours

This role is partially covered by contractors.

Certified Nursing Assistant

Helps with daily care and mobility.

CNA Staff 53
Average shift length Info Average shift length. Calculated as total hours divided by days worked and average staff per day. 8.6 hours

This role is partially covered by contractors.

Contractor staffing

Q4 2025 · Oct 1 – Dec 31 More info This data comes from the CMS Payroll-Based Journal report covering October 1 – December 31, 2025.

Total hours from contractors

3.8%

1,687 contractor hours this quarter

Certified Nursing Assistant: 6 Licensed Practical Nurse: 5 Occupational Therapy Assistant: 5 Registered Nurse: 3 Occupational Therapy Aide: 1 Speech Language Pathologist: 1 Medical Director: 1

Staff by category

Q4 2025 · Oct 1 – Dec 31 More info This data comes from the CMS Payroll-Based Journal report covering October 1 – December 31, 2025.
Certified Nursing Assistant4765319,02592100%8.6
Licensed Practical Nurse215269,36392100%8.6
Registered Nurse173206,42892100%7.7
Other Dietary Services Staff9091,91892100%6.2
Physical Therapy Assistant6061,3688289%7.6
Clinical Nurse Specialist5059267278%6.4
Mental Health Service Worker2027926368%8
Speech Language Pathologist1127857480%7.4
Nurse Practitioner1015196470%8.1
RN Director of Nursing1014936672%7.5
Administrator1014806065%8
Qualified Social Worker4044666166%6.8
Nurse Aide in Training4044625054%7.4
Occupational Therapy Aide0114555762%8
Respiratory Therapy Technician6064476166%6.1
Physical Therapy Aide3031233033%4
Qualified Activities Professional1016489%7.9
Medical Director0114878%6.9
Occupational Therapy Assistant055453942%1.1
53 Certified Nursing Assistant
% of Days 100%
26 Licensed Practical Nurse
% of Days 100%
20 Registered Nurse
% of Days 100%
9 Other Dietary Services Staff
% of Days 100%
6 Physical Therapy Assistant
% of Days 89%
5 Clinical Nurse Specialist
% of Days 78%
2 Mental Health Service Worker
% of Days 68%
2 Speech Language Pathologist
% of Days 80%
1 Nurse Practitioner
% of Days 70%
1 RN Director of Nursing
% of Days 72%
1 Administrator
% of Days 65%
4 Qualified Social Worker
% of Days 66%
4 Nurse Aide in Training
% of Days 54%
1 Occupational Therapy Aide
% of Days 62%
6 Respiratory Therapy Technician
% of Days 66%
3 Physical Therapy Aide
% of Days 33%
1 Qualified Activities Professional
% of Days 9%
1 Medical Director
% of Days 8%
5 Occupational Therapy Assistant
% of Days 42%

Penalties and fines

Federal penalties imposed by CMS for regulatory violations, including civil money penalties (fines) and denials of payment for new Medicare/Medicaid admissions.

Source: CMS Penalties Database (Data as of Jan 2026)

Total fines amount $3K Rank #145 / 276Federal fines — State benchmarkedThis home is ranked 145th out of 276 homes in New Jersey. Shows this facility's cumulative CMS federal fine dollars versus the New Jersey average among facilities with fines, and where it ranks among 276 skilled nursing facilities in the pool. Lower total dollars mean a better rank.Click the rank badge to see the full State ranking.Click here to see the full State ranking.
96% lower than New Jersey average

New Jersey average: $77K

Number of fines 1
50% fewer fines than New Jersey average

New Jersey average: 2.0

Payment Denials Info Serious action where Medicare and/or Medicaid temporarily stops payments for new residents until issues are fixed. 0
100% fewer payment denials than New Jersey average

New Jersey average: 0.1

Fines amount comparison
This facility $3K
New Jersey average $77K

No penalties in the past 3 years

No civil money penalties or payment denials were reported in the last 3 years.

Quality of care over time

These measures show how residents usually do over time at this home, based on health outcomes and preventive care.

High-risk clinical events score Info A composite score based on pressure ulcers, falls with injury, weight loss, walking ability decline, and activities of daily living decline. 10.2
50% worse than New Jersey average

New Jersey average: 6.8

Functional decline score Info A composite score based on activities of daily living decline, walking ability decline, and incontinence. 20.9
68% worse than New Jersey average

New Jersey average: 12.4

Long-stay resident measures
Need for Help with Daily Activities Increased Info Percent of long-stay residents whose need for help with daily activities has increased 12.3%
22% worse than New Jersey average

New Jersey average: 10.1%

Walking Ability Worsened Info Percent of long-stay residents whose ability to move independently worsened 24.5%
123% worse than New Jersey average

New Jersey average: 11.0%

Low Risk Residents with Bowel/Bladder Incontinence Info Percent of low risk long-stay residents who lose control of their bowels or bladder 25.8%
62% worse than New Jersey average

New Jersey average: 16.0%

Falls with Major Injury Info Percent of long-stay residents experiencing one or more falls with major injury 3.8%
56% worse than New Jersey average

New Jersey average: 2.4%

High Risk Residents with Pressure Ulcers Info Percent of long-stay high risk residents with pressure ulcers 4.3%
29% better than New Jersey average

New Jersey average: 6.1%

Urinary Tract Infection Info Percent of long-stay residents with a urinary tract infection 1.0%
In line with New Jersey average

New Jersey average: 1.0%

Lost Too Much Weight Info Percent of long-stay residents who lose too much weight 6.0%
29% worse than New Jersey average

New Jersey average: 4.6%

Depressive Symptoms Info Percent of long-stay residents who have depressive symptoms 24.7%
119% worse than New Jersey average

New Jersey average: 11.3%

Antipsychotic Use Info Percent of long-stay residents who received an antipsychotic medication 8.2%
26% better than New Jersey average

New Jersey average: 11.1%

Pneumococcal Vaccine Info Percent of long-stay residents assessed and appropriately given the pneumococcal vaccine 96.7%
In line with New Jersey average

New Jersey average: 93.0%

Influenza Vaccine Info Percent of long-stay residents assessed and appropriately given the seasonal influenza vaccine 97.3%
In line with New Jersey average

New Jersey average: 97.2%

Short-stay resident measures
Pneumococcal Vaccine Info Percent of short-stay residents assessed and appropriately given the pneumococcal vaccine 94.8%
20% better than New Jersey average

New Jersey average: 78.9%

Antipsychotic medication increase Info Percent of short-stay residents who newly received an antipsychotic medication 1.4%
21% worse than New Jersey average

New Jersey average: 1.2%

Influenza Vaccine Info Percent of short-stay residents assessed and appropriately given the seasonal influenza vaccine 90.7%
13% better than New Jersey average

New Jersey average: 80.1%

Breakdown by payment type

Medicare

41% of new residents, usually for short-term rehab.

Typical stay 1 - 2 months

Private pay

55% of new residents, often for short stays.

Typical stay 1 - 2 months

Medicaid

4% of new residents, often for long-term daily care.

Typical stay 5 years

Facility Characteristics

Source: CMS Long-Term Care Facility Characteristics (Data as of Jan 2026)

Total residents 122
Medicare
15
12.3% of residents
Medicaid
88
72.1% of residents
Private pay or other
19
15.6% of residents
Programs & Services
Residents Group

Residents meet regularly to discuss policies, care quality, and activities

Active Resident Council

Organized group of residents that meets regularly to discuss facility policies, quality of life, and activities.

Finances and operations

Privately-owned community
Operated by a business corporation.
Home revenue
$31.2M
Profit
$544.2K
Privately-owned community Operated by a business corporation.
Home revenue
$31.2M Rank #32 / 272Revenue — State benchmarkedThis home is ranked 32nd out of 272 homes in New Jersey. Shows this facility's annual revenue compared to the New Jersey SNF average. Higher revenue generally means more resources for staffing and capital — read alongside Payroll %.Click the rank badge to see the full State ranking.Click here to see the full State ranking.
Profit
$544.2K
Payroll costs Info The portion of the home's budget spent on staff, including nurses, caregivers, and other employees who support care and operations. Rank #67 / 272Payroll — State benchmarkedThis home is ranked 67th out of 272 homes in New Jersey. Shows total annual staff payroll benchmarked to the New Jersey average. Higher payroll investment relative to peers often signals better staffing and less reliance on cheaper contract labor.Click the rank badge to see the full State ranking.Click here to see the full State ranking.
$12.0M
38.5% of revenue Rank #252 / 272Payroll % — State benchmarkedThis home is ranked 252nd out of 272 homes in New Jersey. Shows payroll as a percentage of revenue versus the New Jersey average. Well-run New Jersey SNFs typically land around 55–65% — the top third Statewide. Below 25% may signal understaffing or heavy agency use — read with Staffing ratings.Click the rank badge to see the full State ranking.Click here to see the full State ranking.
Other operating costs Info All remaining costs needed to run the home, such as food, utilities, building maintenance, supplies and administrative expenses.
$18.6M
Total costs $30.7M

What does this home offer?

Pets allowed icon
Pets allowed icon

Pets Allowed

Housing options icon

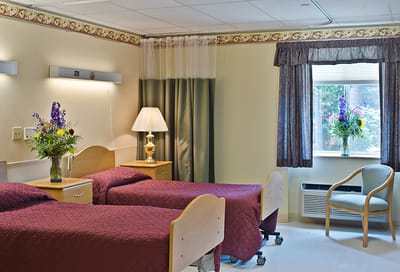
Housing Options: Private / Semi-Private Rooms

Building type icon
Building type icon

Building Type: Single-story

Dining services icon

Dining Services

Beauty services icon

Beauty Services

Housekeeping icon
Housekeeping icon

Housekeeping Services

Social and recreational activities icon

Social and Recreational Activities

Rehabilitative support icon

Rehabilitative Support

Medication Management icon

Medication Management

On-site medical care and health services icon

On-site Medical Care and Health Services

Who this home usually serves

TYPE OF STAY

Mix of rehab and long-term care

This home supports both short-term rehab and long-term care, with residents staying for a wide range of durations.

Places of interest near Jersey Shore Center

Address 1.3 miles from city center Info Estimated distance in miles from Eatontown's city center to Jersey Shore Center's address, calculated via Google Maps.

Calculate Travel Distance to Jersey Shore Center

Add your location

Address

Financial Assistance for
Nursing Home in New Jersey

Jersey Shore Center is located in Eatontown, New Jersey.
Here are the financial assistance programs available to residents in New Jersey.

Get Financial aid guidance

Managed Long Term Services and Supports

NJ Medicaid MLTSS

Age 65+ or disabled
General New Jersey resident, Medicaid- eligible, nursing home-level care need.
Income Limits (2025) ~$2,829/month 300% FBR, individual
Asset Limits $2,000 (individual), $3,000 (couple).
NJ

High urban demand; managed care model.

Benefits
In-home care (5-7 hours/day) Assisted living Respite (240 hours/year) Medical services

JACC (Jersey Assistance for Community Caregiving)

NJ JACC

Age 60+
General New Jersey resident, at risk of nursing home.
Income Limits ~$2,500/month individual, varies
Asset Limits $40,000 individual
NJ

Higher asset limit; limited funding.

Benefits
In-home care (3-5 hours/week) Respite (up to 10 days/year) Home modifications (~$1,000 avg.)

Pharmaceutical Assistance to the Aged and Disabled (PAAD)

New Jersey PAAD

Age 65+
General NJ resident, enrolled in Medicare Part D or eligible.
Income Limits (2025) ~$42,142/year (individual), ~$49,209/year (couple).
Asset Limits Not assessed.
NJ

Copays $5 (generic), $7 (brand); covers Part D premiums up to benchmark.

Benefits
Prescription cost reduction ($500-$1,000/year savings) Premium assistance ($20/month above benchmark)

Senior Gold Prescription Discount Program

New Jersey Senior Gold

Age 65+
General NJ resident, enrolled in Medicare Part D or eligible.
Income Limits (2025) ~$42,142-$52,142/year (individual), ~$49,209-$59,209/year (couple).
Asset Limits Not assessed.
NJ

Copays $15 + 50% of remaining cost; no premium assistance.

Benefits
Prescription cost reduction (~$300-$800/year savings)

Medicare Savings Program (MSP)

New Jersey Medicare Savings Program

Age 65+ or disabled
General NJ resident, Medicare Part A/B.
Income Limits (2025) ~$2,510/month (QMB), ~$3,380/month (SLMB), ~$3,598/month (QI)—individual.
Asset Limits $9,430 (individual), $14,130 (couple).
NJ

Three tiers; no waitlist; includes Extra Help for Part D.

Benefits
Covers Part B premiums ($174.70/month) Deductibles ($240/year) Copays (~20%)

Senior Freeze (Property Tax Reimbursement)

New Jersey Senior Freeze

Age 65+ by Dec 31 prior year
General NJ resident, homeowner, paid property taxes.
Income Limits (2025) ~$150,000/year combined household, projected
Asset Limits Not assessed; home ownership required.
NJ

Combines with ANCHOR/Stay NJ via PAS-1; annual application.

Benefits
Tax reimbursement (~$500-$2,000/year) for increases since base year

ANCHOR (Affordable NJ Communities for Homeowners and Renters)

New Jersey ANCHOR

Age 65+ prioritized
General NJ resident, homeowner/renter, paid property taxes/rent.
Income Limits (2025) ~$150,000/year (homeowners), ~$75,000/year (renters).
Asset Limits Not assessed.
NJ

Combines with Senior Freeze/Stay NJ; broader than prior Homestead program.

Benefits
Tax relief (~$700-$1,500/year homeowners, ~$250-$450 renters)

Stay NJ

New Jersey Stay NJ

Age 65+ by Dec 31 prior year
General NJ resident, homeowner, lived in home 10+ years.
Income Limits (2025) ~$500,000/year projected, subject to final regs
Asset Limits Not assessed; home ownership required.
NJ

Up to 50% tax credit (max $6,500); phased implementation.

Benefits
Tax credit (~$3,000-$6,500/year, projected) starting 2026

Universal Service Fund (USF)

New Jersey Universal Service Fund

Age 65+ prioritized
General NJ resident, utility customer, low-income.
Income Limits (2025) ~$3,970/month individual, 185% FPL
Asset Limits Not assessed; income-focused.
NJ

Must owe >$25 on bill; combines with LIHEAP if eligible.

Benefits
Bill credits (~$300-$1,500/year) to cap energy costs at 6% of income

NJ Family Caregiver Support Program (via NFCSP)

New Jersey Family Caregiver Support Program

Age
General Caregivers of 60+ needing care or 55+ caregivers of others; NJ resident; functional needs (2+ ADLs).
Income Limits (2025) Prioritizes ~$24,980/year (individual); no strict cap.
Asset Limits Not assessed; need-based.
NJ

21 AAAs; rural/low-income priority.

Benefits
Respite (4-6 hours/week or 5 days/year) Adult day care ($60/day) Training Supplies (~$500/year)

VA Aid and Attendance (A&A) and Housebound Benefits

New Jersey VA Aid and Attendance/Housebound

Age 65+ or disabled veteran/spouse
General NJ resident, wartime service, need for ADL help (A&A) or homebound.
Income Limits (2025) Net income < ~$1,984/month (veteran with dependent, A&A); pension offsets income.
Asset Limits ~$155,356 net worth limit
NJ

High veteran demand in urban/rural areas.

Benefits
Cash (~$1,433-$2,642/month veteran, ~$951-$1,318 spouse) for care costs (e.g., in-home, assisted living)

Frequently Asked Questions about Jersey Shore Center

What neighborhood is Jersey Shore Center in?

Jersey Shore Center is in the Old Town neighborhood.

Is Jersey Shore Center in a walkable area?

Jersey Shore Center has a walk score of 85. Very walkable. Most errands can be accomplished on foot, and many essentials are within a short walk.

What is the occupancy rate at Jersey Shore Center?

Jersey Shore Center's occupancy is 91.0%.

What is the address of Jersey Shore Center?

Jersey Shore Center is located at 3 Industrial Wy E, Eatontown, NJ 07724.

What is the phone number of Jersey Shore Center?

(732) 544-1557 will put you in contact with the team at Jersey Shore Center.

Is Jersey Shore Center Medicare or Medicaid certified?

Yes — Jersey Shore Center is a CMS-certified provider of Medicare and Medicaid.

Guides for Better Senior Living

Care Cost Calculator: See Prices in Your Area

Nursing Home Data Explorer

Don’t Wait Too Long: 7 Red Flag Signs Your Parent Needs Assisted Living Now

The True Cost of Assisted Living in 2025 – And How Families Are Paying For It

Understanding Senior Living Costs: Pricing Models, Discounts & Financial Assistance

Explore Open Rooms
1 Contact details
2 What type of senior care service are you looking for?
3 What budget do you have in mind for senior care?
4 How soon do you need to find care?
5 Additional details

Thank you for your interest!

Our team will be in touch shortly to help with next steps.