Kalākaua Gardens
Nursing Home, Assisted Living, Independent Living & Memory Care · Honolulu, HI
CMS overall rating Info The Overall CMS Rating is scored from 1 to 5 stars and combines results from health inspections, staffing levels, and quality measures. Health inspections carry the most weight. Staffing and quality scores can increase or decrease the final rating based on performance compared to state and national standards.

Kalākaua Gardens

Nursing Home, Assisted Living, Independent Living & Memory Care · Honolulu, HI
CMS overall rating Info The Overall CMS Rating is scored from 1 to 5 stars and combines results from health inspections, staffing levels, and quality measures. Health inspections carry the most weight. Staffing and quality scores can increase or decrease the final rating based on performance compared to state and national standards.
Calculator: See prices in your area
Kalākaua Gardens accepts Medicare, Medicaid, and private pay.

Overview of Kalākaua Gardens

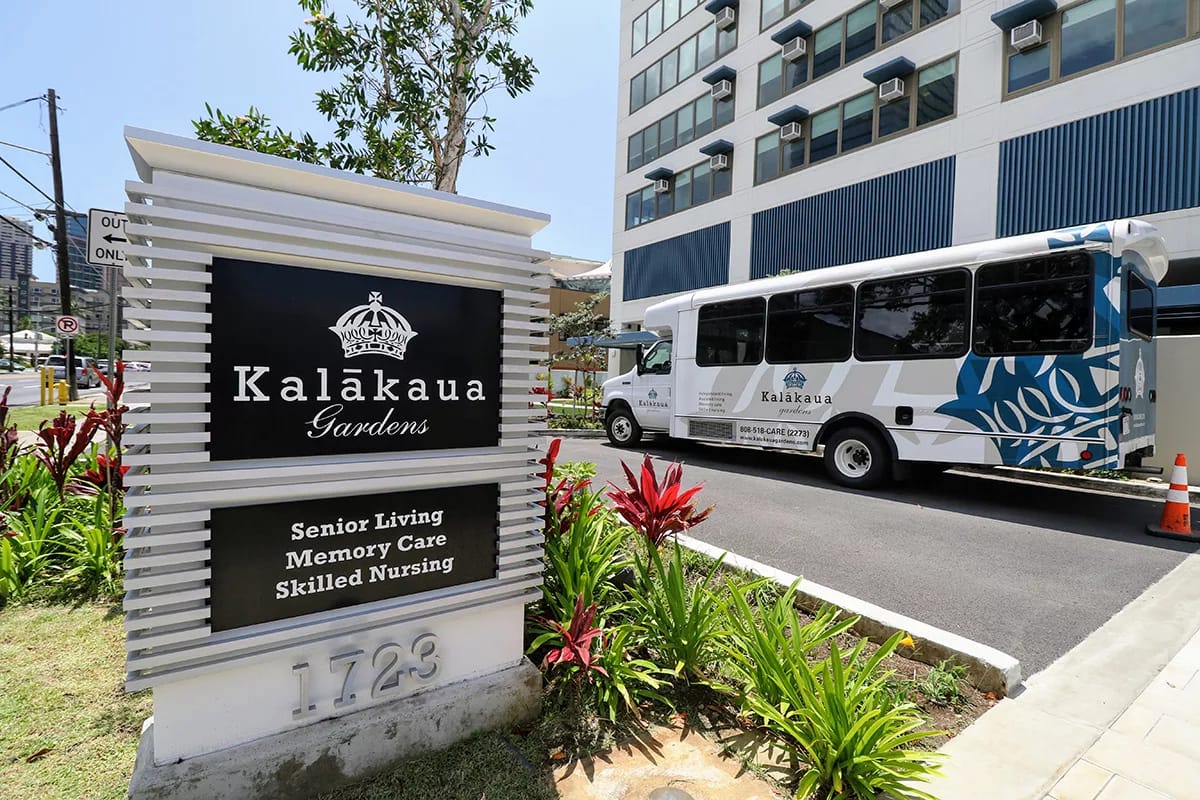
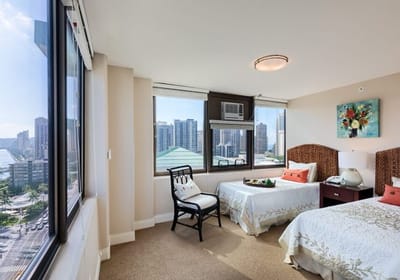
Kalākaua Gardens, located in Honolulu, HI, is a senior living community primarily offering independent living, assisted living, memory care, and skilled nursing services. Their independent living option provides residents with studio-style and one bedroom accommodations featuring emergency alert systems, and personalized climate control. All utilities are also already covered except for telephone, and in room wifi and cable services are also available.

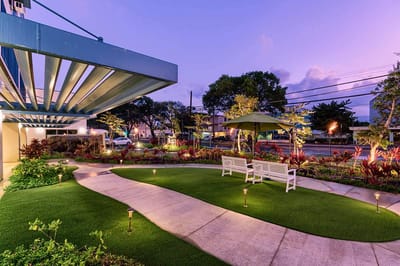
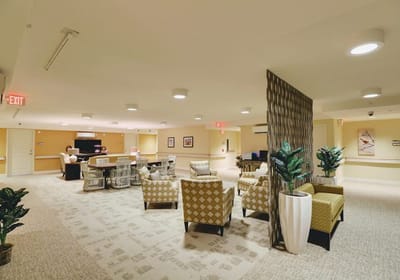
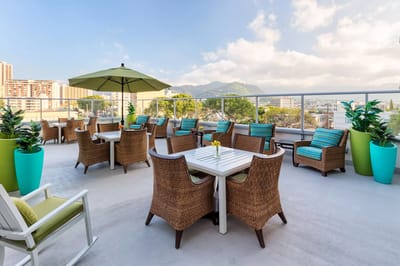
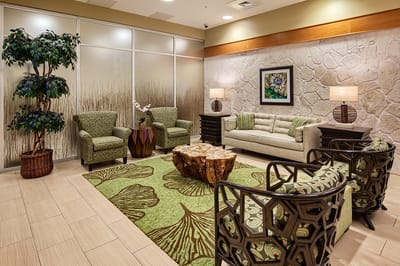
This senior living community’s amenities provides residents with so many things to enjoy; from their chef-prepared meals in a restaurant style dining room, to their housekeeping services, and scheduled transportation. Additionally, the residents may also participate in fitness classes as well as social and cultural outings, providing opportunities to create new relationships in their retirement years, as well as memories to look back on.

(808) 518-2273

Quality ratings

Measured by Centers for Medicare & Medicaid Services (CMS)

Overall rating Info The Overall CMS Rating combines results from health inspections, staffing levels and quality measures. Health inspections carry the most weight. Staffing and quality scores can increase or decrease the final rating based on performance compared to state and national standards.
▼ 40.5% Below HI avg. ▼ 40.5% Below HI avg.Click the badge to see the full State ranking.Click here to see the full State ranking.
Health Inspection Info Based on the results of the facility's three most recent standard inspections and any complaint investigations. CMS reviews the number, scope, and severity of deficiencies, with more recent findings weighted more heavily.
▲ 10.7% Above HI avg. ▲ 10.7% Above HI avg.Click the badge to see the full State ranking.Click here to see the full State ranking.
Staffing Info Measures average nursing staff hours per resident per day, including Registered Nurses (RNs) and total nursing staff. Ratings are adjusted based on the level of care residents require and are compared to state and national benchmarks.
▼ 74.1% Below HI avg. ▼ 74.1% Below HI avg.Click the badge to see the full State ranking.Click here to see the full State ranking.
Quality Measures Info Based on clinical and physical health indicators reported to CMS, such as hospital readmissions, falls, pressure ulcers, and improvements in mobility. These measures reflect how well residents' health needs are being managed.
▼ 28.7% Below HI avg. ▼ 28.7% Below HI avg.Click the badge to see the full State ranking.Click here to see the full State ranking.

Staffing hours breakdown

Info Daily nursing hours per resident by staff type, reported to CMS. Higher is generally better — compare this facility to state and national averages to see where staffing stands.

Hours per resident per day — compared to Hawaii state averages

Total nursing care / resident Info This home is ranked 32nd out of 32 homes in Hawaii. Total adjusted nursing hours per resident per day, combining RN, LPN, and aide time. CMS adjusts this for case-mix so facilities can be fairly compared.
22m per day
Rank #32 / 32Nurse hours — State benchmarkedThis home is ranked 32nd out of 32 homes in Hawaii. Shows adjusted nurse hours per resident per day benchmarked to the Hawaii average, with a ranking across 32 Hawaii SNFs. More hours mean more direct care. The national average is about 3.5 hrs; below 3.0 is a red flag.Click the rank badge to see the full State ranking.Click here to see the full State ranking.
This facility Hawaii avg (4h 13m per day)
vs Hawaii avg
-91%
Staff typeHours / Day / Residentvs state avg
Weekend Total Nursing Info Combined nursing hours (RN + LPN + Nurse Aide) per resident per day on weekends. Staffing often drops on weekends — this figure reveals whether the facility maintains adequate coverage outside of weekday hours. 27m per day

Types of Care at Kalākaua Gardens

Assisted Living Independent Living Memory Care Nursing Home

Capacity and availability

This home usually has availability

Occupancy lower than 85% suggests more openings may be available.

Lower occupancy than the Hawaii average: 74.2%
Occupancy rate 71.4% Rank #17 / 27Occupancy rate — State benchmarkedThis home is ranked 17th out of 27 homes in Hawaii. Shows this facility's occupancy rate versus the Hawaii average, with its Statewide rank out of 27. Higher occupancy signals strong local demand and financial stability.Click the rank badge to see the full State ranking.Click here to see the full State ranking.
Avg. Length of Stay 54 days
Occupancy rate
71.4% Rank #17 / 27Occupancy rate — State benchmarkedThis home is ranked 17th out of 27 homes in Hawaii. Shows this facility's occupancy rate versus the Hawaii average, with its Statewide rank out of 27. Higher occupancy signals strong local demand and financial stability.Click the rank badge to see the full State ranking.Click here to see the full State ranking.
Avg. Length of Stay
54 days
Walk Score
Walk Score: 98 / 100 Rank #3 / 178Walk Score — State benchmarkedThis home is ranked 3rd out of 178 homes in Hawaii. Shows how walkable this facility's neighborhood is compared to the average Walk Score across Hawaii SNFs. Higher scores benefit residents, families, and staff.Click the rank badge to see the full State ranking.Click here to see the full State ranking.
Walker's paradise. Daily errands do not require a car, with many shops and services nearby.

About this community

License Details

Facility TypeAssisted Living Facility
StatusActive
ExpirationSeptember 30, 2026
License Number21-ALF
IslandOahu

Contact Kalākaua Gardens

Inspection History

In Hawaii, the Department of Health, Office of Health Care Assurance performs regular inspections and unannounced surveys to verify that healthcare facilities maintain high standards of resident care.

Since 2022 · 4 years of data 25 deficiencies

Inspection Scorecard Info This scorecard compares key inspection, citation, and complaint metrics at this facility against the Hawaii state average. Metrics rated ≥15% worse than average are highlighted in red; those ≥15% better are highlighted in green.

Since 2022 vs. Hawaii state average
Overall vs. HI average 0 Worse No metrics in this bucket. 2 At Avg Metrics at Hawaii average:
• Total deficiencies (at HI avg)
• Deficiencies per year (at HI avg)
0 Better No metrics in this bucket.
Latest Inspection June 25, 2025 Annual Inspection

Deficiencies Info Deficiencies are formal regulatory issues recorded during state inspections.

This FacilityHI Averagevs. HI Avg
Total deficiencies Info Formal regulatory issues recorded by inspectors across all inspection types. 2525 This facility has total deficiencies in line with the Hawaii average (25 vs. HI avg 25).— At avg
Deficiencies per year Info Average deficiencies per year since 2022. 6.36.3 This facility has deficiencies per year in line with the Hawaii average (6.3 vs. HI avg 6.3).— At avg

Inspection Reports Summary Info An editor-reviewed summary of the themes and findings across this facility's recent inspection reports.

The most recent inspection on June 25, 2025, identified deficiencies related to service plans, medication administration, health monitoring, and medication review. Earlier inspections also noted issues with service plan updates, medication delegation and documentation, staff training, and nursing assessments. Common themes across reports included incomplete or delayed service plans, unclear medication orders or administration by unlicensed personnel without proper delegation, and insufficient health monitoring during treatment. Complaint investigations were not listed in the available reports. The pattern of deficiencies has remained consistent over time, with no clear indication of improvement or worsening.

Read the full inspection reports for this facility, including detailed findings and corrective actions.

Show Inspection Reports

Health Inspection History

Inspections since 2022
Total health inspections 6

Hawaii average 4.4


Last Health inspection on Jan 2025

Total health citations
35 Rank #17 / 33Health citations — State benchmarkedThis home is ranked 17th out of 33 homes in Hawaii. Shows this facility's total health deficiency citations benchmarked to the Hawaii State average, with a ranking across all 33 HI SNFs. Lower citation counts earn a better rank.Click the rank badge to see the full State ranking.Click here to see the full State ranking.

Hawaii average 35.5

Citations per inspection
5.83 Rank #10 / 33Citations per inspection — State benchmarkedThis home is ranked 10th out of 33 homes in Hawaii. Shows average deficiency citations per CMS inspection for this facility versus the Hawaii mean across 33 SNFs with citation data. Lower is better.Click the rank badge to see the full State ranking.Click here to see the full State ranking.

Hawaii average 8.23


Health citations are formal notices following inspections when they fail to comply with safety and care standards.

24 of 35 citations resulted from standard inspections; and 10 of 35 resulted from complaint investigations.

Breakdown of citation severity (last 4 years)
Critical Health citations
0
100% better than Hawaii average

Hawaii average: 0.1


Serious Health citations
3 Rank #15 / 19Serious citations (G–I) — State benchmarkedThis home is ranked 15th out of 19 homes in Hawaii. Shows G–I scope serious health citations for this facility versus other Hawaii SNFs. Lower counts rank better.Click the rank badge to see the full State ranking.Click here to see the full State ranking.
200% worse than Hawaii average

Hawaii average: 1

0 critical citations Hawaii average: 0.1

3 serious citations Hawaii average: 1

32 moderate citations Hawaii average: 34.2

0 minor citations Hawaii average: 0.1
Citations history (last 4 years)
Nutrition moderate citation Jan 17, 2025
Corrected

Pharmacy moderate citation Jan 17, 2025
Corrected

Pharmacy moderate citation Jan 17, 2025
Corrected

Quality of Care serious citation Jan 17, 2025
Corrected

Staffing Data

Reporting period: October 1 – December 31, 2025 (Q4 2025). Source: CMS Payroll-Based Journal report.

Total staff 90
Employees 57
Contractors 33
Staff to resident ratio 1.91:1
16% better than Hawaii average
Hawaii average ratio: 1.65:1 Hawaii average ratio: 1.65:1See full Hawaii ranking
Avg staff/day 32
Average shift 8.1 hours
0% compared with Hawaii average
Hawaii average: 7.8 hours Hawaii average shift: 7.8 hoursSee full Hawaii ranking
Total staff hours (quarter) 23,741

Nursing staff breakdown

Q4 2025 · Oct 1 – Dec 31 More info This data comes from the CMS Payroll-Based Journal report covering October 1 – December 31, 2025.
Registered Nurse

Manages medical care and health needs.

RN Staff 18
Average shift length Info Average shift length. Calculated as total hours divided by days worked and average staff per day. 9.7 hours

This role is partially covered by contractors.

Licensed Practical Nurse

Assists with medical care and medications.

LPN Staff 4
Average shift length Info Average shift length. Calculated as total hours divided by days worked and average staff per day. 8.5 hours

This role is partially covered by contractors.

Certified Nursing Assistant

Helps with daily care and mobility.

CNA Staff 33
Average shift length Info Average shift length. Calculated as total hours divided by days worked and average staff per day. 8.3 hours

This role is partially covered by contractors.

Contractor staffing

Q4 2025 · Oct 1 – Dec 31 More info This data comes from the CMS Payroll-Based Journal report covering October 1 – December 31, 2025.

Total hours from contractors

13%

3,096 contractor hours this quarter

Speech Language Pathologist: 8 Physical Therapy Aide: 6 Respiratory Therapy Technician: 6 Physical Therapy Assistant: 5 Qualified Social Worker: 3 Certified Nursing Assistant: 1 Registered Nurse: 1 Licensed Practical Nurse: 1 Occupational Therapy Aide: 1 Medical Director: 1

Staff by category

Q4 2025 · Oct 1 – Dec 31 More info This data comes from the CMS Payroll-Based Journal report covering October 1 – December 31, 2025.
Certified Nursing Assistant3213310,97292100%8.3
Registered Nurse171186,46392100%9.7
Licensed Practical Nurse3141,1988491%8.5
Speech Language Pathologist0888847784%6.5
Physical Therapy Assistant0555927683%6.4
Dietitian1015106470%8
Physical Therapy Aide0664755762%7
Administrator1014565762%8
Mental Health Service Worker1014565762%8
Respiratory Therapy Technician0664496874%5.4
Nurse Practitioner1014485661%8
Clinical Nurse Specialist1014005054%8
Qualified Social Worker0332714246%6.3
Occupational Therapy Aide0111233740%3.3
Medical Director011453942%1.2
33 Certified Nursing Assistant
% of Days 100%
18 Registered Nurse
% of Days 100%
4 Licensed Practical Nurse
% of Days 91%
8 Speech Language Pathologist
% of Days 84%
5 Physical Therapy Assistant
% of Days 83%
1 Dietitian
% of Days 70%
6 Physical Therapy Aide
% of Days 62%
1 Administrator
% of Days 62%
1 Mental Health Service Worker
% of Days 62%
6 Respiratory Therapy Technician
% of Days 74%
1 Nurse Practitioner
% of Days 61%
1 Clinical Nurse Specialist
% of Days 54%
3 Qualified Social Worker
% of Days 46%
1 Occupational Therapy Aide
% of Days 40%
1 Medical Director
% of Days 42%

Penalties and fines

Includes penalties issued in 2025

Federal penalties imposed by CMS for regulatory violations, including civil money penalties (fines) and denials of payment for new Medicare/Medicaid admissions.

Source: CMS Penalties Database (Data as of Jan 2026)

Total fines amount $61K Rank #28 / 33Federal fines — State benchmarkedThis home is ranked 28th out of 33 homes in Hawaii. Shows this facility's cumulative CMS federal fine dollars versus the Hawaii average among facilities with fines, and where it ranks among 33 skilled nursing facilities in the pool. Lower total dollars mean a better rank.Click the rank badge to see the full State ranking.Click here to see the full State ranking.
60% higher than Hawaii average

Hawaii average: $38K

Number of fines 3
97% more fines than Hawaii average

Hawaii average: 1.5

Payment Denials Info Serious action where Medicare and/or Medicaid temporarily stops payments for new residents until issues are fixed. 0
100% fewer payment denials than Hawaii average

Hawaii average: 0.1

Fines amount comparison
This facility $61K
Hawaii average $38K
Penalty History

Penalties are imposed by CMS for violations of federal nursing home regulations.

1 penalty in the past 3 years

Jan 17, 2025 · $56K

Civil Money Penalty Info Fines imposed for noncompliance, which can be assessed per day or per instance of violation. Jan 17, 2025
$56K

Last updated: Jan 2026

Quality of care over time

These measures show how residents usually do over time at this home, based on health outcomes and preventive care.

High-risk clinical events score Info A composite score based on pressure ulcers, falls with injury, weight loss, walking ability decline, and activities of daily living decline. 13.6
34% worse than Hawaii average

Hawaii average: 10.2

Functional decline score Info A composite score based on activities of daily living decline, walking ability decline, and incontinence. 34.2
71% worse than Hawaii average

Hawaii average: 20.0

Long-stay resident measures
Need for Help with Daily Activities Increased Info Percent of long-stay residents whose need for help with daily activities has increased 37.7%
114% worse than Hawaii average

Hawaii average: 17.6%

Low Risk Residents with Bowel/Bladder Incontinence Info Percent of low risk long-stay residents who lose control of their bowels or bladder 30.7%
67% worse than Hawaii average

Hawaii average: 18.3%

Falls with Major Injury Info Percent of long-stay residents experiencing one or more falls with major injury 6.1%
188% worse than Hawaii average

Hawaii average: 2.1%

High Risk Residents with Pressure Ulcers Info Percent of long-stay high risk residents with pressure ulcers 6.5%
78% worse than Hawaii average

Hawaii average: 3.6%

Urinary Tract Infection Info Percent of long-stay residents with a urinary tract infection 3.5%
47% worse than Hawaii average

Hawaii average: 2.4%

Lost Too Much Weight Info Percent of long-stay residents who lose too much weight 4.3%
10% better than Hawaii average

Hawaii average: 4.7%

Depressive Symptoms Info Percent of long-stay residents who have depressive symptoms 4.9%
234% worse than Hawaii average

Hawaii average: 1.5%

Antipsychotic Use Info Percent of long-stay residents who received an antipsychotic medication 5.5%
46% better than Hawaii average

Hawaii average: 10.1%

Pneumococcal Vaccine Info Percent of long-stay residents assessed and appropriately given the pneumococcal vaccine 61.4%
36% worse than Hawaii average

Hawaii average: 96.3%

Influenza Vaccine Info Percent of long-stay residents assessed and appropriately given the seasonal influenza vaccine 84.9%
11% worse than Hawaii average

Hawaii average: 95.4%

Short-stay resident measures
Pneumococcal Vaccine Info Percent of short-stay residents assessed and appropriately given the pneumococcal vaccine 67.8%
19% worse than Hawaii average

Hawaii average: 83.4%

Antipsychotic medication increase Info Percent of short-stay residents who newly received an antipsychotic medication 1.5%
29% worse than Hawaii average

Hawaii average: 1.2%

Influenza Vaccine Info Percent of short-stay residents assessed and appropriately given the seasonal influenza vaccine 73.5%
13% worse than Hawaii average

Hawaii average: 84.7%

Breakdown by payment type

Medicare

49% of new residents, usually for short-term rehab.

Typical stay 25 days

Private pay

22% of new residents, often for short stays.

Typical stay 2 - 3 years

Medicaid

28% of new residents, often for long-term daily care.

Typical stay 7 days

Facility Characteristics

Source: CMS Long-Term Care Facility Characteristics (Data as of Jan 2026)

Total residents 47
Medicare
17
36.2% of residents
Medicaid
3
6.4% of residents
Private pay or other
27
57.4% of residents
Programs & Services
Residents Group

Residents meet regularly to discuss policies, care quality, and activities

Active Resident Council

Organized group of residents that meets regularly to discuss facility policies, quality of life, and activities.

Finances and operations

Privately-owned community
Operated by a business corporation.
Home revenue
$24.6M
Operating loss
-$1.3M
Privately-owned community Operated by a business corporation.
Home revenue
$24.6M Rank #10 / 28Revenue — State benchmarkedThis home is ranked 10th out of 28 homes in Hawaii. Shows this facility's annual revenue compared to the Hawaii SNF average. Higher revenue generally means more resources for staffing and capital — read alongside Payroll %.Click the rank badge to see the full State ranking.Click here to see the full State ranking.
Operating loss
-$1.3M
Payroll costs Info The portion of the home's budget spent on staff, including nurses, caregivers, and other employees who support care and operations. Rank #8 / 28Payroll — State benchmarkedThis home is ranked 8th out of 28 homes in Hawaii. Shows total annual staff payroll benchmarked to the Hawaii average. Higher payroll investment relative to peers often signals better staffing and less reliance on cheaper contract labor.Click the rank badge to see the full State ranking.Click here to see the full State ranking.
$10.6M
43.1% of revenue Rank #15 / 28Payroll % — State benchmarkedThis home is ranked 15th out of 28 homes in Hawaii. Shows payroll as a percentage of revenue versus the Hawaii average. Well-run Hawaii SNFs typically land around 52–61% — the top third Statewide. Below 25% may signal understaffing or heavy agency use — read with Staffing ratings.Click the rank badge to see the full State ranking.Click here to see the full State ranking.
Other operating costs Info All remaining costs needed to run the home, such as food, utilities, building maintenance, supplies and administrative expenses.
$15.3M
Total costs $25.9M

What does this home offer?

Housing options icon

Housing Options: Private Suites

Building type icon
Building type icon

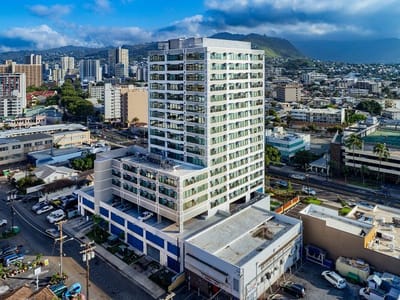
Building Type: High-rise

Dining services icon

Dining Services

Transportation services icon

Transportation Services

Social and recreational activities icon

Social and Recreational Activities

Parking Available icon

Parking Available

Security systems icon

Security Systems

On-site medical care and health services icon

On-site Medical Care and Health Services

Who this home usually serves

TYPE OF STAY

Mostly short-term rehab stays

Most residents typically stay for a few weeks or months before returning home or moving on.

Places of interest near Kalākaua Gardens

Address 2.6 miles from city center Info Estimated distance in miles from Honolulu's city center to Kalākaua Gardens's address, calculated via Google Maps. — 0.62 miles to nearest hospital (Kapiu02bbolani Medical Center for Women & Children)

Calculate Travel Distance to Kalākaua Gardens

Add your location

Address

Financial Assistance for
Nursing Home in Hawaii

Kalākaua Gardens is located in Honolulu, Hawaii.
Here are the financial assistance programs available to residents in Hawaii.

Get Financial aid guidance

QUEST Integration

Hawaii Medicaid QUEST Integration

Age 65+ or disabled
General Hawaii resident, Medicaid-eligible, long-term care need.
Income Limits (2025) ~$2,829/month 300% FBR, individual
Asset Limits $2,000 (individual), $3,000 (couple).
HI

High cost of living adjustments.

Benefits
In-home care (6-8 hours/day) Nursing home Respite (240 hours/year) Medical services

Kupuna Care

Hawaii Kupuna Care

Age 60+
General Hawaii resident, unable to perform 2+ ADLs.
Income Limits No strict limit; prioritizes low-income.
Asset Limits Not applicable.
HI

Limited funding; island-specific delivery.

Benefits
In-home care (3-5 hours/week) Adult day care (~$70/day) Transportation (~5 trips/month)

Program of All-Inclusive Care for the Elderly (PACE)

Hawaii Medicaid PACE

Age 55+
General Hawaii resident, nursing home-level care need, safe with PACE support.
Income Limits (2025) ~$2,829/month 300% FBR
Asset Limits $2,000 (individual), $3,000 (couple).
HI

Limited to Oahu (e.g., Maluhia in Honolulu); few providers.

Benefits
Personal care (5-7 hours/day) Medical care Meals Transportation Therapy Respite

Medicare Savings Program (MSP)

Hawaii Medicare Savings Program

Age 65+ or disabled
General Hawaii resident, Medicare Part A/B.
Income Limits (2025) ~$2,510/month (QMB), ~$3,380/month (SLMB), ~$3,598/month (QI)—individual, adjusted annually.
Asset Limits $9,430 (individual), $14,130 (couple).
HI

Three tiers; no waitlist.

Benefits
Covers Part B premiums ($174.70/month) Deductibles ($240/year) Copays (~20%)

National Family Caregiver Support Program (NFCSP) Respite

Hawaii NFCSP Respite Care

Age
General Caregivers of 60+ needing care or 55+ caregivers of others; Hawaii resident; functional needs (2+ ADLs).
Income Limits (2025) Prioritizes ~$24,980/year (individual); no strict cap.
Asset Limits Not assessed; need-based.
HI

Four county AAAs; prioritizes low-income.

Benefits
Respite (4-6 hours/week or 5 days/year) Adult day care ($80/day) Counseling

VA Aid and Attendance (A&A) and Housebound Benefits

Hawaii VA Aid and Attendance/Housebound

Age 65+ or disabled veteran/surviving spouse
General Hawaii resident, wartime service, need for aid with ADLs (A&A) or homebound status.
Income Limits (2025) Net income < ~$1,984/month (veteran with dependent, A&A); pension offsets income.
Asset Limits ~$155,356 2025 net worth limit
HI

Applies statewide; high demand due to veteran population.

Benefits
Cash (~$1,433-$2,642/month veteran, ~$951-$1,318 spouse) for care costs (e.g., in-home, assisted living)

Senior Companion Program (SCP)

Hawaii Senior Companion Program

Age
General Volunteers: 55+, low-income, Hawaii resident, able to work 20 hours/week. Recipients: Frail elders needing companionship.
Income Limits (2025) Volunteers: ~$24,980/year (200% FPL); recipients: no limit.
Asset Limits Not specified for volunteers; need-based for recipients.
HI

Statewide; managed by DHS Social Services.

Benefits
Volunteers paid ~$4/hour for companionship (~20 hours/week); recipients get free support (~4-6 hours/week)

Frequently Asked Questions about Kalākaua Gardens

What neighborhood is Kalākaua Gardens in?

Kalākaua Gardens is in the Ala Moana neighborhood of Honolulu.

Is Kalākaua Gardens in a walkable area?

Kalākaua Gardens has a walk score of 98. Walker's paradise. Daily errands do not require a car, with many shops and services nearby.

What is the license number of Kalākaua Gardens?

According to HI state health department records, Kalākaua Gardens's license number is 21-ALF.

When does Kalākaua Gardens's license expire?

According to HI state health department records, Kalākaua Gardens's license expires on September 30, 2026.

What is the phone number of Kalākaua Gardens?

(808) 518-2273 will put you in contact with the team at Kalākaua Gardens.

Is Kalākaua Gardens Medicare or Medicaid certified?

Yes — Kalākaua Gardens is a CMS-certified provider of Medicare and Medicaid.

Guides for Better Senior Living

Care Cost Calculator: See Prices in Your Area

Nursing Home Data Explorer

Don’t Wait Too Long: 7 Red Flag Signs Your Parent Needs Assisted Living Now

The True Cost of Assisted Living in 2025 – And How Families Are Paying For It

Understanding Senior Living Costs: Pricing Models, Discounts & Financial Assistance

Explore Open Rooms
1 Contact details
2 What type of senior care service are you looking for?
3 What budget do you have in mind for senior care?
4 How soon do you need to find care?
5 Additional details

Thank you for your interest!

Our team will be in touch shortly to help with next steps.