Kennebunk Center for Health & Rehabilitation
Nursing Home, Hospice Care, Palliative Care & Respite Care · Kennebunk, ME
CMS overall rating Info CMS (the Centers for Medicare & Medicaid Services) is the federal agency that rates nursing home quality. Its Overall Rating runs from 1 to 5 stars, combining health inspections, staffing, and quality measures, with inspections weighted most heavily.

Kennebunk Center for Health & Rehabilitation

Nursing Home, Hospice Care, Palliative Care & Respite Care · Kennebunk, ME
CMS overall rating Info CMS (the Centers for Medicare & Medicaid Services) is the federal agency that rates nursing home quality. Its Overall Rating runs from 1 to 5 stars, combining health inspections, staffing, and quality measures, with inspections weighted most heavily.
Calculator: See prices in your area
Kennebunk Center for Health & Rehabilitation accepts Medicare, Medicaid, and private pay.

Overview of Kennebunk Center for Health & Rehabilitation

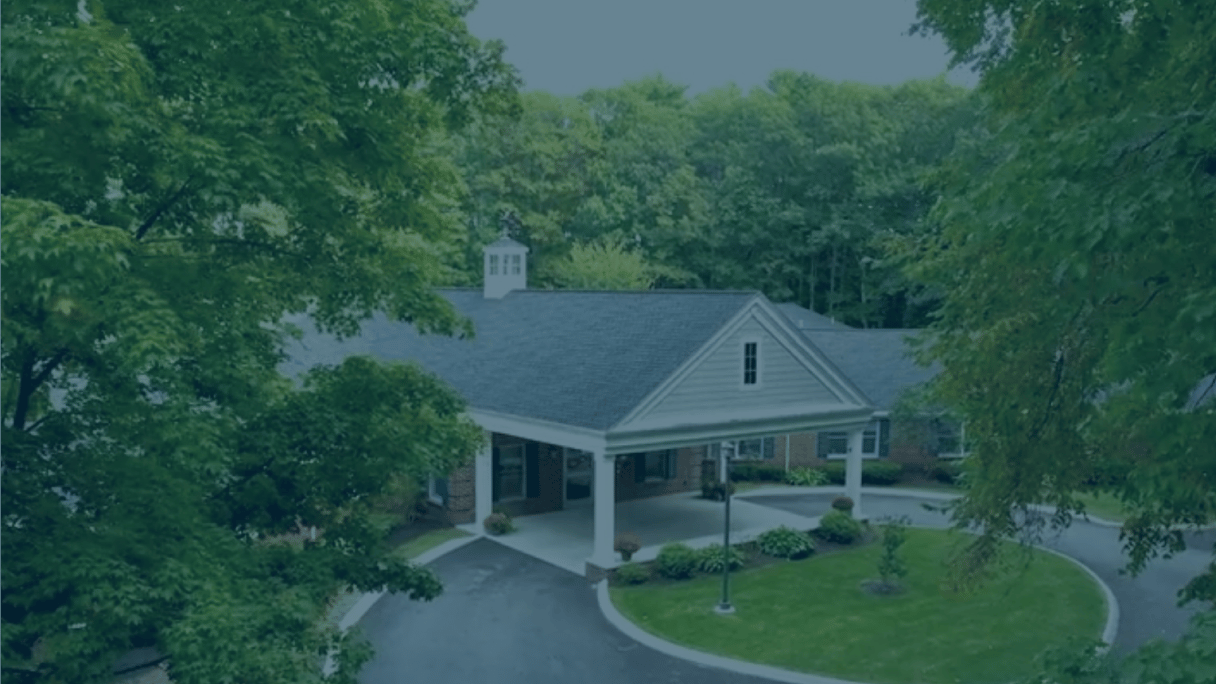
Kennebunk Center for Health & Rehabilitation is a nursing home in Kennebunk, ME, offering rehabilitation, respite care, skilled nursing, palliative, and hospice care. Dedicated to older adults’ comfort and healing, the community continuously promotes a supportive and welcoming environment. Three healthy meals daily, 24-hour care, and therapies are also offered, ensuring residents can focus on their recovery. Through a resident-centered approach, the community doubles its efforts to meet residents’ unique needs and preferences.

Arts and crafts, exercises, and pet therapy provide residents with more opportunities to explore new interests and gain meaningful experiences. A barber & beauty shop, a family room, and a spacious courtyard are among the state-of-the-art amenities dedicated to residents’ relaxation and wellness. Situated in the tree-lined neighborhood of Kennebunk, the community ensures residents have a stress-free retirement. This nursing home provides exceptional standards of care, making it a great choice for senior living in Maine.

Quality ratings

Measured by Centers for Medicare & Medicaid Services (CMS)

Overall rating Info The Overall CMS Rating combines results from health inspections, staffing levels and quality measures. Health inspections carry the most weight. Staffing and quality scores can increase or decrease the final rating based on performance compared to state and national standards.
At ME avg. At ME avg.ME average: 3.0Click the badge to see the full State ranking.Click here to see the full State ranking.
Health Inspection Info Based on the results of the facility's three most recent standard inspections and any complaint investigations. CMS reviews the number, scope, and severity of deficiencies, with more recent findings weighted more heavily.
▲ 5.5% Above ME avg. ▲ 5.5% Above ME avg.ME average: 2.8Click the badge to see the full State ranking.Click here to see the full State ranking.
Staffing Info Measures average nursing staff hours per resident per day, including Registered Nurses (RNs) and total nursing staff. Ratings are adjusted based on the level of care residents require and are compared to state and national benchmarks.
▼ 24.3% Below ME avg. ▼ 24.3% Below ME avg.ME average: 4.0Click the badge to see the full State ranking.Click here to see the full State ranking.
Quality Measures Info Based on clinical and physical health indicators reported to CMS, such as hospital readmissions, falls, pressure ulcers, and improvements in mobility. These measures reflect how well residents' health needs are being managed.
▼ 26.7% Below ME avg. ▼ 26.7% Below ME avg.ME average: 2.7Click the badge to see the full State ranking.Click here to see the full State ranking.

Staffing hours breakdown

Info Daily nursing hours per resident by staff type, reported to CMS. Higher is generally better — compare this facility to state and national averages to see where staffing stands.

Hours per resident per day — compared to Maine state averages

Total nursing care / resident Info This home is ranked 25th out of 34 homes in Maine for nurse hours. Total adjusted nursing hours per resident per day, combining RN, LPN, and aide time. CMS adjusts this for case-mix so facilities can be fairly compared.
3h 35m per day
Rank #25 / 34Nurse hours — State benchmarkedThis home is ranked 25th out of 34 homes in Maine. Shows adjusted nurse hours per resident per day benchmarked to the Maine average, with a ranking across 34 Maine facilities. More hours mean more direct care. The national average is about 3.5 hrs; below 3.0 is a red flag.Rankings are based only on facilities in Maine that report data for that category. Facilities without available data are excluded from the ranking.Click the rank badge to see the full State ranking.Click here to see the full State ranking.
This facility Maine avg (4h 30m per day)
vs Maine avg
-20%

5 of 6 metrics below state avg

Standout metric LPN / LVN is +48% above state avg
Staff typeHours / Day / Residentvs state avg
Registered Nurse (RN) Info RNs hold the highest nursing license and can assess residents, interpret test results, and direct care plans. More RN hours per day often signals stronger clinical oversight and faster response to health changes. 57m per day ▼ 10% State avg: 1h 3m per day · National avg: 41m per day
LPN / LVN Info Licensed Practical Nurses (LPNs) or Licensed Vocational Nurses (LVNs) deliver routine hands-on care — medication administration, wound dressing, and monitoring vital signs. They work under RN supervision and make up a large share of daily bedside care. 40m per day ▲ 48% State avg: 27m per day · National avg: 52m per day
Nurse Aide Info Certified Nurse Aides (CNAs) provide the most direct day-to-day assistance: bathing, dressing, feeding, and mobility. Nurse aide hours are typically the largest staffing category and directly affect residents' quality of life. 2h 25m per day ▼ 15% State avg: 2h 51m per day · National avg: 2h 21m per day
Weekend Total Nursing Info Combined nursing hours (RN + LPN + Nurse Aide) per resident per day on weekends. Staffing often drops on weekends — this figure reveals whether the facility maintains adequate coverage outside of weekday hours. 3h 37m per day ▼ 8% State avg: 3h 55m per day · National avg: 3h 26m per day
Physical Therapist Info Hours per resident per day provided by licensed Physical Therapists (PTs) or PT Assistants. PT services help residents recover mobility after injury or illness and are especially important for post-acute (short-stay) rehabilitation. 3m per day ▼ 15% State avg: 4m per day · National avg: 4m per day
Weekend RN Info Registered nurse hours specifically on weekends. Facilities sometimes reduce RN presence on Saturdays and Sundays — a low weekend RN figure compared to weekday hours can indicate reduced clinical oversight when most administrative staff are absent. 23m per day ▼ 48% State avg: 44m per day · National avg: 29m per day

Capacity and availability

This home usually has limited availability

Higher occupancy than the Maine average: 83.1%
Occupancy rate
91.3% Rank #143 / 251Occupancy rate — State benchmarkedThis home is ranked 143rd out of 251 homes in Maine. Shows this facility's occupancy rate versus the Maine average, with its Statewide rank out of 251. Higher occupancy signals strong local demand and financial stability.Rankings are based only on facilities in Maine that report data for that category. Facilities without available data are excluded from the ranking.Click the rank badge to see the full State ranking.Click here to see the full State ranking.
Avg. Length of Stay
72 days
Bed community size
78-bed community Rank #26 / 357Bed count — State benchmarkedThis home is ranked 26th out of 357 homes in Maine. Shows this facility's certified or reported bed count compared to other Maine facilities. Larger communities may offer more amenities, programs, and on-site services for residents and families.Rankings are based only on facilities in Maine that report data for that category. Facilities without available data are excluded from the ranking.Click the rank badge to see the full State ranking.Click here to see the full State ranking.
A larger shared setting that may offer more common spaces and organized community services.
Walk Score
Walk Score: 10 / 100 Rank #290 / 422Walk Score — State benchmarkedThis home is ranked 290th out of 422 homes in Maine. Shows how walkable this facility's neighborhood is compared to the average Walk Score across Maine facilities. Higher scores benefit residents, families, and staff.Rankings are based only on facilities in Maine that report data for that category. Facilities without available data are excluded from the ranking.Click the rank badge to see the full State ranking.Click here to see the full State ranking.
Car-dependent. Most errands require a car, with limited nearby walkable options.

About this community

Awards

McKnight’s Excellence in Technology Award

License Details

CertificationsCertified Great Place to Work, McKnight’s Excellence in Technology Award

Safety & Compliance

Safety Features24-hour skilled nursing care, remote monitoring devices.

Therapy & Rehabilitation

3 services
Rehabilitation Services
Respite Care
Short-Term Rehab

Staffing & Medical

1 service
24-Hour Staffing

Additional Services

1 service
Home Care

Additional Policies & Features

Visitor PolicyVisitors are welcome from 8 am to 8 pm.
Overnight GuestsShort-term guests can leave for special occasions but not overnight.
Admission CriteriaAdmission Agreement form required within 48 hours of arrival.

Amenities & Lifestyle

Salon
Barber
Transportation
Housekeeping
Laundry
Telehealth
Activities
Wellness Program
Branded ProgramsPassport™
Specific ProgramsPhysical therapy, speech therapy, occupational therapy, heart failure and cardiac recovery, pulmonary disease management, neurology and stroke rehabilitation, orthopedic injuries and post-surgical care, diabetes management, pain management, wound care, amputee rehabilitation, IV therapies
Religious Services
Volunteer Program

Contact Kennebunk Center for Health & Rehabilitation

Staffing Data

Reporting period: October 1 – December 31, 2025 (Q4 2025). Source: CMS Payroll-Based Journal report.

Total staff 178
Employees 100
Contractors 78
Staff to resident ratio 2.37 : 1
17% more staff per resident than Maine average
Maine average ratio: 2.03 : 1 Maine average ratio: 2.03 : 1See full Maine ranking
Avg staff/day 43
Average shift 8.1 hours
0% compared with Maine average
Maine average: 8.1 hours Maine average shift: 8.1 hoursSee full Maine ranking
Total staff hours (quarter) 31,993

Nursing staff breakdown

Q4 2025 · Oct 1 – Dec 31 More info This data comes from the CMS Payroll-Based Journal report covering October 1 – December 31, 2025.
Registered Nurse

Manages medical care and health needs.

RN Staff Info 25 total: 19 full-time employees and 6 contractors. 25
Average shift length Info Average shift length. Calculated as total hours divided by days worked and average staff per day. 8.4 hours
Licensed Practical Nurse

Assists with medical care and medications.

LPN Staff Info 20 total: 9 full-time employees and 11 contractors. 20
Average shift length Info Average shift length. Calculated as total hours divided by days worked and average staff per day. 9.2 hours
Certified Nursing Assistant

Helps with daily care and mobility.

CNA Staff Info 92 total: 53 full-time employees and 39 contractors. 92
Average shift length Info Average shift length. Calculated as total hours divided by days worked and average staff per day. 7.8 hours

Contractor staffing

Q4 2025 · Oct 1 – Dec 31 More info This data comes from the CMS Payroll-Based Journal report covering October 1 – December 31, 2025.

Total hours from contractors

19.8%

6,332 contractor hours this quarter

Certified Nursing Assistant: 39 Licensed Practical Nurse: 11 Physical Therapy Assistant: 11 Registered Nurse: 6 Physical Therapy Aide: 4 Respiratory Therapy Technician: 3 Speech Language Pathologist: 2 Medication Aide/Technician: 1 Qualified Social Worker: 1

Staff by category

Q4 2025 · Oct 1 – Dec 31 More info This data comes from the CMS Payroll-Based Journal report covering October 1 – December 31, 2025.
Certified Nursing Assistant53399213,29892100%7.8
Registered Nurse196255,00792100%8.4
Licensed Practical Nurse911204,52392100%9.2
Medication Aide/Technician7183,09992100%9
Physical Therapy Assistant011119348087%6.5
Clinical Nurse Specialist3039206672%7.9
Dental Services Staff1015166368%8.2
Administrator1015126470%8
Nurse Practitioner1014966267%8
Mental Health Service Worker1014886166%8
Qualified Social Worker0114786166%7.8
Dietitian2024725964%8
Respiratory Therapy Technician0333856571%5.8
Speech Language Pathologist0223786267%6
Other Dietary Services Staff3033425459%6
Physical Therapy Aide0441462932%5
92 Certified Nursing Assistant
% of Days 100%
25 Registered Nurse
% of Days 100%
20 Licensed Practical Nurse
% of Days 100%
8 Medication Aide/Technician
% of Days 100%
11 Physical Therapy Assistant
% of Days 87%
3 Clinical Nurse Specialist
% of Days 72%
1 Dental Services Staff
% of Days 68%
1 Administrator
% of Days 70%
1 Nurse Practitioner
% of Days 67%
1 Mental Health Service Worker
% of Days 66%
1 Qualified Social Worker
% of Days 66%
2 Dietitian
% of Days 64%
3 Respiratory Therapy Technician
% of Days 71%
2 Speech Language Pathologist
% of Days 67%
3 Other Dietary Services Staff
% of Days 59%
4 Physical Therapy Aide
% of Days 32%

Penalties and fines

Federal penalties imposed by CMS for regulatory violations, including civil money penalties (fines) and denials of payment for new Medicare/Medicaid admissions.

Source: CMS Penalties Database

No penalties in the past 3 years

No civil money penalties or payment denials were reported in the last 3 years.

Quality of care over time

These measures show how residents usually do over time at this home, based on health outcomes and preventive care.

High-risk clinical events score Info A composite score based on pressure ulcers, falls with injury, weight loss, walking ability decline, and activities of daily living decline. 8.3
41% better than Maine average

Maine average: 14.2

Functional decline score Info A composite score based on activities of daily living decline, walking ability decline, and incontinence. 18.5
37% better than Maine average

Maine average: 29.1

Long-stay resident measures
Below average Info CMS star rating based on long-stay quality measure performance. 5 stars = significantly above average, 1 star = significantly below average.
Need for Help with Daily Activities Increased Info Percent of long-stay residents whose need for help with daily activities has increased 11.6%
55% better than Maine average

Maine average: 26.0%

Walking Ability Worsened Info Percent of long-stay residents whose ability to move independently worsened 11.4%
64% better than Maine average

Maine average: 31.4%

Low Risk Residents with Bowel/Bladder Incontinence Info Percent of low risk long-stay residents who lose control of their bowels or bladder 32.4%
9% worse than Maine average

Maine average: 29.8%

Falls with Major Injury Info Percent of long-stay residents experiencing one or more falls with major injury 5.7%
29% worse than Maine average

Maine average: 4.4%

High Risk Residents with Pressure Ulcers Info Percent of long-stay high risk residents with pressure ulcers 6.0%
35% worse than Maine average

Maine average: 4.5%

Urinary Tract Infection Info Percent of long-stay residents with a urinary tract infection 3.4%
22% worse than Maine average

Maine average: 2.8%

Lost Too Much Weight Info Percent of long-stay residents who lose too much weight 7.0%
28% worse than Maine average

Maine average: 5.5%

Depressive Symptoms Info Percent of long-stay residents who have depressive symptoms 41.5%
296% worse than Maine average

Maine average: 10.5%

Antipsychotic Use Info Percent of long-stay residents who received an antipsychotic medication 17.2%
13% better than Maine average

Maine average: 19.8%

Pneumococcal Vaccine Info Percent of long-stay residents assessed and appropriately given the pneumococcal vaccine 97.2%
8% better than Maine average

Maine average: 90.1%

Influenza Vaccine Info Percent of long-stay residents assessed and appropriately given the seasonal influenza vaccine 96.9%
In line with Maine average

Maine average: 95.5%

Hospitalizations per 1,000 days Info Number of hospitalizations per 1,000 long-stay resident days. 2.14
54% worse than Maine average

Maine average: 1.39

ED visits per 1,000 days Info Number of outpatient emergency department visits per 1,000 long-stay resident days. 2.37
14% worse than Maine average

Maine average: 2.08

Short-stay resident measures
Below average Info CMS star rating based on short-stay quality measure performance. 5 stars = much above average, 1 star = much below average.
Pneumococcal Vaccine Info Percent of short-stay residents assessed and appropriately given the pneumococcal vaccine 78.1%
10% better than Maine average

Maine average: 70.8%

Antipsychotic medication increase Info Percent of short-stay residents who newly received an antipsychotic medication 2.1%
43% worse than Maine average

Maine average: 1.4%

Influenza Vaccine Info Percent of short-stay residents assessed and appropriately given the seasonal influenza vaccine 79.3%
6% better than Maine average

Maine average: 74.5%

Re-hospitalized after SNF stay Info Percentage of short-stay residents who were re-hospitalized after their nursing home admission. 33.0%
61% worse than Maine average

Maine average: 20.5%

Emergency department visits Info Percentage of short-stay residents who had an outpatient emergency department visit. 16.8%
8% worse than Maine average

Maine average: 15.6%

Falls with major injury Info Percentage of SNF residents who experience falls with major injury during their stay. 0.7%
9% better than Maine average

Maine average: 0.8%

Ability to care for self at discharge Info Percentage of residents at or above expected ability to care for themselves at discharge. 59.7%
11% better than Maine average

Maine average: 53.7%

Successful return to home or community Info Rate of successful return to home or community from a skilled nursing facility. 52.8%
In line with Maine average

Maine average: 50.6%

Breakdown by payment type

Medicare

34% of new residents, usually for short-term rehab.

Typical stay 25 days

Private pay

63% of new residents, often for short stays.

Typical stay 30 days

Medicaid

4% of new residents, often for long-term daily care.

Typical stay 3 years

Facility Characteristics

Source: CMS Long-Term Care Facility Characteristics (Data as of Jan 2026)

Total residents 75
Medicare
15
20% of residents
Medicaid
43
57.3% of residents
Private pay or other
17
22.7% of residents
Programs & Services
Residents Group

Residents meet regularly to discuss policies, care quality, and activities

Active Resident Council

Organized group of residents that meets regularly to discuss facility policies, quality of life, and activities.

Finances and operations

Based on CMS SNF Cost Report for fiscal year ending in 12/2023.

For-profit
Corporation
Net patient revenue Info Net patient revenue — what the home actually collects for resident care, after contractual allowances, bad debt and discounts are subtracted from its gross charges (CMS cost report, Worksheet G-3). It covers resident care only; money the home earns from other sources is shown separately as "Other income."
$11.0M
Net patient income Info Net patient income: net patient revenue minus the home's total operating expenses. A positive figure means it earns more from resident care than it spends to deliver it; a negative figure means the opposite. It excludes non-operating "other income."
-$1.1M
For-profit Corporation
Net patient revenue Info Net patient revenue — what the home actually collects for resident care, after contractual allowances, bad debt and discounts are subtracted from its gross charges (CMS cost report, Worksheet G-3). It covers resident care only; money the home earns from other sources is shown separately as "Other income."
$11.0M Rank #25 / 40Revenue — State benchmarkedThis home is ranked 25th out of 40 homes in Maine. Shows this facility's annual revenue compared to the Maine average. Higher revenue generally means more resources for staffing and capital — read alongside Payroll %.Rankings are based only on facilities in Maine that report data for that category. Facilities without available data are excluded from the ranking.Click the rank badge to see the full State ranking.Click here to see the full State ranking.
Net patient income Info Net patient income: net patient revenue minus the home's total operating expenses. A positive figure means it earns more from resident care than it spends to deliver it; a negative figure means the opposite. It excludes non-operating "other income."
-$1.1M
Other income Info Money the home earns outside of resident care — such as investments, grants, rentals and other non-operating sources (CMS cost report, Worksheet G-3). It is tracked separately from net patient revenue: it is not part of that figure, and it is not included in net patient income.
$18.3K
Payroll costs Info Staff salaries plus wage-related costs — benefits such as payroll taxes, health insurance and retirement — from the home's own accounting records (CMS cost report, Worksheet A). Contract or agency labor is counted separately, under other operating costs. Rank #20 / 40Payroll — State benchmarkedThis home is ranked 20th out of 40 homes in Maine. Shows total annual staff payroll benchmarked to the Maine average. Higher payroll investment relative to peers often signals better staffing and less reliance on cheaper contract labor.Rankings are based only on facilities in Maine that report data for that category. Facilities without available data are excluded from the ranking.Click the rank badge to see the full State ranking.Click here to see the full State ranking.
$5.2M 47.4% of net patient revenue Info Payroll as a share of revenue: staff salaries and wage-related benefits divided by net patient revenue. A higher figure means more of each revenue dollar goes to staff pay. Rank #11 / 40Payroll % — State benchmarkedThis home is ranked 11th out of 40 homes in Maine. Shows payroll as a percentage of revenue versus the Maine average. Well-run Maine facilities typically land around 60–66% — the top third Statewide. Below 25% may signal understaffing or heavy agency use — read with Staffing ratings.Rankings are based only on facilities in Maine that report data for that category. Facilities without available data are excluded from the ranking.Click the rank badge to see the full State ranking.Click here to see the full State ranking.
Other operating costs Info Everything it costs to run the home apart from payroll — food, utilities, supplies, maintenance, contract labor and administration. Calculated as total operating expense minus payroll (staff salaries and wage-related benefits).
$6.9M
Total costs Info The home's total operating expense for the year — all the costs of running it, salaries included (CMS cost report, Worksheet G-3).
$12.1M

What does this home offer?

Housing options icon

Housing Options: Private / Semi-Private Rooms

Building type icon
Building type icon

Building Type: Single-story

Beauty services icon

Beauty Services

Housekeeping icon
Housekeeping icon

Housekeeping Services

Social and recreational activities icon

Social and Recreational Activities

Rehabilitative support icon

Rehabilitative Support

On-site medical care and health services icon

On-site Medical Care and Health Services

Who this home usually serves

TYPE OF STAY

Primarily short stays

Residents typically stay for brief periods, with frequent admissions and discharges throughout the year.

Most new residents arrive under private pay (63% of admissions), and a typical private pay stay runs around 30 days.

Admissions
366 total

Coverage residents most often arrive under.

Medicare 34%
Private pay 63%
Medicaid 4%
Discharges
362 total

Coverage residents most often leave under.

Medicare 29%
Private pay 61%
Medicaid 10%

Places of interest near Kennebunk Center for Health & Rehabilitation

Address 1.3 miles from city center Info Estimated distance in miles from Kennebunk's city center to Kennebunk Center for Health & Rehabilitation's address, calculated via Google Maps.

Calculate Travel Distance to Kennebunk Center for Health & Rehabilitation

Add your location

Address

Compare Nursing Homes around Kennebunk

The information below is reported by the Maine Department of Health and Human Services, Division of Licensing and Certification.

2 facilities compared · CMS & ME Dept. of Health data

Kennebunk Center for Health & Rehabilitation
NH
HC
PC
RC
Kennebunk (Ross Road)
78
Facility 78
ME AVG 20
Rank #26 / 357
91.3%
Facility 91.3%
ME AVG 83.1%
Rank #143 / 251
+10%
3.58
Facility 3.58
ME AVG 4.50
Rank #25 / 34
-6%-20%
$0
Facility $0
ME AVG $26.4k
Rank #1 / 34
32
Facility 32
ME AVG 28.5
Rank #22 / 34
5.3
Facility 5.3
ME AVG 5.9
Rank #14 / 34
-74-
10
Facility 10
ME AVG 31
Rank #290 / 422
Edward Stewart
$11.0M
Facility $11.0M
ME AVG $16.9M
Rank #25 / 40
$5.2M
Facility $5.2M
ME AVG $4.7M
Rank #20 / 40
47.4%
Facility 47.4%
ME AVG 37.8%
Rank #11 / 40
205095
RiverRidge Center
NH
Kennebunk
62
Facility 62
ME AVG 20
Rank #40 / 357
85.0%
Facility 85.0%
ME AVG 83.1%
Rank #168 / 251
+2%
3.17
Facility 3.17
ME AVG 4.50
Rank #31 / 34
+12%-30%
$15.3k
Facility $15.3k
ME AVG $26.4k
Rank #32 / 34
27
Facility 27
ME AVG 28.5
Rank #16 / 34
5.4
Facility 5.4
ME AVG 5.9
Rank #15 / 34
156-
19
Facility 19
ME AVG 31
Rank #232 / 422
Stephen Doane
$9.4M
Facility $9.4M
ME AVG $16.9M
Rank #21 / 40
$4.8M
Facility $4.8M
ME AVG $4.7M
Rank #22 / 40
51.1%
Facility 51.1%
ME AVG 37.8%
Rank #18 / 40
205065

Financial Assistance for
Nursing Home in Maine

Kennebunk Center for Health & Rehabilitation is located in Kennebunk, Maine.
Here are the financial assistance programs available to residents in Maine.

Get Financial aid guidance

Home and Community Benefits for the Elderly

MaineCare HCB Program

Age 65+ or 18+ with disability
General Maine resident, Medicaid- eligible, nursing home-level care need.
Income Limits (2025) ~$2,829/month 300% FBR, individual
Asset Limits $2,000 (individual), $3,000 (couple).
ME

Rural access emphasized.

Benefits
Personal care (5-7 hours/day) Respite (240 hours/year) Meals ($6/meal) Adult day services ($60/day)

Maine Statewide Respite Program

ME Respite Program

Age
General Caregiver of someone 60+ with dementia, Maine resident.
Income Limits ~$2,500/month individual, varies
Asset Limits $40,000 individual
ME

Limited to dementia caregivers; capped funding.

Benefits
In-home respite (up to 30 days/year) Adult day care (~$60/day)

MaineCare Long-Term Care (Nursing Facility Services)

MaineCare Nursing Facility Services

Age 65+
General Maine resident, Medicaid-eligible, requires nursing home-level care.
Income Limits (2025) $943/month (individual); must be less than nursing home cost for full coverage.
Asset Limits $2,000 (individual), $3,000 (couple); spousal allowance up to $155,356.
ME

Home equity limit of $636,000; estate recovery applies post-55.

Benefits
24/7 nursing care Meals Therapy Medications (hours unlimited per medical need)

Consumer-Directed Home-Based Care (CDHBC)

Maine Consumer-Directed Personal Assistance Services

Age 65+
General Maine resident, needs ADL assistance, income/asset limits apply.
Income Limits (2025) ~$2,000/month varies by AAA
Asset Limits Not strict; prioritizes low-income.
ME

Available through five Area Agencies on Aging.

Benefits
Personal care (20-30 hours/week) PERS Adult day care Home modifications

Home Accessibility and Repair Program

Maine State Housing Authority Home Accessibility and Repair

Age 62+
General Maine resident, homeowner, low-income.
Income Limits (2025) ~$34,000/year individual, 80% AMI, varies by county
Asset Limits Not specified; focus on income.
ME

Includes Elderly Hardship Grants for urgent repairs.

Benefits
Wheelchair ramps Grab bars Roof repairs (up to $20,000/project)

Program of All-Inclusive Care for the Elderly (PACE)

Maine PACE (not widely available yet)

Age 55+
General Maine resident, Medicare/Medicaid-eligible, nursing home-level care need, community-safe.
Income Limits (2025) No strict limit; Medicaid portion $2,901/month max.
Asset Limits $2,000 (individual) for Medicaid portion.
ME

Pilot phase; check availability with DHHS.

Benefits
Medical care Personal care Day center Transportation Respite (tailored to need)

Veterans Aid and Attendance (A&A) Benefit

Maine VA Aid and Attendance

Age
General Wartime veteran/spouse, age 65+ or disabled, needs ADL help, Maine resident.
Income Limits (2025) Net income minus medical expenses < $1,984/month individual with A&A
Asset Limits $155,356 net worth limit
ME

High veteran population in rural areas.

Benefits
Cash benefit ($1,478-$2,471/month, varies by status) for care costs

Medicare Savings Programs (MSP)

Maine Medicare Savings Programs

Age 65+
General Maine resident, Medicare Part A/B enrollee.
Income Limits (2025) $2,014/month (individual, QMB), $2,706/month (SLMB/QI).
Asset Limits $9,090 (individual), $13,630 (couple).
ME

Includes Qualified Medicare Beneficiary (QMB), Specified Low-Income Medicare Beneficiary (SLMB), and Qualified Individual (QI).

Benefits
Covers Medicare premiums (up to $174.70/month Part B) Co-pays Deductibles

Frequently Asked Questions about Kennebunk Center for Health & Rehabilitation

What neighborhood is Kennebunk Center for Health & Rehabilitation in?

Kennebunk Center for Health & Rehabilitation is in the Ross Road neighborhood.

Is Kennebunk Center for Health & Rehabilitation in a walkable area?

Kennebunk Center for Health & Rehabilitation has a walk score of 10. Car-dependent. Most errands require a car, with limited nearby walkable options.

What is the occupancy rate at Kennebunk Center for Health & Rehabilitation?

Kennebunk Center for Health & Rehabilitation's occupancy is 91.3%.

Does Kennebunk Center for Health & Rehabilitation operate as a for-profit or non-profit?

Kennebunk Center for Health & Rehabilitation is registered as a for-profit.

Are there photos of Kennebunk Center for Health & Rehabilitation?

Yes — there are 10 photos of Kennebunk Center for Health & Rehabilitation in the photo gallery on this page.

What is the address of Kennebunk Center for Health & Rehabilitation?

Kennebunk Center for Health & Rehabilitation is located at 158 Ross Rd, Kennebunk, ME 04043.

What is the phone number of Kennebunk Center for Health & Rehabilitation?

(207) 985-7141 will put you in contact with the team at Kennebunk Center for Health & Rehabilitation.

Guides for Better Senior Living

Care Cost Calculator: See Prices in Your Area

Nursing Home Data Explorer

Don’t Wait Too Long: 7 Red Flag Signs Your Parent Needs Assisted Living Now

The True Cost of Assisted Living in 2025 – And How Families Are Paying For It

Understanding Senior Living Costs: Pricing Models, Discounts & Financial Assistance