


Total staff
209
Employees
109
Contractors
100
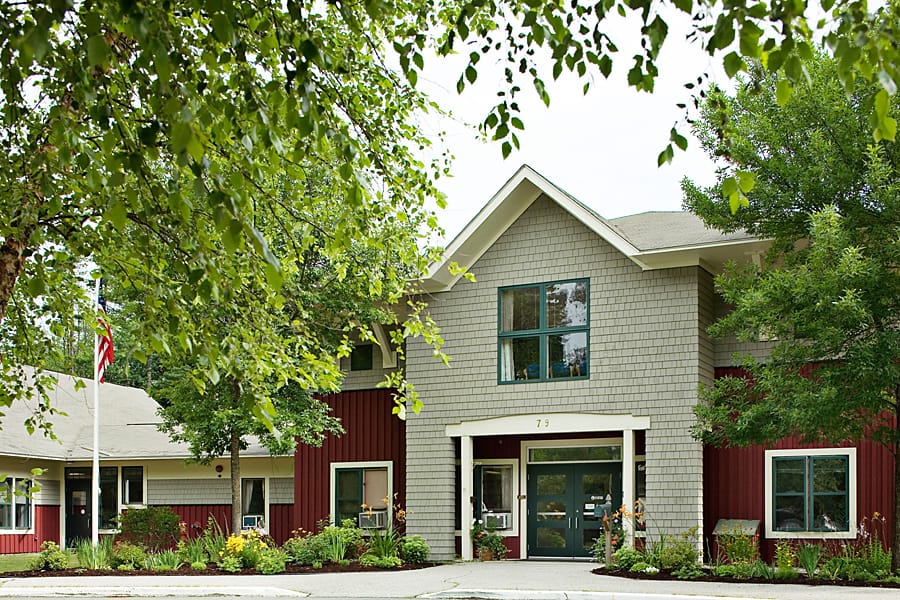
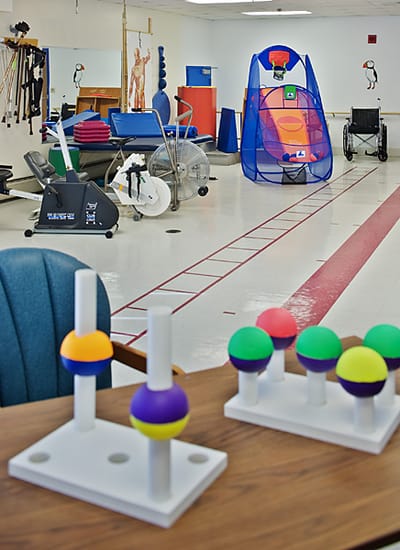
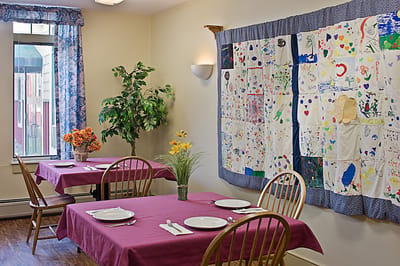

RiverRidge Center is a nursing home in Kennebunk, ME, offering long-term care, skilled nursing, and rehabilitation. The community also promotes a warm and nurturing environment, ensuring older adults are well-cared for during their stay. 24-hour care, well-balanced meals, and therapies are among the excellent services provided for residents’ unique needs and preferences. Following a holistic approach to care, the community provides care plans dedicated to their rehabilitation and recovery.
Light exercises, pet therapy, and recreational activities encourage residents to stay active and make friends. Spacious common areas and thoughtfully curated amenities are also available, so residents can rest and move around comfortably. Residents also experience a laid-back retirement, as it is beautifully located near the Mousam River in Kennebunk. Providing top-notch services and amenities, this nursing home is undoubtedly a good option for senior living in Maine.
| Staff type | Hours / Day / Resident | vs state avg |
|---|---|---|
|
Registered Nurse (RN)
| 1h 25m per day | ▲ 35% State avg: 1h 3m per day · National avg: 41m per day |
|
LPN / LVN
| 35m per day | ▲ 31% State avg: 27m per day · National avg: 52m per day |
|
Nurse Aide
| 2h 1m per day | ▼ 29% State avg: 2h 51m per day · National avg: 2h 21m per day |
|
Weekend Total Nursing
| 3h 36m per day | ▼ 8% State avg: 3h 55m per day · National avg: 3h 26m per day |
|
Physical Therapist
| 5m per day | ▲ 14% State avg: 4m per day · National avg: 4m per day |
|
Weekend RN
| 1h 1m per day | ▲ 38% State avg: 44m per day · National avg: 29m per day |
Reporting period: October 1 – December 31, 2025 (Q4 2025). Source: CMS Payroll-Based Journal report.
Manages medical care and health needs.
Assists with medical care and medications.
Helps with daily care and mobility.
Total hours from contractors
6,025 contractor hours this quarter
| Certified Nursing Assistant | 32 | 60 | 92 | 9,803 | 92 | 100% | 8.2 |
| Registered Nurse | 20 | 15 | 35 | 5,747 | 92 | 100% | 7.9 |
| Licensed Practical Nurse | 4 | 18 | 22 | 3,038 | 92 | 100% | 9 |
| Therapeutic Recreation Specialist | 5 | 0 | 5 | 1,800 | 82 | 89% | 7.6 |
| Clinical Nurse Specialist | 3 | 0 | 3 | 1,045 | 65 | 71% | 7.1 |
| Physical Therapy Assistant | 8 | 0 | 8 | 997 | 77 | 84% | 5.3 |
| Other Dietary Services Staff | 3 | 0 | 3 | 889 | 70 | 76% | 7.4 |
| Speech Language Pathologist | 5 | 1 | 6 | 744 | 68 | 74% | 5.4 |
| Medication Aide/Technician | 7 | 0 | 7 | 661 | 71 | 77% | 7.5 |
| Qualified Social Worker | 6 | 1 | 7 | 645 | 72 | 78% | 5.3 |
| Nurse Practitioner | 1 | 0 | 1 | 519 | 63 | 68% | 8.2 |
| Other Social Services Staff | 1 | 0 | 1 | 497 | 65 | 71% | 7.6 |
| Administrator | 1 | 0 | 1 | 480 | 60 | 65% | 8 |
| Physical Therapy Aide | 4 | 0 | 4 | 452 | 60 | 65% | 5.9 |
| Respiratory Therapy Technician | 7 | 2 | 9 | 392 | 75 | 82% | 4.1 |
| Dental Services Staff | 1 | 0 | 1 | 255 | 32 | 35% | 8 |
| Occupational Therapy Aide | 0 | 1 | 1 | 109 | 17 | 18% | 6.4 |
| Occupational Therapy Assistant | 0 | 1 | 1 | 54 | 39 | 42% | 1.4 |
| Medical Director | 0 | 1 | 1 | 38 | 14 | 15% | 2.7 |
| Mental Health Service Worker | 1 | 0 | 1 | 3 | 1 | 1% | 2.5 |
Includes penalties issued in 2025
Federal penalties imposed by CMS for regulatory violations, including civil money penalties (fines) and denials of payment for new Medicare/Medicaid admissions.
Source: CMS Penalties Database (Data as of Jan 2026)
Maine average: $24K
Maine average: 1.2
Maine average: 0.2
Penalties are imposed by CMS for violations of federal nursing home regulations.
1 penalty in the past 3 years
Jul 28, 2025 · $15K
Last updated: Jan 2026
These measures show how residents usually do over time at this home, based on health outcomes and preventive care.
Maine average: 14.2
Maine average: 29.1
Maine average: 26.0%
Maine average: 29.8%
Maine average: 4.4%
Maine average: 4.5%
Maine average: 2.8%
Maine average: 5.5%
Maine average: 10.5%
Maine average: 19.8%
Maine average: 90.1%
Maine average: 95.5%
Maine average: 1.39
Maine average: 2.08
Maine average: 70.8%
Maine average: 1.4%
Maine average: 74.5%
Maine average: 20.5%
Maine average: 15.6%
Maine average: 0.8%
Maine average: 53.7%
Maine average: 50.6%
Quality measures are calculated from Minimum Data Set (MDS) assessments. For most measures, lower percentages indicate better care quality.
29% of new residents, usually for short-term rehab.
63% of new residents, often for short stays.
9% of new residents, often for long-term daily care.
Source: CMS Long-Term Care Facility Characteristics (Data as of Jan 2026)
Residents meet regularly to discuss policies, care quality, and activities
State-approved Nurse Aide Training and Competency Evaluation Program on-site
Organized group of residents that meets regularly to discuss facility policies, quality of life, and activities.
Data sourced from CMS Long-Term Care Facility Characteristics quarterly report. Payer mix reflects the current resident census by primary payment source.
Historical financial and operational data for RiverRidge Center from 2012–2023, based on CMS SNF Cost Reports.
Key figures below are for fiscal year ending in 09/2023.
Based on CMS SNF Cost Report for fiscal year ending in 09/2023.
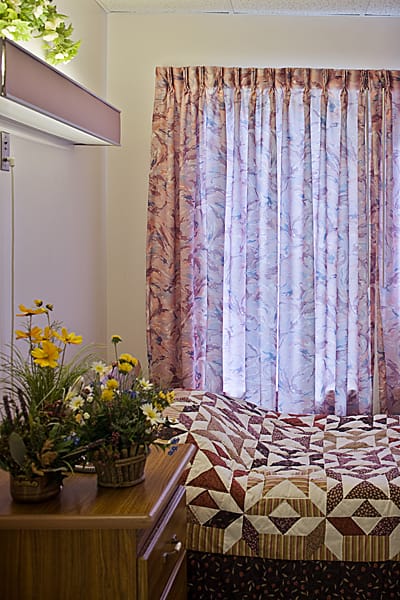
Housing Options: Private / Semi-Private Rooms
Building Type: 2-story
Beauty Services
Housekeeping Services
Social and Recreational Activities
Rehabilitative Support

On-site Medical Care and Health Services
Residents typically stay for brief periods, with frequent admissions and discharges throughout the year.
Most new residents arrive under private pay (63% of admissions), and a typical private pay stay runs around 1 - 2 months.
Coverage residents most often arrive under.
Coverage residents most often leave under.
![]() 0.8 miles from city center
0.8 miles from city center
![]() Estimated distance in miles from Kennebunk's city center to RiverRidge Center's address, calculated via Google Maps.
Estimated distance in miles from Kennebunk's city center to RiverRidge Center's address, calculated via Google Maps.
Add your location
Info below is compiled from CMS reports & the ME Dept. of Health & Human Services (DHHS), senior community websites & trusted data sources such as Walk Score & BBB.
Communities are listed from highest to lowest based on our ranking methodology.
| Kennebunk Center for Health & Rehabilitation | NH HOS PC RC SNF | Kennebunk (Ross Road) | 78
Facility
78
ME AVG
20
Rank
#26 / 356 |
94.6%
Facility
94.6%
ME AVG
87.2
Rank
#121 / 240 | +9% | 3.58
Facility
3.58
ME AVG
4.50
Rank
#25 / 34 | -6% | -20% | $0
Facility
$0
ME AVG
$26.4k
Rank
#1 / 34 | 32
Facility
32
ME AVG
28.5
Rank
#22 / 34 | 5.3
Facility
5.3
ME AVG
5.9
Rank
#14 / 34 | - | 74 | - |
10
Facility
10
ME AVG
31
Rank
#290 / 422 | Edward Stewart | $11.0MFiscal year ending 12/2023
Facility
$11.0MFiscal year ending 12/2023
ME AVG
$16.9M
Rank
#25 / 40 | $5.2MFiscal year ending 12/2023
Facility
$5.2MFiscal year ending 12/2023
ME AVG
$4.7M
Rank
#20 / 40 | 47.4%Fiscal year ending 12/2023
Facility
47.4%Fiscal year ending 12/2023
ME AVG
37.8%
Rank
#9 / 40 | 205095 | ||||
| RiverRidge Center | NH HOS RC SNF | Kennebunk | 62
Facility
62
ME AVG
20
Rank
#39 / 356 |
90.6%
Facility
90.6%
ME AVG
87.2
Rank
#142 / 240 | +4% | 3.17
Facility
3.17
ME AVG
4.50
Rank
#31 / 34 | +12% | -30% | $15.3k
Facility
$15.3k
ME AVG
$26.4k
Rank
#32 / 34 | 27
Facility
27
ME AVG
28.5
Rank
#16 / 34 | 5.4
Facility
5.4
ME AVG
5.9
Rank
#15 / 34 | 1 | 56 | - |
19
Facility
19
ME AVG
31
Rank
#232 / 422 | Stephen Doane | $9.4MFiscal year ending 09/2023
Facility
$9.4MFiscal year ending 09/2023
ME AVG
$16.9M
Rank
#21 / 40 | $4.8MFiscal year ending 09/2023
Facility
$4.8MFiscal year ending 09/2023
ME AVG
$4.7M
Rank
#22 / 40 | 51.1%Fiscal year ending 09/2023
Facility
51.1%Fiscal year ending 09/2023
ME AVG
37.8%
Rank
#18 / 40 | 205065 |
RiverRidge Center is located in Kennebunk, Maine.
Here are the financial assistance programs available to residents in Maine.
RiverRidge Center has a walk score of 19. Car-dependent. Most errands require a car, with limited nearby walkable options.
RiverRidge Center's occupancy is 85.0%.
No, RiverRidge Center has a no-pet policy.
RiverRidge Center is registered as a for-profit.
Yes — there are 5 photos of RiverRidge Center in the photo gallery on this page.
RiverRidge Center is located at 3 Brazier Ln, Kennebunk, ME 04043.
(207) 985-3030 will put you in contact with the team at RiverRidge Center.
Care Cost Calculator: See Prices in Your Area
Nursing Home Data Explorer
Don’t Wait Too Long: 7 Red Flag Signs Your Parent Needs Assisted Living Now
The True Cost of Assisted Living in 2025 – And How Families Are Paying For It
Understanding Senior Living Costs: Pricing Models, Discounts & Financial Assistance


