La Paloma Healthcare Center
Nursing Home · Oceanside, CA
CMS overall rating Info The Overall CMS Rating is scored from 1 to 5 stars and combines results from health inspections, staffing levels, and quality measures. Health inspections carry the most weight. Staffing and quality scores can increase or decrease the final rating based on performance compared to state and national standards.

La Paloma Healthcare Center

Nursing Home · Oceanside, CA
CMS overall rating Info The Overall CMS Rating is scored from 1 to 5 stars and combines results from health inspections, staffing levels, and quality measures. Health inspections carry the most weight. Staffing and quality scores can increase or decrease the final rating based on performance compared to state and national standards.
Calculator: See prices in your area
La Paloma Healthcare Center accepts Medicare, Medicaid, and private pay.

Overview of La Paloma Healthcare Center

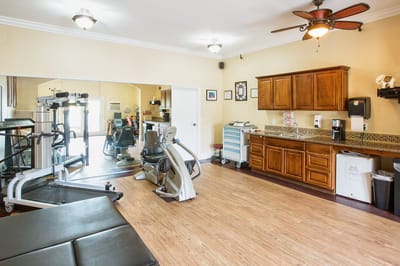
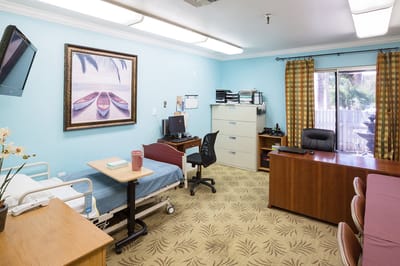
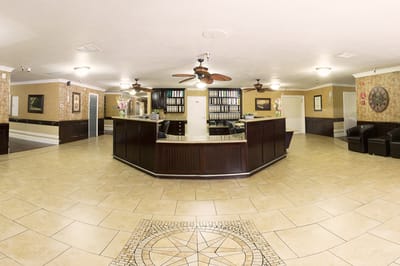
Pacific Villas Post Acute in Oceanside, CA, is a nursing home that offers a wide range of skilled nursing, rehabilitation, and respite care. With its warm and nurturing environment, the community ensures older adults can keep their peace of mind in retirement. 24-hour care, nutritious meals, and social services are also offered, so residents experience a worry-free lifestyle. Alongside plenty of specialized care, personalized care plans are also provided to help residents return to their routines and live to their potential.

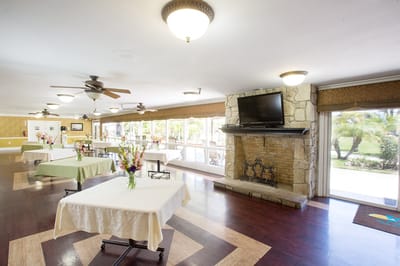
Musical performances, stretching, special events, and field trips are just some of the activities that residents can participate in to stay active and make friends. Cozy communal areas and thoughtfully furnished rooms are also available for residents’ relaxation and wellness. Residents also have quick access to healthcare and other necessities, with Tri-City Medical Park, Med-Care Plarmacy, restaurants, shops, and bus stops located in the area. Providing high standards of care and well-maintained amenities, this nursing home is one of the best options for senior living in California.

(760) 724-2193

Quality ratings

Measured by Centers for Medicare & Medicaid Services (CMS)

Overall rating Info The Overall CMS Rating combines results from health inspections, staffing levels and quality measures. Health inspections carry the most weight. Staffing and quality scores can increase or decrease the final rating based on performance compared to state and national standards.
▲ 58.8% Above CA avg. ▲ 58.8% Above CA avg.Click the badge to see the full State ranking.Click here to see the full State ranking.
Health Inspection Info Based on the results of the facility's three most recent standard inspections and any complaint investigations. CMS reviews the number, scope, and severity of deficiencies, with more recent findings weighted more heavily.
▲ 78.8% Above CA avg. ▲ 78.8% Above CA avg.Click the badge to see the full State ranking.Click here to see the full State ranking.
Staffing Info Measures average nursing staff hours per resident per day, including Registered Nurses (RNs) and total nursing staff. Ratings are adjusted based on the level of care residents require and are compared to state and national benchmarks.
▼ 36.3% Below CA avg. ▼ 36.3% Below CA avg.Click the badge to see the full State ranking.Click here to see the full State ranking.
Quality Measures Info Based on clinical and physical health indicators reported to CMS, such as hospital readmissions, falls, pressure ulcers, and improvements in mobility. These measures reflect how well residents' health needs are being managed.
▲ 22.4% Above CA avg. ▲ 22.4% Above CA avg.Click the badge to see the full State ranking.Click here to see the full State ranking.

Staffing hours breakdown

Info Daily nursing hours per resident by staff type, reported to CMS. Higher is generally better — compare this facility to state and national averages to see where staffing stands.

Hours per resident per day — compared to California state averages

Total nursing care / resident Info This home is ranked 207th out of 275 homes in California.

Total adjusted nursing hours per resident per day, combining RN, LPN, and aide time. CMS adjusts this for case-mix so facilities can be fairly compared.
3h 33m per day
Rank #207 / 275Nurse hours — State benchmarkedThis home is ranked 207th out of 275 homes in California.Shows adjusted nurse hours per resident per day benchmarked to the California average, with a ranking across 275 California SNFs. More hours mean more direct care. The national average is about 3.5 hrs; below 3.0 is a red flag.Click the rank badge to see the full State ranking.Click here to see the full State ranking.
This facility California avg (4h 13m per day)
vs California avg
-16%

5 of 6 metrics below state avg

Standout metric Physical Therapist is +100% above state avg
Staff type Hours / Day / Resident vs state avg
Registered Nurse (RN) Info RNs hold the highest nursing license and can assess residents, interpret test results, and direct care plans. More RN hours per day often signals stronger clinical oversight and faster response to health changes. 18m per day ▼ 54% State avg: 39m per day · National avg: 41m per day
LPN / LVN Info Licensed Practical Nurses (LPNs) or Licensed Vocational Nurses (LVNs) deliver routine hands-on care — medication administration, wound dressing, and monitoring vital signs. They work under RN supervision and make up a large share of daily bedside care. 1h 9m per day ▼ 5% State avg: 1h 13m per day · National avg: 52m per day
Nurse Aide Info Certified Nurse Aides (CNAs) provide the most direct day-to-day assistance: bathing, dressing, feeding, and mobility. Nurse aide hours are typically the largest staffing category and directly affect residents' quality of life. 2h 23m per day ▼ 10% State avg: 2h 39m per day · National avg: 2h 21m per day
Total Nursing (Weekend) Info Combined nursing hours (RN + LPN + Nurse Aide) per resident per day on weekends. Staffing often drops on weekends — this figure reveals whether the facility maintains adequate coverage outside of weekday hours. 3h 43m per day ▼ 9% State avg: 4h 5m per day · National avg: 3h 26m per day
Physical Therapist Info Hours per resident per day provided by licensed Physical Therapists (PTs) or PT Assistants. PT services help residents recover mobility after injury or illness and are especially important for post-acute (short-stay) rehabilitation. 10m per day ▲ 100% State avg: 5m per day · National avg: 4m per day
RN (Weekend) Info Registered nurse hours specifically on weekends. Facilities sometimes reduce RN presence on Saturdays and Sundays — a low weekend RN figure compared to weekday hours can indicate reduced clinical oversight when most administrative staff are absent. 10m per day ▼ 67% State avg: 30m per day · National avg: 29m per day

Capacity and availability

This home usually has limited availability

Occupancy between 85% and 95% suggests balanced demand.

Higher occupancy than the California average: 84.7%
Occupancy rate 91.9% Rank #63 / 281Occupancy rate — State benchmarkedThis home is ranked 63rd out of 281 homes in California.Shows this facility's occupancy rate versus the California average, with its Statewide rank out of 281. Higher occupancy signals strong local demand and financial stability.Click the rank badge to see the full State ranking.Click here to see the full State ranking.
Avg. Length of Stay 50 days
Occupancy rate
91.9% Rank #63 / 281Occupancy rate — State benchmarkedThis home is ranked 63rd out of 281 homes in California.Shows this facility's occupancy rate versus the California average, with its Statewide rank out of 281. Higher occupancy signals strong local demand and financial stability.Click the rank badge to see the full State ranking.Click here to see the full State ranking.
Avg. Length of Stay
50 days

Who this home usually serves

TYPE OF STAY

Primarily short stays

Residents typically stay for brief periods, with frequent admissions and discharges throughout the year.

Breakdown by payment type

Medicare

26% of new residents, usually for short-term rehab.

Typical stay 1 - 2 months

Private pay

74% of new residents, often for short stays.

Typical stay 1 - 2 months

Medicaid

1% of new residents, often for long-term daily care.

Typical stay 9 months

Finances and operations

Privately-owned community
Home revenue
$20.6M
Profit
$1.2M
Privately-owned community
Home revenue
$20.6M Rank #99 / 279Revenue — State benchmarkedThis home is ranked 99th out of 279 homes in California.Shows this facility's annual revenue compared to the California SNF average. Higher revenue generally means more resources for staffing and capital — read alongside Payroll %.Click the rank badge to see the full State ranking.Click here to see the full State ranking.
Profit
$1.2M
Payroll costs Info The portion of the home's budget spent on staff, including nurses, caregivers, and other employees who support care and operations. Rank #114 / 279Payroll — State benchmarkedThis home is ranked 114th out of 279 homes in California.Shows total annual staff payroll benchmarked to the California average. Higher payroll investment relative to peers often signals better staffing and less reliance on cheaper contract labor.Click the rank badge to see the full State ranking.Click here to see the full State ranking.
$9.2M
44.7% of revenue Rank #173 / 279Payroll % — State benchmarkedThis home is ranked 173rd out of 279 homes in California.Shows payroll as a percentage of revenue versus the California average. Well-run California SNFs typically land around 56–66% — the top third Statewide. Below 25% may signal understaffing or heavy agency use — read with Staffing ratings.Click the rank badge to see the full State ranking.Click here to see the full State ranking.
Other operating costs Info All remaining costs needed to run the home, such as food, utilities, building maintenance, supplies and administrative expenses.
$10.1M
Total costs $19.3M
Walk Score
Walk Score: 59 / 100 Rank #168 / 279Walk Score — State benchmarkedThis home is ranked 168th out of 279 homes in California.Shows how walkable this facility's neighborhood is compared to the average Walk Score across California SNFs. Higher scores benefit residents, families, and staff.Click the rank badge to see the full State ranking.Click here to see the full State ranking.
Moderately walkable. Some errands can be accomplished on foot, with a mix of nearby amenities.

What does this home offer?

Building type icon
Building type icon

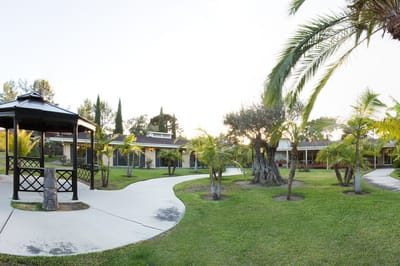
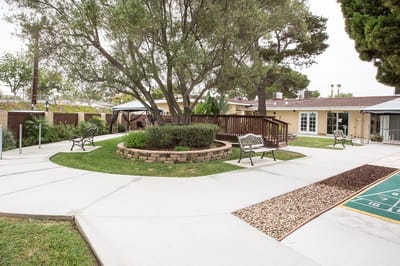
Building Type: Single-story

Dining services icon

Dining Services

Beauty services icon

Beauty Services

Transportation services icon

Transportation Services

Social and recreational activities icon

Social and Recreational Activities

Rehabilitative support icon

Rehabilitative Support

On-site medical care and health services icon

On-site Medical Care and Health Services

Types of Care at La Paloma Healthcare Center

Nursing Home

Contact La Paloma Healthcare Center

Health Inspection History

Inspections Since 2019
Total health inspections 7

California average 12.5


Last Health inspection on Apr 2025

Total health citations
32 Rank #101 / 279Health citations — State benchmarkedThis home is ranked 101st out of 279 homes in California.Shows this facility's total health deficiency citations benchmarked to the California State average, with a ranking across all 279 CA SNFs. Lower citation counts earn a better rank.Click the rank badge to see the full State ranking.Click here to see the full State ranking.

California average 50.2

Citations per inspection
4.57 Rank #168 / 279Citations per inspection — State benchmarkedThis home is ranked 168th out of 279 homes in California.Shows average deficiency citations per CMS inspection for this facility versus the California mean across 279 SNFs with citation data. Lower is better.Click the rank badge to see the full State ranking.Click here to see the full State ranking.

California average 4.65


Health citations are formal notices following inspections when they fail to comply with safety and care standards.

28 of 32 citations resulted from standard inspections; and 4 of 32 resulted from complaint investigations.

Breakdown of citation severity (last 7 years)
Critical Health citations
0
100% better than California average

California average: 0.4


Serious Health citations
1 Rank #1 / 121Serious citations (G–I) — State benchmarkedThis home is ranked 1st out of 121 homes in California.Shows G–I scope serious health citations for this facility versus other California SNFs. Lower counts rank better.Click the rank badge to see the full State ranking.Click here to see the full State ranking.
In line with California average

California average: 1

0 critical citations California average: 0.4

1 serious citation California average: 1

31 moderate citations California average: 47.2

0 minor citations California average: 1.5
Citations history (last 7 years)
Infection Control moderate citation Apr 17, 2025
Corrected

Pharmacy moderate citation Apr 17, 2025
Corrected

Quality of Care moderate citation Apr 17, 2025
Corrected

Care Planning moderate citation Apr 17, 2025
Corrected

Financial Assistance for
Nursing Home in California

La Paloma Healthcare Center is located in Oceanside, California.
Here are the financial assistance programs available to residents in California.

Get Financial aid guidance

Multipurpose Senior Services Program

MSSP (Medi-Cal Waiver)

Age 65+
General California resident, Medi-Cal eligible, nursing home risk.
Income Limits (2025) ~$2,829/month 300% FBR, individual
Asset Limits $2,000 (individual), $3,000 (couple).
CA

County-managed; waitlists possible.

Benefits
In-home support (4-6 hours/day) Respite care (14 days/year) Meals (~$6/meal) Transportation (8 trips/month) Care management

In-Home Supportive Services (IHSS)

California IHSS

Age 65+
General California resident, Medicaid-eligible or low-income.
Income Limits ~$1,732/month individual, Medi-Cal threshold
Asset Limits $2,000 individual
CA

Can hire family as caregivers.

Benefits
Personal care (up to 283 hours/month) Homemaker services Respite (varies)

Multipurpose Senior Services Program (MSSP)

CA MSSP

Age 65+
General California resident, Medi-Cal-eligible, nursing home-eligible but community-capable.
Income Limits ~$2,829/month 300% FBR, individual
Asset Limits $2,000 individual
CA

Available in 38 counties; waitlists common.

Benefits
Case management Respite care (up to 10 days/year) Minor home mods (avg. $500) Adult day care (~$50/day)

Property Tax Postponement Program (PTP)

CA PTP

Age 62+
General California resident, own and live in home, 40% equity.
Income Limits (2025) ~$51,500/year household, adjusted annually
Asset Limits Equity-based; no strict asset cap.
CA

Deferred taxes accrue interest (5% as of 2024); repaid upon sale/death.

Benefits
Property tax deferral (avg. $1,000-$3,000/year, varies by county)

Assisted Living Waiver (ALW)

CA ALW

Age 65+ or disabled
General California resident, Medi-Cal-eligible, nursing home-eligible.
Income Limits ~$2,829/month 300% FBR, individual
Asset Limits $2,000 individual
CA

Available in 15 counties (e.g., LA, Sacramento); waitlists common.

Benefits
Personal care in ALFs (5-7 hours/day) Medication management Social services

California CARES Program

CA CARES

Age
General Caregivers of California residents 60+ needing help with 3+ daily activities; no caregiver age limit.
Income Limits No strict limit; cost-sharing above ~$2,500/month threshold.
Asset Limits Not applicable; need-based.
CA

High demand in urban areas; complements IHSS respite.

Benefits
Respite care (up to 10 days/year) Counseling (4-6 sessions/year) Training (2-3 workshops/year) Supplies (~$200/year)

Places of interest near La Paloma Healthcare Center

Address 6.9 miles from city center Info Estimated distance in miles from Oceanside's city center to La Paloma Healthcare Center's address, calculated via Google Maps.

Calculate Travel Distance to La Paloma Healthcare Center

Add your location

Address

Staffing Data

Reporting period: April 1 – June 30, 2025 (Q2 2025). Source: CMS Payroll-Based Journal report.

Total staff 273
Employees 138
Contractors 135
Staff to resident ratio 3.00:1
2999900% better than California average
California average ratio: 0.00:1 California average ratio: 0.00:1See full California ranking
Avg staff/day 60
Average shift 7.6 hours
0% compared with California average
California average: 7.7 hours California average shift: 7.7 hoursSee full California ranking
Total staff hours (quarter) 41,294

Nursing staff breakdown

Q2 2025 · Apr 1 – Jun 30 More info This data comes from the CMS Payroll-Based Journal report covering April 1 – June 30, 2025.
Registered Nurse

Manages medical care and health needs.

Total count 8
Average shift length Info Average shift length. Calculated as total hours divided by days worked and average staff per day. 7.1 hours

No contractors work on this role.

Licensed Practical Nurse

Assists with medical care and medications.

Total count 46
Average shift length Info Average shift length. Calculated as total hours divided by days worked and average staff per day. 7.6 hours

This role is partially covered by contractors.

Certified Nursing Assistant

Helps with daily care and mobility.

Total count 182
Average shift length Info Average shift length. Calculated as total hours divided by days worked and average staff per day. 7.7 hours

This role is partially covered by contractors.

Contractor staffing

Q2 2025 · Apr 1 – Jun 30 More info This data comes from the CMS Payroll-Based Journal report covering April 1 – June 30, 2025.

Total hours from contractors

5%

2,061 contractor hours this quarter

Certified Nursing Assistant: 116 Licensed Practical Nurse: 19

Staff by category

Q2 2025 · Apr 1 – Jun 30 More info This data comes from the CMS Payroll-Based Journal report covering April 1 – June 30, 2025.
Certified Nursing Assistant 66 116 182 20,257 91 100% 7.7
Licensed Practical Nurse 27 19 46 8,733 91 100% 7.6
Speech Language Pathologist 6 0 6 1,665 80 88% 7.2
Registered Nurse 8 0 8 1,528 91 100% 7.1
Physical Therapy Assistant 6 0 6 1,518 70 77% 7.4
Respiratory Therapy Technician 5 0 5 1,416 75 82% 7.4
Physical Therapy Aide 5 0 5 1,219 66 73% 7.2
Other Dietary Services Staff 3 0 3 1,065 91 100% 7
Clinical Nurse Specialist 1 0 1 579 75 82% 7.7
RN Director of Nursing 2 0 2 560 65 71% 8
Dental Services Staff 2 0 2 518 64 70% 7.7
Administrator 1 0 1 512 64 70% 8
Nurse Practitioner 2 0 2 504 63 69% 8
Dietitian 1 0 1 470 60 66% 7.8
Qualified Social Worker 1 0 1 280 57 63% 4.9
Occupational Therapy Aide 1 0 1 251 50 55% 5
Qualified Activities Professional 1 0 1 220 37 41% 5.9
182 Certified Nursing Assistant
% of Days 100%
46 Licensed Practical Nurse
% of Days 100%
6 Speech Language Pathologist
% of Days 88%
8 Registered Nurse
% of Days 100%
6 Physical Therapy Assistant
% of Days 77%
5 Respiratory Therapy Technician
% of Days 82%
5 Physical Therapy Aide
% of Days 73%
3 Other Dietary Services Staff
% of Days 100%
1 Clinical Nurse Specialist
% of Days 82%
2 RN Director of Nursing
% of Days 71%
2 Dental Services Staff
% of Days 70%
1 Administrator
% of Days 70%
2 Nurse Practitioner
% of Days 69%
1 Dietitian
% of Days 66%
1 Qualified Social Worker
% of Days 63%
1 Occupational Therapy Aide
% of Days 55%
1 Qualified Activities Professional
% of Days 41%

Facility Characteristics

Source: CMS Long-Term Care Facility Characteristics (Data as of Jan 2026)

Total residents 91
Medicare
21
23.1% of residents
Medicaid
50
54.9% of residents
Private pay or other
20
22% of residents
Programs & Services
Residents Group

Residents meet regularly to discuss policies, care quality, and activities

Active Resident Council

Organized group of residents that meets regularly to discuss facility policies, quality of life, and activities.

Quality of care over time

These measures show how residents usually do over time at this home, based on health outcomes and preventive care.

High-risk clinical events score Info A composite score based on pressure ulcers, falls with injury, weight loss, walking ability decline, and activities of daily living decline. 4.9
26% better than California average

California average: 6.6

Functional decline score Info A composite score based on activities of daily living decline, walking ability decline, and incontinence. 6.2
46% better than California average

California average: 11.3

Long-stay resident measures
Significantly above average Info CMS star rating based on long-stay quality measure performance. 5 stars = significantly above average, 1 star = significantly below average.
Need for Help with Daily Activities Increased Info Percent of long-stay residents whose need for help with daily activities has increased 5.6%
49% better than California average

California average: 11.1%

Walking Ability Worsened Info Percent of long-stay residents whose ability to move independently worsened 10.0%
16% better than California average

California average: 12.0%

Low Risk Residents with Bowel/Bladder Incontinence Info Percent of low risk long-stay residents who lose control of their bowels or bladder 2.9%
75% better than California average

California average: 11.3%

Falls with Major Injury Info Percent of long-stay residents experiencing one or more falls with major injury 0.5%
72% better than California average

California average: 1.7%

High Risk Residents with Pressure Ulcers Info Percent of long-stay high risk residents with pressure ulcers 5.7%
15% worse than California average

California average: 5.0%

Urinary Tract Infection Info Percent of long-stay residents with a urinary tract infection 0.0%
100% better than California average

California average: 1.2%

Lost Too Much Weight Info Percent of long-stay residents who lose too much weight 2.6%
39% better than California average

California average: 4.2%

Depressive Symptoms Info Percent of long-stay residents who have depressive symptoms 6.4%
In line with California average

California average: 6.7%

Antipsychotic Use Info Percent of long-stay residents who received an antipsychotic medication 7.0%
31% better than California average

California average: 10.1%

Pneumococcal Vaccine Info Percent of long-stay residents assessed and appropriately given the pneumococcal vaccine 96.7%
In line with California average

California average: 98.5%

Influenza Vaccine Info Percent of long-stay residents assessed and appropriately given the seasonal influenza vaccine 82.5%
16% worse than California average

California average: 98.2%

Hospitalizations per 1,000 days Info Number of hospitalizations per 1,000 long-stay resident days. 1.51
33% better than California average

California average: 2.25

ED visits per 1,000 days Info Number of outpatient emergency department visits per 1,000 long-stay resident days. 1.16
27% better than California average

California average: 1.59

Short-stay resident measures
Significantly above average Info CMS star rating based on short-stay quality measure performance. 5 stars = much above average, 1 star = much below average.
Pneumococcal Vaccine Info Percent of short-stay residents assessed and appropriately given the pneumococcal vaccine 87.2%
7% worse than California average

California average: 94.0%

Antipsychotic medication increase Info Percent of short-stay residents who newly received an antipsychotic medication 1.0%
34% better than California average

California average: 1.5%

Influenza Vaccine Info Percent of short-stay residents assessed and appropriately given the seasonal influenza vaccine 91.7%
In line with California average

California average: 93.2%

Re-hospitalized after SNF stay Info Percentage of short-stay residents who were re-hospitalized after their nursing home admission. 23.6%
In line with California average

California average: 23.2%

Emergency department visits Info Percentage of short-stay residents who had an outpatient emergency department visit. 13.4%
20% worse than California average

California average: 11.2%

Falls with major injury Info Percentage of SNF residents who experience falls with major injury during their stay. 0.0%
100% better than California average

California average: 0.8%

Ability to care for self at discharge Info Percentage of residents at or above expected ability to care for themselves at discharge. 71.4%
33% better than California average

California average: 53.7%

Successful return to home or community Info Rate of successful return to home or community from a skilled nursing facility. 60.4%
19% better than California average

California average: 50.6%

Penalties and fines

Federal penalties imposed by CMS for regulatory violations, including civil money penalties (fines) and denials of payment for new Medicare/Medicaid admissions.

Source: CMS Penalties Database

No penalties in the past 3 years

No civil money penalties or payment denials were reported in the last 3 years.

Guides for Better Senior Living

Care Cost Calculator: See Prices in Your Area

Nursing Home Data Explorer

Don’t Wait Too Long: 7 Red Flag Signs Your Parent Needs Assisted Living Now

The True Cost of Assisted Living in 2025 – And How Families Are Paying For It

Understanding Senior Living Costs: Pricing Models, Discounts & Financial Assistance

Frequently Asked Questions about La Paloma Healthcare Center

What neighborhood is La Paloma Healthcare Center in?

La Paloma Healthcare Center is in the Tri-City neighborhood.

Is La Paloma Healthcare Center in a walkable area?

La Paloma Healthcare Center has a walk score of 59. Moderately walkable. Some errands can be accomplished on foot, with a mix of nearby amenities.

What is the occupancy rate at La Paloma Healthcare Center?

La Paloma Healthcare Center's occupancy is 91.9%.

What is the address of La Paloma Healthcare Center?

La Paloma Healthcare Center is located at 3232 Thunder Dr, Oceanside, CA 92056.

What is the phone number of La Paloma Healthcare Center?

(760) 724-2193 will put you in contact with the team at La Paloma Healthcare Center.

Is La Paloma Healthcare Center Medicare or Medicaid certified?

Yes — La Paloma Healthcare Center is a CMS-certified provider of Medicare and Medicaid.

Explore Open Rooms
1 Contact details
2 What type of senior care service are you looking for?
3 What budget do you have in mind for senior care?
4 How soon do you need to find care?
5 Additional details

Thank you for your interest!

Our team will be in touch shortly to help with next steps.