Explore Open Rooms

1 Contact details
2 What type of senior care service are you looking for?
3 What budget do you have in mind for senior care?
4 How soon do you need to find care?
5 Additional details

Thank you for your interest!

Our team will be in touch shortly to help with next steps.

Nursing Home

La Villa Grande Care Center

Nursing Home

La Villa Grande Care Center

2501 Little Bookcliff Dr, Grand Junction, CO 81501 View map
Overview of La Villa Grande Care Center

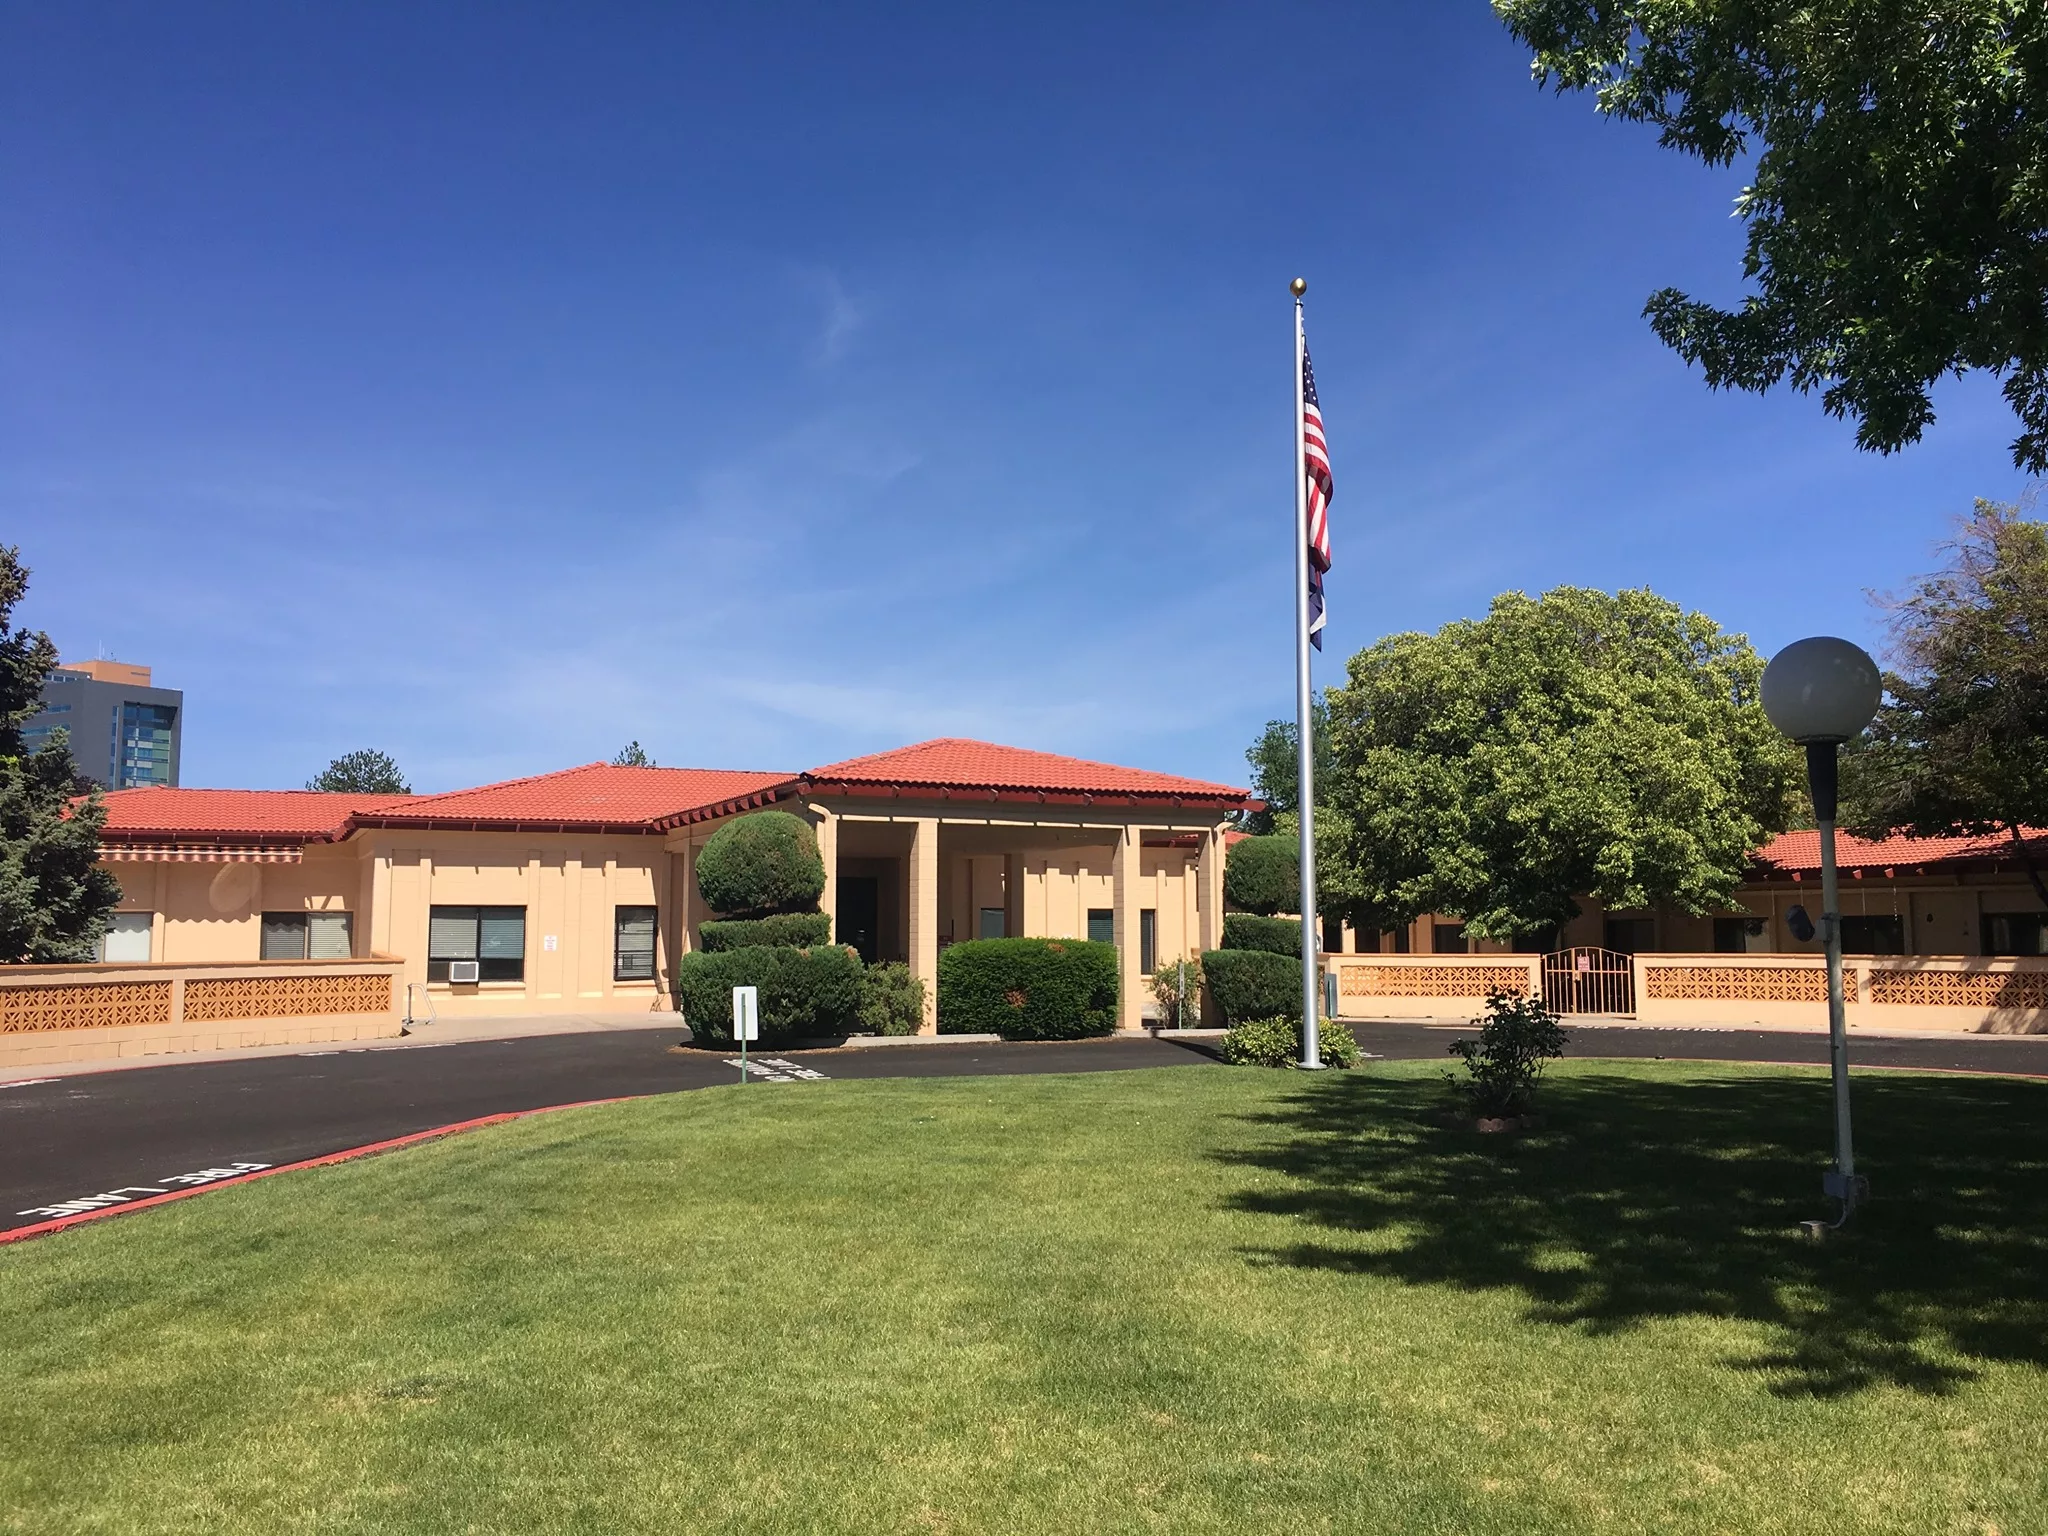
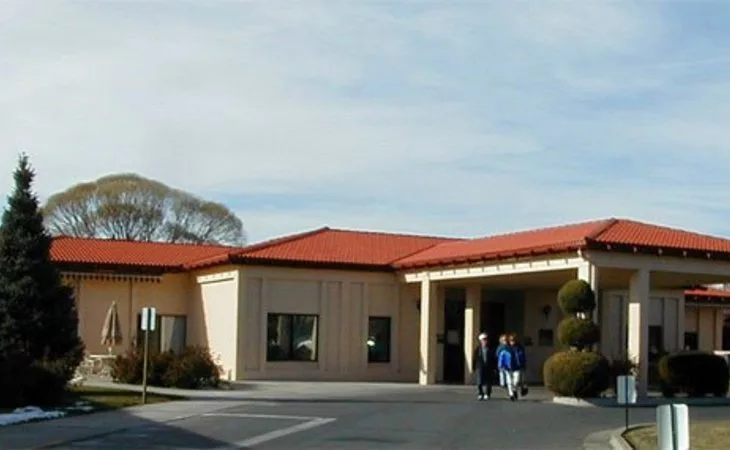
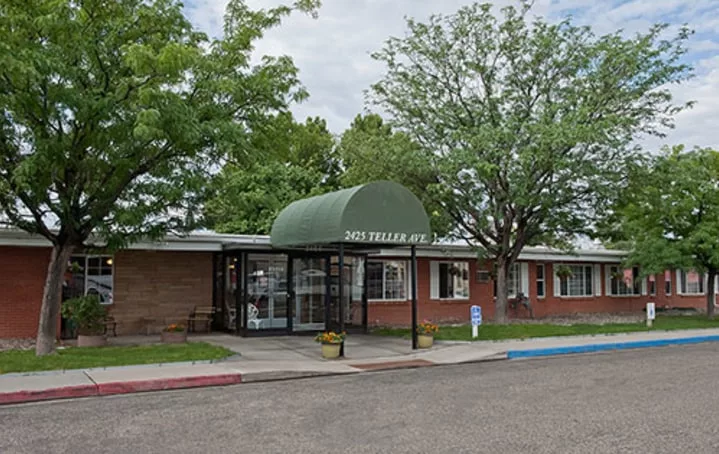
La Villa Grande Care Center, set in Grand Junction, Colorado, is a beautiful community that caters to seniors with an array of offerings, including skilled nursing rehabilitation, short-term stays, and memory care. They honor veterans and welcome seniors from different walks of life, fostering a warm and inclusive environment. One of the community’s strengths lies in its bustling social calendar, ensuring residents are always engaged in enriching activities.
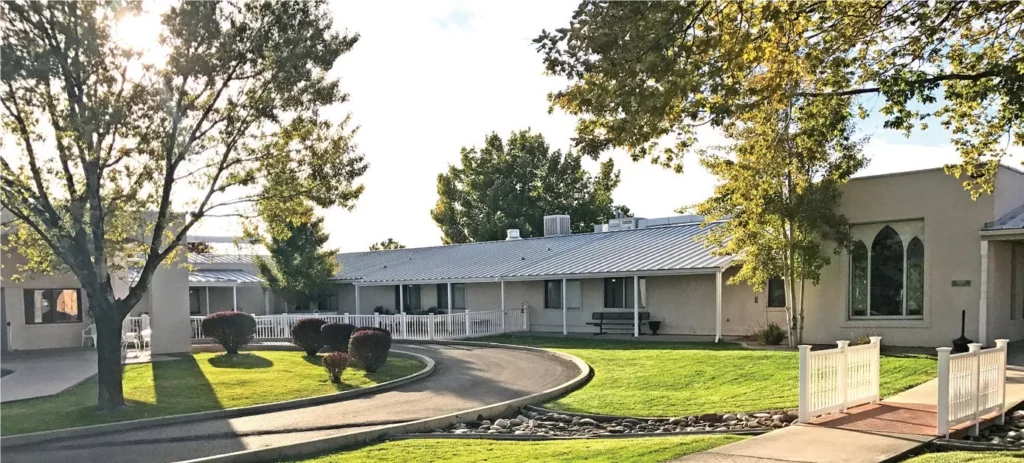
As an award-winning community, the home takes care of every detail, from daily housekeeping to leading services, offering the convenience of community Wi-Fi and individually controlled settings. Pet-friendly and accommodating, seniors are encouraged to personalize their spaces. Each room is equipped with a call light system for safety and peace of mind. Additionally, the community features amenities like a beauty and barber salon, a charming courtyard adorned with lush landscaping and fountains, and a library and computer room. With a supportive culture at its core, La Villa Grande serves as a haven of comfort, care, and engaging activities tailored to enrich the lives of its residents.

(970) 245-1211

Quality ratings

Measured by Centers for Medicare & Medicaid Services (CMS)

Overall rating Info The Overall CMS Rating combines results from health inspections, staffing levels and quality measures. Health inspections carry the most weight. Staffing and quality scores can increase or decrease the final rating based on performance compared to state and national standards.
2/5
Colorado average: 3.2/5
Health Inspection Info Based on the results of the facility's three most recent standard inspections and any complaint investigations. CMS reviews the number, scope, and severity of deficiencies, with more recent findings weighted more heavily.
2/5
Colorado average: 2.8/5
Staffing Info Measures average nursing staff hours per resident per day, including Registered Nurses (RNs) and total nursing staff. Ratings are adjusted based on the level of care residents require and are compared to state and national benchmarks.
4/5
Colorado average: 3.1/5
Quality Measures Info Based on clinical and physical health indicators reported to CMS, such as hospital readmissions, falls, pressure ulcers, and improvements in mobility. These measures reflect how well residents' health needs are being managed.
4/5
Colorado average: 4.1/5

Nursing care per resident

Info This shows how many total hours of nursing staff time are available per resident each day. Higher numbers usually mean more staff support.
3h 42m per day

This home provides 4% less nursing time per resident than the Colorado average.

Colorado average: 3h 51m per day

Capacity and availability

Smaller home

May offer a more intimate, personalized care environment.

Total beds 96

This home usually has limited availability

Occupancy is moderate, suggesting balanced demand.

Similar demand to the Colorado average
Occupancy rate 88.9%
Residents per day (avg) 84
Occupancy rate
88.9%
Residents per day (avg)
84

Who this home usually serves

TYPE OF STAY

Primarily short stays

Residents typically stay for brief periods, with frequent admissions and discharges throughout the year.

Might be optimal for
Post-acute recovery Temporary care Transitional stays

Breakdown by payment type

Medicare

32% of new residents, usually for short-term rehab.

Typical stay 1 - 2 months

Private pay

61% of new residents, often for short stays.

Typical stay 4 - 5 months

Medicaid

7% of new residents, often for long-term daily care.

Typical stay 5 years

Finances and operations

Privately-owned community
Home revenue
$11.6M
Profit
$479.9K
Privately-owned community
Home revenue
$11,646,408.00
Profit
$479,878.00
Payroll costs Info The portion of the home's budget spent on staff, including nurses, caregivers, and other employees who support care and operations.
$5.3M
45.2% of revenue
Other operating costs Info All remaining costs needed to run the home, such as food, utilities, building maintenance, supplies and administrative expenses.
$5.9M
Total costs $11.2M
Bed community size
96-bed community
A larger shared setting that may offer more common spaces and organized community services.
Walk Score
Walk Score: 60 / 100
Moderately walkable. Some errands can be accomplished on foot, with a mix of nearby amenities.

About this community

License details

Status Active

Ownership & operating entity

La Villa Grande Care Center is administrated by Estrada, John.

Owner: SNH CO TENANT LLC
Contact La Villa Grande Care Center

Access & Eligibility

Ways to qualify for care at this community, including accepted programs and payment options.

Medicaid Accepted

This facility is certified for eligible Medicaid services.

Medicare Accepted

This facility is certified for eligible Medicare services.

Payment & Funding Options

Private pay Medicaid Medicare

Inspection History

In Colorado, the Department of Public Health and Environment, Health Facilities Division is the regulatory body that performs unannounced surveys and publishes facility inspection findings.

Health Inspection History

Inspections
Total health inspections 7

Colorado average 4.8


Last Health inspection on May 2025

Total health citations 35

Colorado average 24.8

Citations per inspection
5

Colorado average 5.2


Health citations are formal notices following inspections when they fail to comply with safety and care standards.

29 of 35 citations resulted from standard inspections; and 5 of 35 resulted from complaint investigations.

Breakdown of citation severity (last 3 years)
Critical Health citations More info 0
100% better than Colorado average

Colorado average: 0.4


Serious Health citations More info 4
90% worse than Colorado average

Colorado average: 2.1

0 critical citations More info Colorado average: 0.4

4 serious citations More info Colorado average: 2.1

31 moderate citations More info Colorado average: 22.2

0 minor citations More info Colorado average: 0.2
Citations history (last 3 years)
Abuse/Neglect moderate citation Info Issues related to protecting resident's from harm, including abuse, neglect, or mistreatment. May 22, 2025
Corrected

Abuse/Neglect moderate citation Info Issues related to protecting resident's from harm, including abuse, neglect, or mistreatment. May 22, 2025
Corrected

Infection Control moderate citation Info Issues related to preventing and controlling infections, including hygiene practices and safety protocols. May 22, 2025
Corrected

Nutrition moderate citation Info Issues related to food quality, meal service, and resident's nutritional needs. May 22, 2025
Corrected

Compare Nursing Homes around Grand Junction The information below is reported by the Colorado Department of Public Health and Environment, Health Facilities Division.

5 facilities compared · CMS & CO Dept. of Health data · Updated Mar 2026

Center At Foresight Llc
NH

Nursing Home Licensed facility providing 24/7 skilled nursing care for residents with complex, ongoing medical needs. Staffed by RNs, LPNs, and CNAs. Inspected and star-rated annually by CMS. Accepts Medicare (short-term rehab) and Medicaid (long-term care).

AL

Assisted Living A licensed, long-term care setting for seniors or individuals with disabilities who need help with daily activities — like bathing, dressing, and medication management — but not 24-hour skilled nursing. Offers housing, meals, and around-the-clock support while aiming to maximize resident independence.

Grand Junction
54
85.4%
+12%
4.51
+41%
+17%
0
6
1
46
-
49
-
$15,3M
$4,2M
27.1%
65425
La Villa Grande Care Center
NH

Nursing Home Licensed facility providing 24/7 skilled nursing care for residents with complex, ongoing medical needs. Staffed by RNs, LPNs, and CNAs. Inspected and star-rated annually by CMS. Accepts Medicare (short-term rehab) and Medicaid (long-term care).

AL

Assisted Living A licensed, long-term care setting for seniors or individuals with disabilities who need help with daily activities — like bathing, dressing, and medication management — but not 24-hour skilled nursing. Offers housing, meals, and around-the-clock support while aiming to maximize resident independence.

Grand Junction
96
88.9%
+16%
3.70
-2%
-4%
7
35
4
84
-
60
Stellar La Villa Grande Management Llc
$11,6M
$5,3M
45.2%
65253
Larchwood Inns
NH

Nursing Home Licensed facility providing 24/7 skilled nursing care for residents with complex, ongoing medical needs. Staffed by RNs, LPNs, and CNAs. Inspected and star-rated annually by CMS. Accepts Medicare (short-term rehab) and Medicaid (long-term care).

AL

Assisted Living A licensed, long-term care setting for seniors or individuals with disabilities who need help with daily activities — like bathing, dressing, and medication management — but not 24-hour skilled nursing. Offers housing, meals, and around-the-clock support while aiming to maximize resident independence.

Grand Junction
130
57.7%
-25%
4.34
0%
+12%
2
33
4
96
A+
54
Jiles, Jeanane
$12,0M
$5,3M
44.1%
65331
Eagle Ridge Post Acute
NH

Nursing Home Licensed facility providing 24/7 skilled nursing care for residents with complex, ongoing medical needs. Staffed by RNs, LPNs, and CNAs. Inspected and star-rated annually by CMS. Accepts Medicare (short-term rehab) and Medicaid (long-term care).

AL

Assisted Living A licensed, long-term care setting for seniors or individuals with disabilities who need help with daily activities — like bathing, dressing, and medication management — but not 24-hour skilled nursing. Offers housing, meals, and around-the-clock support while aiming to maximize resident independence.

Grand Junction
70
85.4%
+12%
3.36
-24%
-13%
1
43
2
64
-
69
-
$8,3M
$3,0M
36.4%
65286
Mantey Heights Rehabilitation & Care Center
NH

Nursing Home Licensed facility providing 24/7 skilled nursing care for residents with complex, ongoing medical needs. Staffed by RNs, LPNs, and CNAs. Inspected and star-rated annually by CMS. Accepts Medicare (short-term rehab) and Medicaid (long-term care).

AL

Assisted Living A licensed, long-term care setting for seniors or individuals with disabilities who need help with daily activities — like bathing, dressing, and medication management — but not 24-hour skilled nursing. Offers housing, meals, and around-the-clock support while aiming to maximize resident independence.

Grand Junction
88
72.6%
-5%
3.91
-26%
+1%
4
53
7
71
-
9
Stellar Mantey Heights Management Llc
$8,0M
$3,8M
47.1%
65307

Places of interest near La Villa Grande Care Center

Address 1.5 miles from city center — 0.19 miles to nearest hospital (General Surgeons of Western Colorado Building)
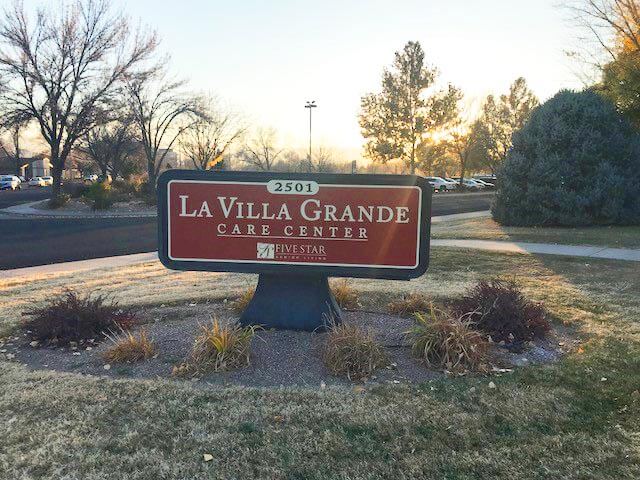
Address 2501 Little Bookcliff Dr, Grand Junction, CO 81501

Calculate Travel Distance to La Villa Grande Care Center

Add your location

Address

Staffing Data (Q2 2025)

This data corresponds to Q2 2025 and is based on CMS Payroll-Based Journal.

Total staff 121
Employees 106
Contractors 15
Staff to resident ratio 1.41:1
26% worse than Colorado average

Colorado average ratio: 1.91:1

Avg staff/day 41
Average shift 8.4 hours
0% compared with Colorado average

Colorado average: 8.3 hours

Total staff hours (quarter) 31,288
Nursing staff breakdown
Registered Nurse

Manages medical care and health needs.

Total count 16
Average shift length Info Average shift length. Calculated as total hours divided by days worked and average staff per day. 9.4 hours

This role is partially covered by contractors.

Licensed Practical Nurse

Assists with medical care and medications.

Total count 19
Average shift length Info Average shift length. Calculated as total hours divided by days worked and average staff per day. 9.8 hours

This role is partially covered by contractors.

Certified Nursing Assistant

Helps with daily care and mobility.

Total count 53
Average shift length Info Average shift length. Calculated as total hours divided by days worked and average staff per day. 8.8 hours

This role is partially covered by contractors.

Contractor staffing

Total hours from contractors

0.9%

276 contractor hours this quarter

Certified Nursing Assistant: 6 Licensed Practical Nurse: 5 Registered Nurse: 3 Medical Director: 1
Staff by category
Certified Nursing Assistant4765313,46991100%8.8
Licensed Practical Nurse145194,37591100%9.8
Registered Nurse133163,74891100%9.4
Other Dietary Services Staff6061,84591100%7.9
RN Director of Nursing4041,0797380%7.7
Administrator2021,0406571%8
Respiratory Therapy Technician2028776875%7.2
Dental Services Staff2028627279%7.4
Nurse Practitioner4048086673%7.9
Clinical Nurse Specialist3037446571%8
Occupational Therapy Aide3037366774%7.4
Medication Aide/Technician1015995662%10.7
Dietitian1014826976%7
Physical Therapy Aide1013426369%5.4
Qualified Social Worker1011415257%2.7
Speech Language Pathologist101781516%5.2
Physical Therapy Assistant1013267%5.3
Medical Director011313640%0.9
53 Certified Nursing Assistant
% of Days 100%
19 Licensed Practical Nurse
% of Days 100%
16 Registered Nurse
% of Days 100%
6 Other Dietary Services Staff
% of Days 100%
4 RN Director of Nursing
% of Days 80%
2 Administrator
% of Days 71%
2 Respiratory Therapy Technician
% of Days 75%
2 Dental Services Staff
% of Days 79%
4 Nurse Practitioner
% of Days 73%
3 Clinical Nurse Specialist
% of Days 71%
3 Occupational Therapy Aide
% of Days 74%
1 Medication Aide/Technician
% of Days 62%
1 Dietitian
% of Days 76%
1 Physical Therapy Aide
% of Days 69%
1 Qualified Social Worker
% of Days 57%
1 Speech Language Pathologist
% of Days 16%
1 Physical Therapy Assistant
% of Days 7%
1 Medical Director
% of Days 40%

Facility Characteristics

Source: CMS Long-Term Care Facility Characteristics (Data as of Jan 2026)

Total census
86 residents
Residents by payment source
Medicare
5 residents (5.8%)
Medicaid
58 residents (67.4%)
Private pay or other
23 residents (26.7%)
Programs & Services
Residents' Group

Residents meet regularly to discuss policies, care quality, and activities

Active Resident Council

Organized group of residents that meets regularly to discuss facility policies, quality of life, and activities.

Quality of care over time

These measures show how residents usually do over time at this home, based on health outcomes and preventive care.

High-risk clinical events score Info A composite score based on pressure ulcers, falls with injury, weight loss, walking ability decline, and activities of daily living decline. 13.5
50% worse than Colorado average

Colorado average: 9.0

Functional decline score Info A composite score based on activities of daily living decline, walking ability decline, and incontinence. 29.5
57% worse than Colorado average

Colorado average: 18.8

Long-stay resident measures
Above average Colorado avg: 3.8 Info CMS star rating based on long-stay quality measure performance. 5 stars = significantly above average, 1 star = significantly below average.
Need for Help with Daily Activities Increased Info Percent of long-stay residents whose need for help with daily activities has increased 25.7%
60% worse than Colorado average

Colorado average: 16.0%

Walking Ability Worsened Info Percent of long-stay residents whose ability to move independently worsened 28.5%
68% worse than Colorado average

Colorado average: 17.0%

Low Risk Residents with Bowel/Bladder Incontinence Info Percent of low risk long-stay residents who lose control of their bowels or bladder 34.4%
48% worse than Colorado average

Colorado average: 23.2%

Falls with Major Injury Info Percent of long-stay residents experiencing one or more falls with major injury 3.0%
10% better than Colorado average

Colorado average: 3.3%

High Risk Residents with Pressure Ulcers Info Percent of long-stay high risk residents with pressure ulcers 2.9%
26% better than Colorado average

Colorado average: 3.9%

Urinary Tract Infection Info Percent of long-stay residents with a urinary tract infection 1.7%
18% worse than Colorado average

Colorado average: 1.4%

Lost Too Much Weight Info Percent of long-stay residents who lose too much weight 7.6%
45% worse than Colorado average

Colorado average: 5.2%

Depressive Symptoms Info Percent of long-stay residents who have depressive symptoms 4.5%
38% better than Colorado average

Colorado average: 7.2%

Antipsychotic Use Info Percent of long-stay residents who received an antipsychotic medication 25.9%
38% worse than Colorado average

Colorado average: 18.8%

Pneumococcal Vaccine Info Percent of long-stay residents assessed and appropriately given the pneumococcal vaccine 98.0%
5% better than Colorado average

Colorado average: 93.3%

Influenza Vaccine Info Percent of long-stay residents assessed and appropriately given the seasonal influenza vaccine 98.8%
In line with Colorado average

Colorado average: 94.7%

Hospitalizations per 1,000 days Info Number of hospitalizations per 1,000 long-stay resident days. 0.87
33% better than Colorado average

Colorado average: 1.30

ED visits per 1,000 days Info Number of outpatient emergency department visits per 1,000 long-stay resident days. 1.34
20% better than Colorado average

Colorado average: 1.67

Short-stay resident measures
Significantly above average Colorado avg: 2.9 Info CMS star rating based on short-stay quality measure performance. 5 stars = much above average, 1 star = much below average.
Pneumococcal Vaccine Info Percent of short-stay residents assessed and appropriately given the pneumococcal vaccine 89.4%
17% better than Colorado average

Colorado average: 76.6%

Antipsychotic medication increase Info Percent of short-stay residents who newly received an antipsychotic medication 1.2%
15% better than Colorado average

Colorado average: 1.4%

Influenza Vaccine Info Percent of short-stay residents assessed and appropriately given the seasonal influenza vaccine 88.9%
18% better than Colorado average

Colorado average: 75.6%

Re-hospitalized after SNF stay Info Percentage of short-stay residents who were re-hospitalized after their nursing home admission. 11.1%
45% better than Colorado average

Colorado average: 20.3%

Emergency department visits Info Percentage of short-stay residents who had an outpatient emergency department visit. 13.3%
In line with Colorado average

Colorado average: 12.8%

Falls with major injury Info Percentage of SNF residents who experience falls with major injury during their stay. 2.2%
182% worse than Colorado average

Colorado average: 0.8%

Ability to care for self at discharge Info Percentage of residents at or above expected ability to care for themselves at discharge. 60.5%
13% better than Colorado average

Colorado average: 53.7%

Successful return to home or community Info Rate of successful return to home or community from a skilled nursing facility. 43.7%
14% worse than Colorado average

Colorado average: 50.6%

Penalties and fines

Federal penalties imposed by CMS for regulatory violations, including civil money penalties (fines) and denials of payment for new Medicare/Medicaid admissions.

Source: CMS Penalties Database (Data as of Jan 2026)

Total fines amount $74K
87% higher than Colorado average

Colorado average: $40K

Number of fines 7
215% more fines than Colorado average

Colorado average: 2.2

Payment Denials Info Serious action where Medicare and/or Medicaid temporarily stops payments for new residents until issues are fixed. 1
276% more payment denials than Colorado average

Colorado average: 0.3

Fines amount comparison
This facility $74K
Colorado average $40K
Penalty History

Penalties are imposed by CMS for violations of federal nursing home regulations.

Civil Money Penalty Info Fines imposed for noncompliance, which can be assessed per day or per instance of violation. Jan 2, 2024
$5K
Civil Money Penalty Info Fines imposed for noncompliance, which can be assessed per day or per instance of violation. Dec 11, 2023
$12K
Civil Money Penalty Info Fines imposed for noncompliance, which can be assessed per day or per instance of violation. Nov 16, 2023
$33K
Payment Denial Info Serious action where Medicare and/or Medicaid temporarily stops payments for new residents until issues are fixed. Nov 16, 2023
10 days

Last updated: Jan 2026

Guides for Better Senior Living

Care Cost Calculator: See Prices in Your Area

Nursing Home Data Explorer

Don’t Wait Too Long: 7 Red Flag Signs Your Parent Needs Assisted Living Now

The True Cost of Assisted Living in 2025 – And How Families Are Paying For It

Understanding Senior Living Costs: Pricing Models, Discounts & Financial Assistance

Financial Aid for Colorado Seniors

Get financial aid guidance

Elderly, Blind, and Disabled Waiver

Colorado Medicaid EBD Waiver

Age 65+ or disabled, Colorado resident, Medicaid- eligible, nursing home-level care need.

~$2,829/month (300% FBR, individual).

$2,000 (individual), $3,000 (couple).

Requires level-of-care assessment by case manager.

Old Age Pension (OAP) Health Care Program

Colorado OAP

Age 60+, Colorado resident.

~$1,215/month (individual).

$2,000 (individual).

Supplements SSI; limited medical coverage.

Program of All-Inclusive Care for the Elderly (PACE)

Colorado Medicaid PACE

Age 55+, Colorado resident, nursing home-level care need, safe with PACE support.

~$2,829/month (300% FBR).

$2,000 (individual), $3,000 (couple).

Limited to specific regions (e.g., Denver, Pueblo).

Home Care Allowance (HCA)

Colorado Home Care Allowance (HCA)

Seniors typically 65+, Age 5+ with disability, Colorado resident, financial/functional need.

~$1,004/month (individual, stricter than waivers).

$2,000 (individual), $3,000 (couple).

Must need help with ADLs; not Medicaid-waiver eligible.

Senior Community Service Employment Program (SCSEP)

Colorado SCSEP (federally funded, state-administered)

Age 55+, unemployed, low-income, Colorado resident.

~$1,983/month (125% FPL, individual).

Not specified; income-focused.

Priority for veterans, rural residents.

Tour Icon
Planning a tour? Check our touring checklist.
Chat Icon
Thinking of living here? We can help you speak to a current resident