Lakeshore Village Nursing and Rehab

Nursing Home

Lakeshore Village Nursing and Rehab

2320 Lake Shore Dr, Waco, TX 76708 View Map
Nursing Home
icon
Care Cost Calculator: See Prices in Your Area Care Cost Calculator: See Prices in Your Area icon
Overview of Lakeshore Village Nursing and Rehab

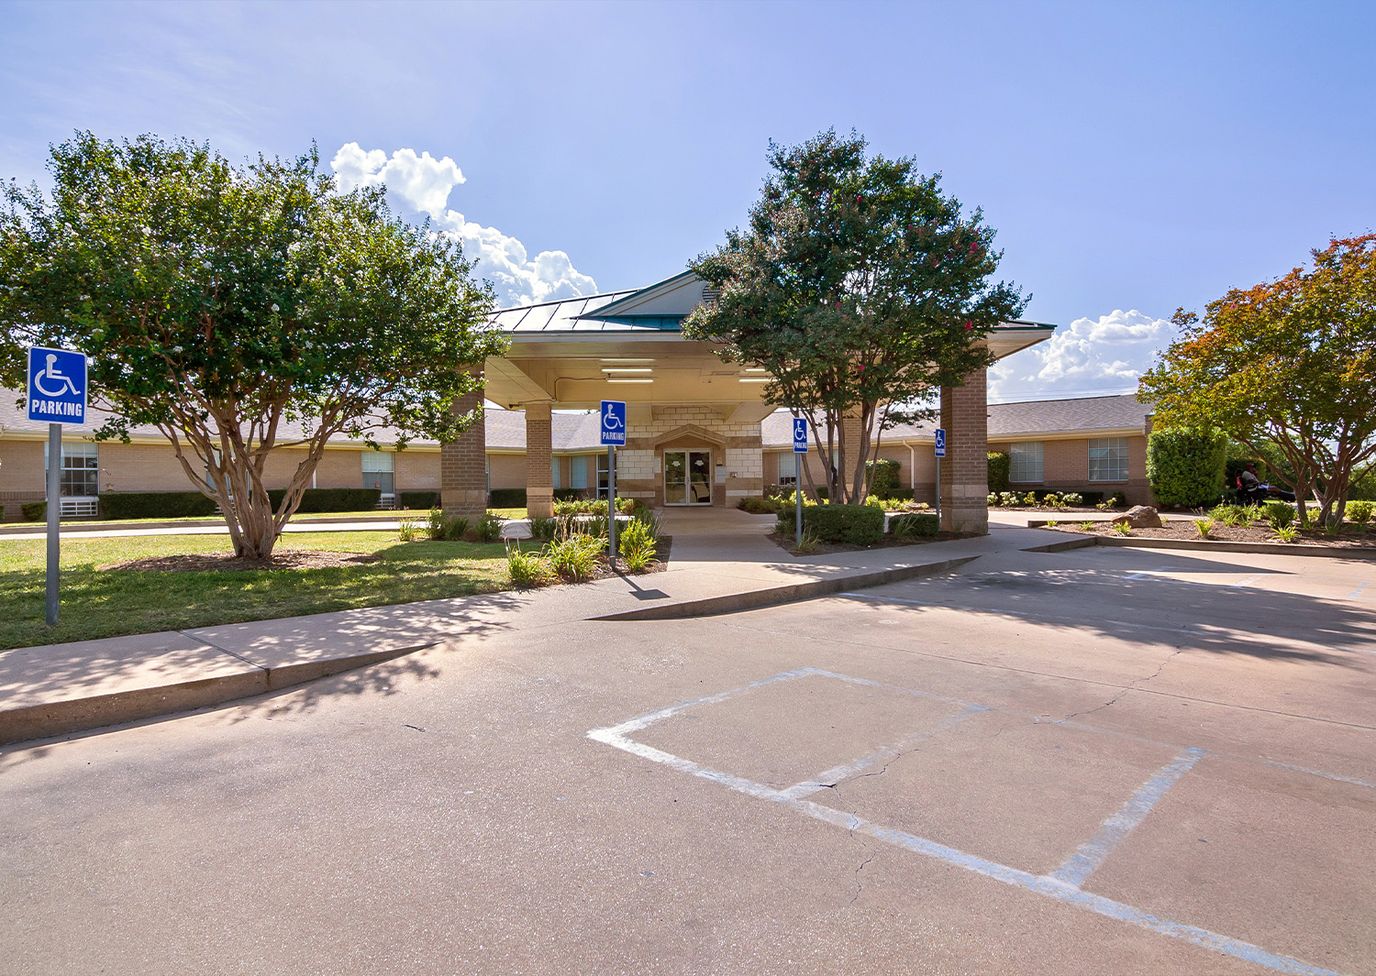
Lakeshore Village Nursing and Rehab, located in Waco, TX, is a trusted skilled nursing facility committed to providing exceptional care and rehabilitation services to its residents. The nursing home prioritizes individual wellness and places a special emphasis on rehabilitation, ensuring the best possible experience for its residents.

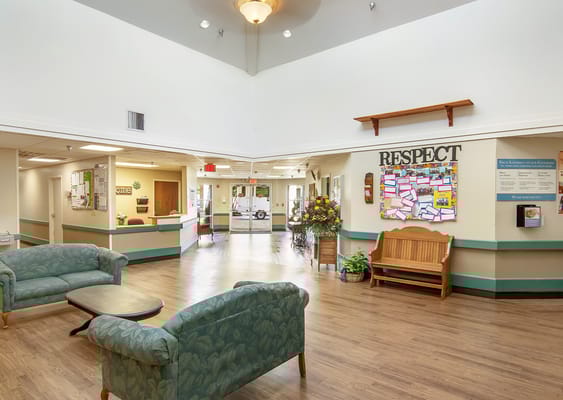
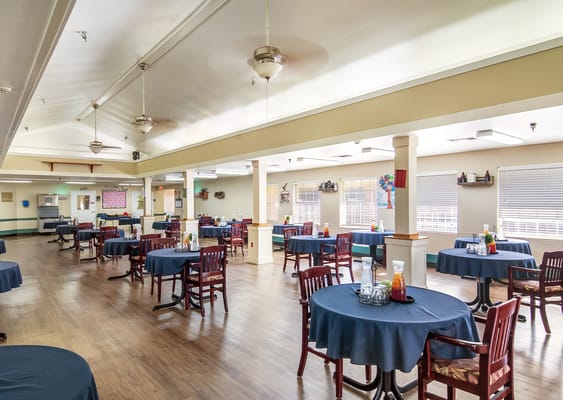
With a dedicated team of professionals, Lakeshore Village Nursing and Rehab delivers personalized and compassionate care, setting it apart from other facilities in the area. The skilled nursing staff, equipped with specialized training and a deep understanding of residents’ needs, provides comprehensive medical care, adept medication management, and tailor-made treatment plans. The nursing home’s mission is to treat every patient with the utmost care and respect, creating a warm and welcoming environment where residents can maintain their dignity and independence while receiving the care they need. Lakeshore Village Nursing and Rehab offers a seamless continuum of care, ensuring a smooth transition for residents and fostering consistency in their support.

(251) 459-5257

Managed by Travis Ward

Administrator

Travis Ward serves as the Administrator at Lakeshore Village Nursing and Rehab, where he leads a team dedicated to providing personalized care and therapy plans. Under his leadership, the community emphasizes a holistic approach to healing and recovery, ensuring residents are treated like family and kept safe during the COVID-19 pandemic.

Quality ratings

Measured by Centers for Medicare & Medicaid Services (CMS)

Overall rating Info Official CMS rating based on health inspections, staffing and quality measures.
1/5
Texas average: 2.8/5
Health Inspection Info Official CMS rating based on deficiencies found during state health inspections.
1/5
Texas average: 2.8/5
Staffing Info Official CMS rating based on nurse staffing hours per resident per day.
3/5
Texas average: 2.1/5
Quality Measures Info Official CMS rating based on clinical outcomes for residents.
2/5
Texas average: 3.8/5

Nursing care per resident

Info Average daily nursing hours per resident (adjusted for acuity). Higher values indicate more nursing time per resident.
3h 47m per day

This home provides 4% more nursing time per resident than the state average.

Texas average: 3h 38m per day

Staffing hours breakdown

Info Hours of care per resident per day, broken down by staff type. Data from CMS Medicare.
Staff type Facility State avg National avg
Registered Nurse (RN) Info Registered nurse hours per resident per day. 20m per day 26m per day 41m per day
LPN / LVN Info Licensed Practical Nurse / Licensed Vocational Nurse hours per resident per day. 1h 0m per day 57m per day 52m per day
Nurse Aide Info Nurse aide hours per resident per day. 2h 4m per day 2h 1m per day 2h 21m per day
Total Nursing (Weekend) Info Total number of nurse staff hours per resident per day on weekends. 2h 52m per day 2h 59m per day 3h 26m per day
Physical Therapist Info Physical therapist staff hours per resident per day. 6m per day 4m per day 4m per day
RN (Weekend) Info Registered nurse hours per resident per day on weekends. 14m per day 21m per day 29m per day

Capacity and availability

Medium-capacity home

Offers a balance of services and community atmosphere.

Total beds 151

This home usually has availability

Lower occupancy suggests more openings may be available.

Lower demand than the Texas average
Occupancy rate 81.9%
Residents per day (avg) 124
Occupancy rate
81.9%
Residents per day (avg)
124

Who this home usually serves

TYPE OF STAY

Mix of rehab and long-term care

This home supports both short-term rehab and long-term care, with residents staying for a wide range of durations.

Breakdown by payment type

Medicare

19% of new residents, usually for short-term rehab.

Typical stay 30 days

Private pay

51% of new residents, often for short stays.

Typical stay 1 - 2 months

Medicaid

29% of new residents, often for long-term daily care.

Typical stay 11 - 12 months

Finances and operations

Governmental home
Facility District
Home revenue
$15.4M
Surplus of revenue
$195.0K
Governmental home Facility District
Home revenue
$15,382,598.00
Surplus of revenue
$194,961.00
Payroll costs Info The portion of the home's budget spent on staff, including nurses, caregivers, and other employees who support care and operations.
$1
0% of revenue
Other operating costs Info All remaining costs needed to run the home, such as food, utilities, building maintenance, supplies and administrative expenses.
$15.4M
Total costs $15.4M
Bed community size
151-bed community
A large-scale community that may provide a wide range of amenities, services, and structured programs.
Years in operation
54 years in operation
A longer operating history, which may indicate experience navigating regulations and delivering ongoing care.
Walk Score
Walk Score: 38 / 100
Somewhat walkable. A few nearby services may be reachable on foot, but most trips require transportation.

Services

MEDICARE/MEDICAID

About this community

License Status
Active
Facility Type
Nursing
License Date
January 4, 2025
License Expiration
January 4, 2028

Additional licensing details

License number: 308583
Year opened: 9/1/1971
CMS Certification Number: 675438
County: MCLENNAN

Ownership & operating entity

Lakeshore Village Nursing and Rehab is administrated by TRAVIS WARD.

Management company: WACO NURSING AND REHAB CENTER LLC
Owner: FANNIN COUNTY HOSPITAL AUTHORITY
Ownership type: HOSPITAL DISTRICT/AUTHORITY

Type Of Units

Medicaid and Medicare
151 units
Total beds
151 units

Staffing

Key information about the people who lead and staff this community.

Leadership

Contact: Mr. Wynn Sims, Vice President

Care Services

Accepts Medicaid
Accepts Medicare
Nursing Services
Rehabilitation Services
Skilled Nursing
24-Hour Staffing

Amenities & Lifestyle

Skilled nursing services
rehabilitation therapy
long-term care
short-term care
personalized care plans
state-of-the-art amenities

Programs & Activities

Specific Programs
Skilled Nursing, Rehabilitation Therapy, Long & Short-Term Care
Operating Hours
Mo 00:00-23:59, Tu 00:00-23:59, We 00:00-23:59, Th 00:00-23:59, Fr 00:00-23:59, Sa 00:00-23:59, Su 00:00-23:59

Pricing & Financial Information

What does this home offer?

Building type icon
Building type icon

Building Type: Single-story

Fitness and recreation icon

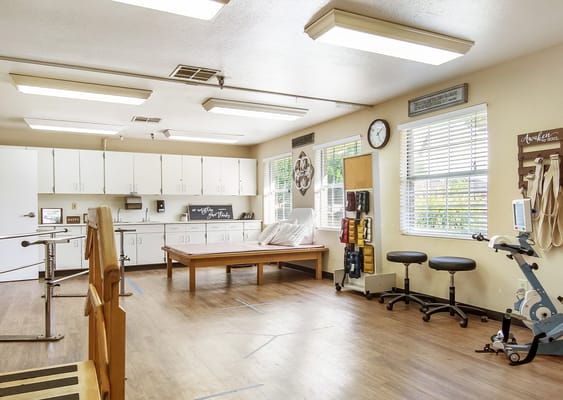
Fitness and Recreation

Types of Care at Lakeshore Village Nursing and Rehab

Skilled Nursing

Access & Eligibility

Ways to qualify for care at this community, including accepted programs and payment options.

Medicaid Accepted

This facility is certified for eligible Medicaid services.

Medicare Accepted

This facility is certified for eligible Medicare services.

Payment & Funding Options

Medicaid Medicare Long-term care insurance

Compare Nursing Homes around Waco

The information below is reported by the Texas Health and Human Services Commission.
Wesley Woods Rehabilitation and Healthcare
MC

Memory Care Specialized care for those with Memory Loss, Alzheimer's, or dementia, ensuring safety and support.

SNF

Nursing Homes 24/7 care needed

Waco (West Waco)
120
No
A+
39
-
83.4%
$10,795,855.00
$4,861,288.00
45%
112.00
2/5
3.8293
2/5
3/5
2/5
3
30
4
-15%
+5%
+31%
Quality Care of Waco
SNF

Nursing Homes 24/7 care needed

Waco (Dean Highland)
202
No
-
29
WACO OPCO LLC
22.1%
$3,616,022.00
$2,552,220.00
70.6%
63.10
1/5
3.2318
2/5
1/5
4/5
3
19
5
-23%
-11%
-65%
Jeffrey Place Healthcare Center
SNF

Nursing Homes 24/7 care needed

Waco (Richland Hills)
95
No
-
72
ALEXANDER, MACI
77.4%
$7,808,620.00
$2,851,786.00
36.5%
66.60
1/5
3.7760
2/5
1/5
3/5
1
39
2
-73%
+4%
+22%
Lakeshore Village Nursing and Rehab
SNF

Nursing Homes 24/7 care needed

Waco (Cedar Ridge)
151
No
-
38
WACO NURSING AND REHAB CENTER LLC
81.9%
$14,673,318.00
$1.00
0%
123.50
1/5
3.7875
1/5
3/5
2/5
3
49
8
-57%
+4%
+29%
Greenview Nursing and Rehab
SNF

Nursing Homes 24/7 care needed

Waco (Richland Hills)
128
No
-
55
RICHLAND NURSING AND REHAB CENTER LLC
69.9%
$10,055,839.00
$1.00
0%
90.70
1/5
3.2860
1/5
1/5
1/5
4
37
8
-40%
-10%
+10%

Places of interest near Lakeshore Village Nursing and Rehab

Address 4.1 miles from city center — 2.96 miles to nearest hospital (amily Counseling & Children's Services)

Address 2320 Lake Shore Dr, Waco, TX 76708

Calculate Travel Distance to Lakeshore Village Nursing and Rehab

Add your location

Address

Staffing Data

Source: CMS Payroll-Based Journal (Q2 2025)

218
Total Staff
152
Employees
66
Contractors
51,530
Total Hours (Quarter)
71
Avg Staff/Day
8
Avg Shift (hrs)
Nursing Staff Breakdown
Role Count Avg Shift (hrs) Uses Contractors?
Registered Nurse710 No
Licensed Practical Nurse638.4 Yes
Certified Nursing Assistant817.6 Yes
Staff by Category
Administration
2 staff
6.6hs shift avg
Nursing Staff
179 staff
8.1hs shift avg
Physicians & Practitioners
2 staff
8hs shift avg
Therapy Services
24 staff
7.9hs shift avg
Activities & Recreation
3 staff
7.4hs shift avg
Social Services
5 staff
7.7hs shift avg
Dietary Services
2 staff
7.2hs shift avg
Other Services
1 staff
8hs shift avg
Contractor Analysis
4.2%
of total hours from contractors
2,142 contractor hours this quarter
Certified Nursing Assistant: 7 Medication Aide/Technician: 7 Licensed Practical Nurse: 43 Respiratory Therapy Technician: 1 Medical Director: 1 Feeding Assistant: 2 Physical Therapy Assistant: 1 Occupational Therapy Aide: 3 Occupational Therapy Assistant: 1
Role Employees Contractors Total Staff Total Hours Days Worked % of Days Avg Shift (hrs)
Certified Nursing Assistant7478119,21791100%7.6
Licensed Practical Nurse2043639,42691100%8.4
Physical Therapy Aide100103,2817987%7.4
Medication Aide/Technician77143,21191100%11.3
Speech Language Pathologist6062,7557987%8.4
Qualified Social Worker5052,3396673%7.7
Registered Nurse7072,26391100%10
RN Director of Nursing4041,9256470%8
Respiratory Therapy Technician2139946673%8.5
Nurse Aide in Training8089736875%6.8
Therapeutic Recreation Specialist2027966976%7.6
Other Dietary Services Staff2027007380%7.2
Feeding Assistant0225206571%8
Administrator1015126470%8
Nurse Practitioner1015126470%8
Clinical Nurse Specialist1015126470%8
Mental Health Service Worker1015046369%8
Physical Therapy Assistant0114555662%8.1
Qualified Activities Professional1014326268%7
Medical Director011752527%3
Occupational Therapy Aide033751011%7.5
Occupational Therapy Assistant0115467%9

Health Inspection History

Inspections
Total health inspections 10

Texas average 7.4


Last Health inspection on May 2025

Total health citations 49
Citations per inspection
4.9

Health citations are formal notices following inspections when they fail to comply with safety and care standards.

16 of 49 citations resulted from standard inspections; 10 of 49 resulted from complaint investigations; and 23 of 49 came from combined inspections (standard and complaint).

Breakdown of citation severity (last 3 years)
Critical Health citations More info 7
250% worse than Texas average

Texas average: 2


Serious Health citations More info 1
150% worse than Texas average

Texas average: 0.4

7 critical citations More info Texas average: 2

1 serious citation More info Texas average: 0.4

41 moderate citations More info Texas average: 23

0 minor citations More info Texas average: 0.4
Citations history (last 3 years)
Quality of Care critical citation May 10, 2025
Corrected

Resident Rights critical citation May 10, 2025
Corrected

Nutrition moderate citation Feb 20, 2025
Corrected

Nutrition moderate citation Feb 20, 2025
Corrected

Facility Characteristics

Source: CMS Long-Term Care Facility Characteristics (Data as of Jan 2026)

Ownership: Hospital District
Part of: Fannin County Hospital Authority
Resident Census by Payment Source
123 Total Residents
Medicare 13 (10.6%)
Medicaid 77 (62.6%)
Private Pay/Other 33 (26.8%)
Programs & Services
Residents' Group
Family Engagement

Active councils help families stay involved in care decisions and facility operations.

Quality of care over time

These measures show how residents usually do over time at this home, based on health outcomes and preventive care.

High-risk clinical events score Info A composite score based on pressure ulcers, falls with injury, weight loss, walking ability decline, and activities of daily living decline. 6.8
21% better than Texas average

Texas average: 8.6

Functional decline score Info A composite score based on activities of daily living decline, walking ability decline, and incontinence. 11.6
28% better than Texas average

Texas average: 16.0

Long-stay resident measures
Need for Help with Daily Activities Increased Info Percent of long-stay residents whose need for help with daily activities has increased 14.0%
14% better than Texas average

Texas average: 16.2%

Walking Ability Worsened Info Percent of long-stay residents whose ability to move independently worsened 8.6%
47% better than Texas average

Texas average: 16.2%

Low Risk Residents with Bowel/Bladder Incontinence Info Percent of low risk long-stay residents who lose control of their bowels or bladder 12.1%
23% better than Texas average

Texas average: 15.7%

Falls with Major Injury Info Percent of long-stay residents experiencing one or more falls with major injury 3.1%
In line with Texas average

Texas average: 3.2%

High Risk Residents with Pressure Ulcers Info Percent of long-stay high risk residents with pressure ulcers 4.5%
In line with Texas average

Texas average: 4.4%

Urinary Tract Infection Info Percent of long-stay residents with a urinary tract infection 1.9%
142% worse than Texas average

Texas average: 0.8%

Lost Too Much Weight Info Percent of long-stay residents who lose too much weight 4.0%
14% worse than Texas average

Texas average: 3.5%

Depressive Symptoms Info Percent of long-stay residents who have depressive symptoms 5.9%
106% worse than Texas average

Texas average: 2.9%

Antipsychotic Use Info Percent of long-stay residents who received an antipsychotic medication 8.6%
9% worse than Texas average

Texas average: 7.9%

Pneumococcal Vaccine Info Percent of long-stay residents assessed and appropriately given the pneumococcal vaccine 100.0%
In line with Texas average

Texas average: 97.3%

Influenza Vaccine Info Percent of long-stay residents assessed and appropriately given the seasonal influenza vaccine 100.0%
In line with Texas average

Texas average: 97.9%

Hospitalizations per 1,000 days Info Number of hospitalizations per 1,000 long-stay resident days. 1.52
29% better than Texas average

Texas average: 2.13

ED visits per 1,000 days Info Number of outpatient emergency department visits per 1,000 long-stay resident days. 2.05
In line with Texas average

Texas average: 2.07

Short-stay resident measures
Pneumococcal Vaccine Info Percent of short-stay residents assessed and appropriately given the pneumococcal vaccine 93.3%
In line with Texas average

Texas average: 90.4%

Antipsychotic medication increase Info Percent of short-stay residents who newly received an antipsychotic medication 1.7%
17% worse than Texas average

Texas average: 1.4%

Influenza Vaccine Info Percent of short-stay residents assessed and appropriately given the seasonal influenza vaccine 89.0%
In line with Texas average

Texas average: 88.0%

Re-hospitalized after SNF stay Info Percentage of short-stay residents who were re-hospitalized after their nursing home admission. 21.7%
16% better than Texas average

Texas average: 25.9%

Emergency department visits Info Percentage of short-stay residents who had an outpatient emergency department visit. 16.1%
34% worse than Texas average

Texas average: 12.0%

Falls with major injury Info Percentage of SNF residents who experience falls with major injury during their stay. 0.0%
100% better than Texas average

Texas average: 0.8%

Ability to care for self at discharge Info Percentage of residents at or above expected ability to care for themselves at discharge. 42.4%
21% worse than Texas average

Texas average: 53.7%

Successful return to home or community Info Rate of successful return to home or community from a skilled nursing facility. 48.5%
In line with Texas average

Texas average: 50.6%

Penalties and fines

Federal penalties imposed by CMS for regulatory violations, including civil money penalties (fines) and denials of payment for new Medicare/Medicaid admissions.

Source: CMS Penalties Database (Data as of Jan 2026)

Total fines amount $136K
69% higher than Texas average

Texas average: $80K

Number of fines 3
21% more fines than Texas average

Texas average: 2.5

Payment Denials Info Serious action where Medicare and/or Medicaid temporarily stops payments for new residents until issues are fixed. 0
100% fewer payment denials than Texas average

Texas average: 0.2

Fines amount comparison
This facility $136K
Texas average $80K
Penalty History

Penalties are imposed by CMS for violations of federal nursing home regulations.

Civil Money Penalty Info Fines imposed for noncompliance, which can be assessed per day or per instance of violation. May 10, 2025
$23K
Civil Money Penalty Info Fines imposed for noncompliance, which can be assessed per day or per instance of violation. Dec 16, 2023
$84K
Civil Money Penalty Info Fines imposed for noncompliance, which can be assessed per day or per instance of violation. Jun 26, 2023
$29K

Last updated: Jan 2026

Guides for Better Senior Living

Care Cost Calculator: See Prices in Your Area

Nursing Home Data Explorer

Don’t Wait Too Long: 7 Red Flag Signs Your Parent Needs Assisted Living Now

The True Cost of Assisted Living in 2025 – And How Families Are Paying For It

Understanding Senior Living Costs: Pricing Models, Discounts & Financial Assistance

Financial Aid for Texas Seniors

Get financial aid guidance

Community Care for the Aged and Disabled (CCAD)

TX Medicaid CCAD

Age 65+ or disabled, Texas resident, Medicaid-eligible, care need (not always nursing home level).

~$2,829/month (300% FBR, individual).

$2,000 (individual), $3,000 (couple).

Large state; rural access challenges.

Texas Community Care Services

TX CCS

Age 60+, Texas resident, at risk of decline.

~$2,000/month (individual, varies).

$5,000 (individual).

Limited funding; high demand in urban areas.

Area Agency on Aging (AAA) Services

Texas AAA Services

Age 60+, TX resident; no income/asset limits.

None; donations encouraged.

Not assessed.

28 AAAs; includes Meals on Wheels in some areas.

Medicare Savings Program (MSP)

Texas Medicare Savings Program

Age 65+ or disabled, TX resident, Medicare Part A/B.

~$2,510/month (QMB), ~$3,380/month (SLMB), ~$3,598/month (QI)—individual.

$9,430 (individual), $14,130 (couple).

Includes Extra Help for Part D; no waitlist.

Low-Income Home Energy Assistance Program (LIHEAP)

Texas Comprehensive Energy Assistance Program (CEAP)

Age 60+ prioritized, TX resident, low-income.

~$3,970/month (185% FPL).

Not assessed.

Priority for elderly/disabled; covers gas, electric, propane.

Family Caregiver Support Program (FCSP)

Texas Family Caregiver Support Program

Caregivers of 60+ needing care or 55+ caregivers of others; TX resident; 2+ ADLs.

No strict cap; prioritizes low-income (~$24,980/year).

Not assessed.

High rural demand; includes grandparent caregivers.

Senior Community Service Employment Program (SCSEP)

Texas SCSEP

Age 55+, unemployed, low-income, TX resident.

~$1,983/month (125% FPL).

Not specified.

Priority for veterans, rural residents; AARP partnership.

VA Aid and Attendance (A&A) and Housebound Benefits

Texas VA Aid and Attendance/Housebound

Age 65+ or disabled veteran/spouse, TX resident, wartime service, ADL help (A&A) or homebound.

Net income < ~$1,984/month (veteran with dependent, A&A); pension offsets income.

~$155,356 (net worth).

High veteran population; supports rural/urban needs.

Property Tax Exemption for Seniors

Texas Senior Property Tax Exemption

Age 65+, TX resident, homeowner (homestead).

None; tax-based eligibility.

Not assessed.

$25,000+ exemption; optional freeze in some counties; saves ~$500-$1,000/year.

Senior Farmers’ Market Nutrition Program (SFMNP)

Texas SFMNP

Age 60+, TX resident, low-income.

~$2,322/month (185% FPL).

Not assessed.

Vouchers (~$50/season); serves ~20,000 via 28 AAAs.

Who we are

Your Senior Care Partner, Every Step of the Way

We help families find affordable senior communities and unlock same day discounts, Medicaid, and Medicare options tailored to your needs.

Contact us Today