• Home
  • Nursing Home in Florida
Lakeview Terrace Assisted Living Facility
Nursing Home, Assisted Living, Home Care, Independent Living, Memory Care & Skilled Nursing · Altoona, FL
CMS overall rating Info CMS (the Centers for Medicare & Medicaid Services) is the federal agency that rates nursing home quality. Its Overall Rating runs from 1 to 5 stars, combining health inspections, staffing, and quality measures, with inspections weighted most heavily.

Lakeview Terrace Assisted Living Facility

Nursing Home, Assisted Living, Home Care, Independent Living, Memory Care & Skilled Nursing · Altoona, FL
CMS overall rating Info CMS (the Centers for Medicare & Medicaid Services) is the federal agency that rates nursing home quality. Its Overall Rating runs from 1 to 5 stars, combining health inspections, staffing, and quality measures, with inspections weighted most heavily.
Calculator: See prices in your area
Lakeview Terrace Assisted Living Facility accepts Medicaid, Medicare, and private pay.

Overview of Lakeview Terrace Assisted Living Facility

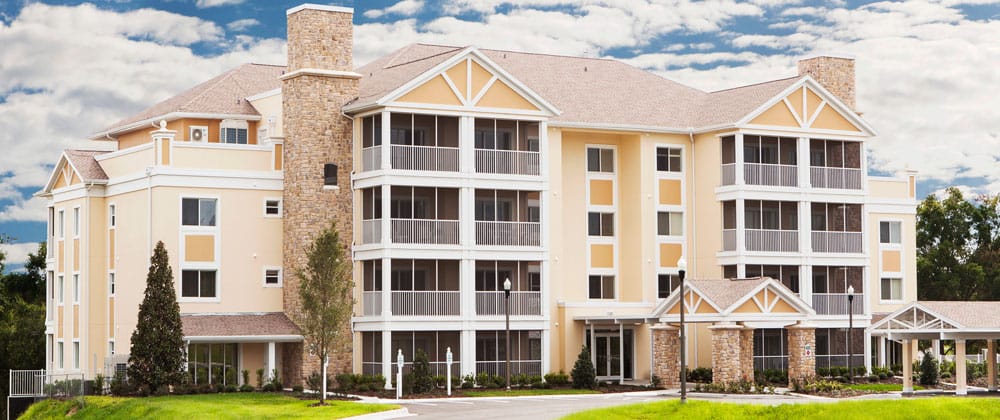
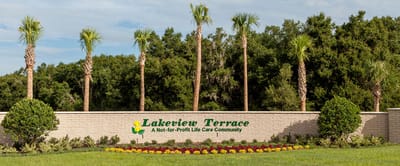
Located in Altoona, Florida, Lakeview Terrace Assisted Living Facility is a community operated by Community Supports, Inc under the ownership of DSI Management LLC. Medicaid, Medicare, and private pay are accepted, giving families several options for covering care costs. The 65-bed facility serves residents receiving short-term rehabilitation and those in longer-term care. The community’s occupancy rate is about 86%, and residents stay an average of 80 days.

The facility’s programs include short-term rehab, respite care, and rehabilitation services. Nurse staffing averages 7 hours and 11 minutes per resident each day. Registered nurses, nurse aides, licensed practical nurses, and nursing assistants provide that support, and the amount of daily hands-on care is best for residents recovering from an acute event and those managing ongoing health needs.

Dining focuses on choice and accommodation. The kitchen prepares made-to-order items such as omelets. Residents can also choose dishes including roast prime rib and baked salmon, along with healthier entrée options. Special dietary needs are accommodated. That’s important for residents managing medical restrictions or cultural food preferences.

The community is in a somewhat walkable area of Altoona. A few nearby services can be reached on foot, but most trips require a vehicle. The setting suits family members who visit regularly by car.

Inspections over the past decade identified recurring areas needing improvement, primarily involving staff training and resident care rights protocols. The facility showed a pattern of addressing cited deficiencies promptly. There’s a record of responsiveness to regulatory feedback. Families touring the community can ask how training and care protocols are managed and reinforced across the team.

Quality ratings

Measured by Centers for Medicare & Medicaid Services (CMS)

Overall rating Info The Overall CMS Rating combines results from health inspections, staffing levels and quality measures. Health inspections carry the most weight. Staffing and quality scores can increase or decrease the final rating based on performance compared to state and national standards.
Health Inspection Info Based on the results of the facility's three most recent standard inspections and any complaint investigations. CMS reviews the number, scope, and severity of deficiencies, with more recent findings weighted more heavily.
Staffing Info Measures average nursing staff hours per resident per day, including Registered Nurses (RNs) and total nursing staff. Ratings are adjusted based on the level of care residents require and are compared to state and national benchmarks.
Quality Measures Info Based on clinical and physical health indicators reported to CMS, such as hospital readmissions, falls, pressure ulcers, and improvements in mobility. These measures reflect how well residents' health needs are being managed.

Staffing hours breakdown

Info Daily nursing hours per resident by staff type, reported to CMS. Higher is generally better — compare this facility to state and national averages to see where staffing stands.

Hours per resident per day — compared to state averages

Total nursing care / resident Info Total adjusted nursing hours per resident per day, combining RN, LPN, and aide time. CMS adjusts this for case-mix so facilities can be fairly compared.
7h 11m per day
Rank #1 / 253Nurse hours — State benchmarkedThis home is ranked 1st out of 253 homes in Florida. Shows adjusted nurse hours per resident per day benchmarked to the Florida average, with a ranking across 253 Florida facilities. More hours mean more direct care. The national average is about 3.5 hrs; below 3.0 is a red flag.Rankings are based only on facilities in Florida that report data for that category. Facilities without available data are excluded from the ranking.Click the rank badge to see the full State ranking.Click here to see the full State ranking.
vs avg
Staff typeHours / Day / Residentvs state avg
Registered Nurse (RN) Info RNs hold the highest nursing license and can assess residents, interpret test results, and direct care plans. More RN hours per day often signals stronger clinical oversight and faster response to health changes. 40m per day
LPN / LVN Info Licensed Practical Nurses (LPNs) or Licensed Vocational Nurses (LVNs) deliver routine hands-on care — medication administration, wound dressing, and monitoring vital signs. They work under RN supervision and make up a large share of daily bedside care. 1h 56m per day
Nurse Aide Info Certified Nurse Aides (CNAs) provide the most direct day-to-day assistance: bathing, dressing, feeding, and mobility. Nurse aide hours are typically the largest staffing category and directly affect residents' quality of life. 4h 48m per day
Weekend Total Nursing Info Combined nursing hours (RN + LPN + Nurse Aide) per resident per day on weekends. Staffing often drops on weekends — this figure reveals whether the facility maintains adequate coverage outside of weekday hours. 6h 29m per day
Physical Therapist Info Hours per resident per day provided by licensed Physical Therapists (PTs) or PT Assistants. PT services help residents recover mobility after injury or illness and are especially important for post-acute (short-stay) rehabilitation. 7m per day
Weekend RN Info Registered nurse hours specifically on weekends. Facilities sometimes reduce RN presence on Saturdays and Sundays — a low weekend RN figure compared to weekday hours can indicate reduced clinical oversight when most administrative staff are absent. 32m per day

Capacity and availability

Avg. Length of Stay Info Average number of days residents stay at this facility, based on CMS cost report data. Shorter stays often reflect post-acute or rehab care; longer stays reflect long-term care.
80 days
Bed community size
65-bed community Rank #673 / 1074Bed count — State benchmarkedThis home is ranked 673rd out of 1074 homes in Florida. Shows this facility's certified or reported bed count compared to other Florida facilities. Larger communities may offer more amenities, programs, and on-site services for residents and families.Rankings are based only on facilities in Florida that report data for that category. Facilities without available data are excluded from the ranking.Click the rank badge to see the full State ranking.Click here to see the full State ranking.
A moderately sized community that may balance personal attention with shared amenities and social activities.
Walk Score
Walk Score: 26 / 100 Rank #976 / 1486Walk Score — State benchmarkedThis home is ranked 976th out of 1486 homes in Florida. Shows how walkable this facility's neighborhood is compared to the average Walk Score across Florida facilities. Higher scores benefit residents, families, and staff.Rankings are based only on facilities in Florida that report data for that category. Facilities without available data are excluded from the ranking.Click the rank badge to see the full State ranking.Click here to see the full State ranking.
Somewhat walkable. A few nearby services may be reachable on foot, but most trips require transportation.

About this community

Occupancy

Occupancy rate
86%
Rank #165 / 258Occupancy rate — State benchmarkedThis home is ranked 165th out of 258 homes in Florida. Shows this facility's occupancy rate versus the Florida average, with its Statewide rank out of 258. Higher occupancy signals strong local demand and financial stability.Rankings are based only on facilities in Florida that report data for that category. Facilities without available data are excluded from the ranking.Click the rank badge to see the full State ranking.Click here to see the full State ranking.
Similar to the Florida average: 84.3%
Occupied beds
56 / 65
Average occupied beds in Florida homes 108 beds

License Details

Facility TypeAssisted Living Facility
StatusLicensed
IssuanceApril 1, 2026
ExpirationMarch 31, 2028
CountyLake
License Number5263
CMS Certification Number106068

Ownership & Operating Entity

Lakeview Terrace Assisted Living Facility is legally operated by Community Supports, Inc., and administered by Tammi Dawn Frisbie.

Management CompanyDSI MANAGEMENT, LLC
Owner NameCommunity Supports, Inc
Profit StatusNonprofit

Type Of Units

Extended Congregate Care
65 units
Private
65 units
Total beds
65 units

Staffing

Key information about the people who lead and staff this community.

Languages Spoken

English Spanish

Therapy & Rehabilitation

3 services
Rehabilitation Services
Respite Care
Short-Term Rehab

Additional Policies & Features

Pets Allowed
Continuing Care Retirement Community (CCRC)

Amenities & Lifestyle

Touring HoursMonday - Friday: 9:00 am - 5:00 pm; Weekend Appointments Available

Contact Lakeview Terrace Assisted Living Facility

Inspection History

In Florida, the Agency for Health Care Administration (AHCA) is the primary authority that conducts unannounced inspections and completes official health quality reports for all healthcare facilities.

Since 2013 · 13 years of data 23 citations 21 inspections 1 fine $450 fined
Inspection Score Info A composite 0–100 score combining this facility's inspections, citations, complaints, and enforcement actions relative to the Florida state average. The score below shows how many points this facility sits above or below the typical Florida assisted living residence score (the benchmark); higher is better.This is a proprietary Assisted Living Magazine score.

8 points above the Florida average for assisted living residences (83/100)

Rank #281 / 876 in Florida Inspection Score — State benchmarked This home is ranked 281st out of 876 homes in Florida. Shows this facility's inspection score compared to the Florida average among 876 comparable communities in the ranking pool. Rankings are based only on facilities in Florida that report data for that category. Facilities without available data are excluded from the ranking. This is a proprietary Assisted Living Magazine score. Inspection score: 91 out of 100. Letter grade A-. 8 points above the Florida average for assisted living residences (83/100)

Inspection Scorecard Info This scorecard compares key inspection, citation, and complaint metrics at this facility against the Florida state average. Metrics rated ≥15% worse than average are highlighted in red; those ≥15% better are highlighted in green.

Since 2013 vs. Florida state average
Overall vs. FL average 0 Worse No metrics in this bucket. 1 At Avg Metrics at Florida average:
• Inspection citation rate (at FL avg)
5 Better Metrics better than Florida average:
• Total citations (30% below)
• Citations per year (28% below)
• Citations per inspection (15% below)
• Total inspections (19% below)
• Inspections with citations (19% below)
Latest Inspection October 23, 2024 Other An inspection that falls outside standard annual surveys and formal complaint investigations. May include administrative compliance checks, documentation reviews, focused surveys on specific concerns, or revisit surveys to verify prior corrections.

Citations Info Citations are formal regulatory issues recorded during state inspections.

This FacilityFL Averagevs. FL Avg
Total citations Info Formal regulatory issues recorded by inspectors across all inspection types. 2333 This facility has 30% fewer total citations than a typical Florida assisted living residence (23 vs. FL avg 33).↓ 30% better Rank #360 / 919 Total citations — State benchmarked This home is ranked 360th out of 919 homes in Florida. Shows this facility's total citations compared to the Florida average among 919 comparable communities in the ranking pool. Rankings are based only on facilities in Florida that report data for that category. Facilities without available data are excluded from the ranking.
Citations per year Info Average citations per year since 2013. 1.82.5 This facility has 28% fewer citations per year than a typical Florida assisted living residence (1.8 vs. FL avg 2.5).↓ 28% better
Citations per inspection Info Average citations per inspection. 1.11.3 This facility has 15% fewer citations per inspection than a typical Florida assisted living residence (1.1 vs. FL avg 1.3).↓ 15% better Rank #331 / 919 Citations per inspection — State benchmarked This home is ranked 331st out of 919 homes in Florida. Shows this facility's citations per inspection compared to the Florida average among 919 comparable communities in the ranking pool. Rankings are based only on facilities in Florida that report data for that category. Facilities without available data are excluded from the ranking.

Inspections Info State inspections evaluate whether the facility meets health and safety standards.

This FacilityFL Averagevs. FL Avg
Total inspections Info Combined count of all routine and focused inspections. Excludes complaint investigations. 2126 This facility has 19% fewer total inspections than a typical Florida assisted living residence (21 vs. FL avg 26).↓ 19% better
Inspections with citations Info Inspections that resulted in at least one regulatory citation. 1316 This facility has 19% fewer inspections with citations than a typical Florida assisted living residence (13 vs. FL avg 16).↓ 19% better
Inspection citation rate Info Percentage of inspections that resulted in at least one citation. 62%62% This facility has inspection citation rate in line with the Florida average (62 vs. FL avg 62).— At avg Rank #561 / 919 Inspection citation rate — State benchmarked This home is ranked 561st out of 919 homes in Florida. Shows this facility's % of inspections with citations compared to the Florida average among 919 comparable communities in the ranking pool. Rankings are based only on facilities in Florida that report data for that category. Facilities without available data are excluded from the ranking.

Inspection Reports Summary Info An editor-reviewed summary of the themes and findings across this facility's recent inspection reports.

  • The most recent inspection on October 23, 2024 cited deficiencies that were corrected on site, continuing a pattern of addressing issues promptly.
  • The facility has recurring Class 3 deficiencies mainly in staff training and resident care rights across multiple inspections from 2013 to 2024.
  • The October 17, 2019 inspection found five Class 3 deficiencies involving staffing, service plans, records, and training, indicating ongoing systemic issues at that time.

Health Inspection History

Inspections since 2023
Total health inspections 3

State average N/A


Last Health inspection on Oct 2025

Total health citations
12 Rank #67 / 252Health citations — State benchmarkedThis home is ranked 67th out of 252 homes in Florida. Shows this facility's total health deficiency citations benchmarked to the Florida State average, with a ranking across all 252 FL facilities. Lower citation counts earn a better rank.Rankings are based only on facilities in Florida that report data for that category. Facilities without available data are excluded from the ranking.Click the rank badge to see the full State ranking.Click here to see the full State ranking.

State average N/A

Citations per inspection
4 Rank #112 / 252Citations per inspection — State benchmarkedThis home is ranked 112th out of 252 homes in Florida. Shows average deficiency citations per CMS inspection for this facility versus the Florida mean across 252 facilities with citation data. Lower is better.Rankings are based only on facilities in Florida that report data for that category. Facilities without available data are excluded from the ranking.Click the rank badge to see the full State ranking.Click here to see the full State ranking.

State average N/A


Health citations are formal notices following inspections when they fail to comply with safety and care standards.

All 12 citations resulted from standard inspections.

Breakdown of citation severity (last 3 years)
Critical health citations
0
In line with State average

State average: N/A


Serious health citations
0
In line with State average

State average: N/A

0 critical citations State average: N/A

0 serious citations State average: N/A

12 moderate citations State average: N/A

0 minor citations State average: N/A
Citations history (last 3 years)
Administration moderate citation Oct 02, 2025

Administration moderate citation Oct 02, 2025

Infection Control moderate citation Oct 02, 2025

Nursing Services moderate citation Oct 02, 2025

Staffing Data

Reporting period: October 1 – December 31, 2025 (Q4 2025). Source: CMS Payroll-Based Journal report.

Total staff 77
Employees 60
Contractors 17
Staff to resident ratio 2.41 : 1
0% compared with State average

State average ratio: 0 : 0

Avg staff/day 33
Average shift 7.4 hours
0% compared with State average

State average: 0 hours

Total staff hours (quarter) 22,360

Nursing staff breakdown

Q4 2025 · Oct 1 – Dec 31 More info This data comes from the CMS Payroll-Based Journal report covering October 1 – December 31, 2025.
Registered Nurse

Manages medical care and health needs.

RN Staff Info 7 total: 4 full-time employees and 3 contractors. 7
Average shift length Info Average shift length. Calculated as total hours divided by days worked and average staff per day. 7.3 hours
Licensed Practical Nurse

Assists with medical care and medications.

LPN Staff Info 16 total: 12 full-time employees and 4 contractors. 16
Average shift length Info Average shift length. Calculated as total hours divided by days worked and average staff per day. 8.2 hours
Certified Nursing Assistant

Helps with daily care and mobility.

CNA Staff Info All 36 CNA Staff are full-time employees. No contractors work on this role. 36
Average shift length Info Average shift length. Calculated as total hours divided by days worked and average staff per day. 7.6 hours

Contractor staffing

Q4 2025 · Oct 1 – Dec 31 More info This data comes from the CMS Payroll-Based Journal report covering October 1 – December 31, 2025.

Total hours from contractors

13.6%

3,050 contractor hours this quarter

Licensed Practical Nurse: 4 Registered Nurse: 3 Speech Language Pathologist: 2 Qualified Social Worker: 1 Physical Therapy Aide: 1 Feeding Assistant: 1 Other Physician: 1 Respiratory Therapy Technician: 1 Physical Therapy Assistant: 1 Medical Director: 1 Occupational Therapy Assistant: 1

Staff by category

Q4 2025 · Oct 1 – Dec 31 More info This data comes from the CMS Payroll-Based Journal report covering October 1 – December 31, 2025.
Certified Nursing Assistant3603612,43592100%7.6
Licensed Practical Nurse124164,50692100%8.2
Speech Language Pathologist0227606571%6.6
Clinical Nurse Specialist3036796773%8.5
Registered Nurse4376655863%7.3
RN Director of Nursing1015146368%8.2
Dental Services Staff1014645863%8
Administrator1014485661%8
Qualified Social Worker0114146368%6.6
Nurse Practitioner1013924953%8
Respiratory Therapy Technician0113037177%4.3
Other Dietary Services Staff1012295964%3.9
Physical Therapy Aide0111994448%4.5
Physical Therapy Assistant0111853942%4.7
Feeding Assistant0111033538%2.9
Other Physician011482426%2
Occupational Therapy Assistant0111233%4
Medical Director011733%2.3
36 Certified Nursing Assistant
% of Days 100%
16 Licensed Practical Nurse
% of Days 100%
2 Speech Language Pathologist
% of Days 71%
3 Clinical Nurse Specialist
% of Days 73%
7 Registered Nurse
% of Days 63%
1 RN Director of Nursing
% of Days 68%
1 Dental Services Staff
% of Days 63%
1 Administrator
% of Days 61%
1 Qualified Social Worker
% of Days 68%
1 Nurse Practitioner
% of Days 53%
1 Respiratory Therapy Technician
% of Days 77%
1 Other Dietary Services Staff
% of Days 64%
1 Physical Therapy Aide
% of Days 48%
1 Physical Therapy Assistant
% of Days 42%
1 Feeding Assistant
% of Days 38%
1 Other Physician
% of Days 26%
1 Occupational Therapy Assistant
% of Days 3%
1 Medical Director
% of Days 3%

Penalties and fines

Federal penalties imposed by CMS for regulatory violations, including civil money penalties (fines) and denials of payment for new Medicare/Medicaid admissions.

Source: CMS Penalties Database (Data as of Jan 2026)

Total fines amount $6K Rank #1 / 258Federal fines — State benchmarkedThis home is ranked 1st out of 258 homes in Florida. Shows this facility's cumulative CMS federal fine dollars versus the Florida average among facilities with fines, and where it ranks among 258 facilities in the pool. Lower total dollars mean a better rank.Rankings are based only on facilities in Florida that report data for that category. Facilities without available data are excluded from the ranking.Click the rank badge to see the full State ranking.Click here to see the full State ranking.
91% lower than State average

State average: $72K

Number of fines 1
62% fewer fines than State average

State average: 2.6

Payment Denials Info Serious action where Medicare and/or Medicaid temporarily stops payments for new residents until issues are fixed. 0
100% fewer payment denials than State average

State average: 0.1

Fines amount comparison
This facility $6K
State average $72K

No penalties in the past 3 years

No civil money penalties or payment denials were reported in the last 3 years.

Quality of care over time

These measures show how residents usually do over time at this home, based on health outcomes and preventive care.

High-risk clinical events score Info A composite score based on pressure ulcers, falls with injury, weight loss, walking ability decline, and activities of daily living decline. 15.8
113% worse than State average

State average: 7.4

Functional decline score Info A composite score based on activities of daily living decline, walking ability decline, and incontinence. 33.2
168% worse than State average

State average: 12.4

Long-stay resident measures
Need for Help with Daily Activities Increased Info Percent of long-stay residents whose need for help with daily activities has increased 26.6%
153% worse than State average

State average: 10.5%

Walking Ability Worsened Info Percent of long-stay residents whose ability to move independently worsened 33.6%
160% worse than State average

State average: 12.9%

Low Risk Residents with Bowel/Bladder Incontinence Info Percent of low risk long-stay residents who lose control of their bowels or bladder 39.2%
190% worse than State average

State average: 13.5%

Falls with Major Injury Info Percent of long-stay residents experiencing one or more falls with major injury 1.0%
61% better than State average

State average: 2.6%

High Risk Residents with Pressure Ulcers Info Percent of long-stay high risk residents with pressure ulcers 4.9%
8% better than State average

State average: 5.4%

Urinary Tract Infection Info Percent of long-stay residents with a urinary tract infection 1.0%
17% worse than State average

State average: 0.9%

Lost Too Much Weight Info Percent of long-stay residents who lose too much weight 13.0%
116% worse than State average

State average: 6.0%

Depressive Symptoms Info Percent of long-stay residents who have depressive symptoms 0.0%
100% better than State average

State average: 3.3%

Antipsychotic Use Info Percent of long-stay residents who received an antipsychotic medication 9.3%
16% worse than State average

State average: 8.0%

Pneumococcal Vaccine Info Percent of long-stay residents assessed and appropriately given the pneumococcal vaccine 85.6%
12% worse than State average

State average: 97.7%

Influenza Vaccine Info Percent of long-stay residents assessed and appropriately given the seasonal influenza vaccine 100.0%
In line with State average

State average: 99.2%

Short-stay resident measures
Pneumococcal Vaccine Info Percent of short-stay residents assessed and appropriately given the pneumococcal vaccine 96.9%
In line with State average

State average: 94.0%

Antipsychotic medication increase Info Percent of short-stay residents who newly received an antipsychotic medication 0.0%
100% better than State average

State average: 1.5%

Influenza Vaccine Info Percent of short-stay residents assessed and appropriately given the seasonal influenza vaccine 97.9%
In line with State average

State average: 94.7%

Breakdown by payment type

Medicare

68% of new residents, usually for short-term rehab.

Typical stay 27 days

Private pay

27% of new residents, often for short stays.

Typical stay 1 years

Medicaid

4% of new residents, often for long-term daily care.

Typical stay 1 - 2 years

Facility Characteristics

Source: CMS Long-Term Care Facility Characteristics (Data as of Jan 2026)

Total residents 32
Medicare
8
25% of residents
Medicaid
4
12.5% of residents
Private pay or other
20
62.5% of residents
Programs & Services
Residents Group

Residents meet regularly to discuss policies, care quality, and activities

CCRC

Part of a Continuing Care Retirement Community offering multiple care levels

Active Resident Council

Organized group of residents that meets regularly to discuss facility policies, quality of life, and activities.

Finances and operations

Based on CMS SNF Cost Report for fiscal year ending in 12/2023.

Nonprofit
Nonprofit Corporation
Net patient revenue Info Net patient revenue — what the home actually collects for resident care, after contractual allowances, bad debt and discounts are subtracted from its gross charges (CMS cost report, Worksheet G-3). It covers resident care only; money the home earns from other sources is shown separately as "Other income."
$25.2M
Net patient income Info Net patient income: net patient revenue minus the home's total operating expenses. A positive figure means it earns more from resident care than it spends to deliver it; a negative figure means the opposite. It excludes non-operating "other income."
-$3.0M
Nonprofit Nonprofit Corporation
Net patient revenue Info Net patient revenue — what the home actually collects for resident care, after contractual allowances, bad debt and discounts are subtracted from its gross charges (CMS cost report, Worksheet G-3). It covers resident care only; money the home earns from other sources is shown separately as "Other income."
$25.2M Rank #45 / 257Revenue — State benchmarkedThis home is ranked 45th out of 257 homes in Florida. Shows this facility's annual revenue compared to the Florida average. Higher revenue generally means more resources for staffing and capital — read alongside Payroll %.Rankings are based only on facilities in Florida that report data for that category. Facilities without available data are excluded from the ranking.Click the rank badge to see the full State ranking.Click here to see the full State ranking.
Net patient income Info Net patient income: net patient revenue minus the home's total operating expenses. A positive figure means it earns more from resident care than it spends to deliver it; a negative figure means the opposite. It excludes non-operating "other income."
-$3.0M
Other income Info Money the home earns outside of resident care — such as investments, grants, rentals and other non-operating sources (CMS cost report, Worksheet G-3). It is tracked separately from net patient revenue: it is not part of that figure, and it is not included in net patient income.
$4.5M
Payroll costs Info Staff salaries plus wage-related costs — benefits such as payroll taxes, health insurance and retirement — from the home's own accounting records (CMS cost report, Worksheet A). Contract or agency labor is counted separately, under other operating costs. Rank #94 / 257Payroll — State benchmarkedThis home is ranked 94th out of 257 homes in Florida. Shows total annual staff payroll benchmarked to the Florida average. Higher payroll investment relative to peers often signals better staffing and less reliance on cheaper contract labor.Rankings are based only on facilities in Florida that report data for that category. Facilities without available data are excluded from the ranking.Click the rank badge to see the full State ranking.Click here to see the full State ranking.
$8.9M 35.3% of net patient revenue Info Payroll as a share of revenue: staff salaries and wage-related benefits divided by net patient revenue. A higher figure means more of each revenue dollar goes to staff pay. Rank #235 / 257Payroll % — State benchmarkedThis home is ranked 235th out of 257 homes in Florida. Shows payroll as a percentage of revenue versus the Florida average. Well-run Florida facilities typically land around 49–56% — the top third Statewide. Below 25% may signal understaffing or heavy agency use — read with Staffing ratings.Rankings are based only on facilities in Florida that report data for that category. Facilities without available data are excluded from the ranking.Click the rank badge to see the full State ranking.Click here to see the full State ranking.
Other operating costs Info Everything it costs to run the home apart from payroll — food, utilities, supplies, maintenance, contract labor and administration. Calculated as total operating expense minus payroll (staff salaries and wage-related benefits).
$19.3M
Total costs Info The home's total operating expense for the year — all the costs of running it, salaries included (CMS cost report, Worksheet G-3).
$28.2M

Who this home usually serves

TYPE OF STAY

Mostly short-term rehab stays

Most residents typically stay for a few weeks or months before returning home or moving on.

Most new residents arrive under Medicare (68% of admissions), and a typical Medicare stay runs around 27 days.

Admissions
146 total

Coverage residents most often arrive under.

Medicare 68%
Private pay 27%
Medicaid 4%
Discharges
178 total

Coverage residents most often leave under.

Medicare 66%
Private pay 28%
Medicaid 6%

Activities in this home

Living Spaces & Floor Plans for Lakeview Terrace Assisted Living Facility

Lakeview Terrace Assisted Living Facility, Nursing Home in Altoona, FL — Floor plan of a senior living apartment layout
1 Bedroom
Lakeview Terrace Assisted Living Facility, Nursing Home in Altoona, FL — Floor plan layout of a senior living apartment
2 bedroom
Lakeview Terrace Assisted Living Facility, Nursing Home in Altoona, FL — Floor plan of a senior living apartment layout
2 bedroom
Lakeview Terrace Assisted Living Facility, Nursing Home in Altoona, FL — Floor plan of a one-bedroom apartment layout
1 Bedroom
Lakeview Terrace Assisted Living Facility, Nursing Home in Altoona, FL — Floor plan of a two-bedroom assisted living apartment
2 bedroom

Places of interest near Lakeview Terrace Assisted Living Facility

Address 0.0 miles from city center Info Estimated distance in miles from Altoona's city center to Lakeview Terrace Assisted Living Facility's address, calculated via Google Maps.

Calculate Travel Distance to Lakeview Terrace Assisted Living Facility

Add your location

Address

Compare Nursing Homes around the area

The information below is reported by the Florida Agency for Health Care Administration (AHCA).

The Glenview at Pelican Bay
NH
IL
SNF
Naples (North Naples) -42 A+ 27 1 Bed / 2 Bed / 3 Bed
Terracina Grand
NH
AL
IL
MC
RC
SNF
Naples -200 A+ 12 Studio / 1 Bed / 2 Bed
St Mark Village, Inc.
NH
AL
IL
MC
SNF
Palm Harbor (Highland Lakes) -88 A+ 40 -
Health Center at Sinai Residences
NH
AL
IL
MC
SNF
Boca Raton -74 A+ 26 -
Lakeview Terrace Assisted Living Facility
NH
AL
HC
IL
MC
SNF
Altoona -65 - 26 -

Frequently Asked Questions about Lakeview Terrace Assisted Living Facility

What languages are spoken at Lakeview Terrace Assisted Living Facility?

The team at Lakeview Terrace Assisted Living Facility speaks English and Spanish.

Who is the owner of Lakeview Terrace Assisted Living Facility?

Lakeview Terrace Assisted Living Facility is legally operated by Community Supports, Inc., and administered by Tammi Dawn Frisbie.

Is Lakeview Terrace Assisted Living Facility in a walkable area?

Lakeview Terrace Assisted Living Facility has a walk score of 26. Somewhat walkable. A few nearby services may be reachable on foot, but most trips require transportation.

What is the license number of Lakeview Terrace Assisted Living Facility?

According to FL state health department records, Lakeview Terrace Assisted Living Facility's license number is 5263.

When does Lakeview Terrace Assisted Living Facility's license expire?

According to FL state health department records, Lakeview Terrace Assisted Living Facility's license expires on March 31, 2028.

What is the occupancy rate at Lakeview Terrace Assisted Living Facility?

Lakeview Terrace Assisted Living Facility's occupancy is 86%.

Does Lakeview Terrace Assisted Living Facility have different floorplan options?

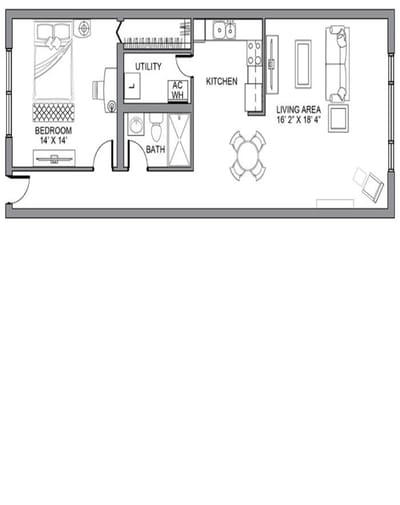
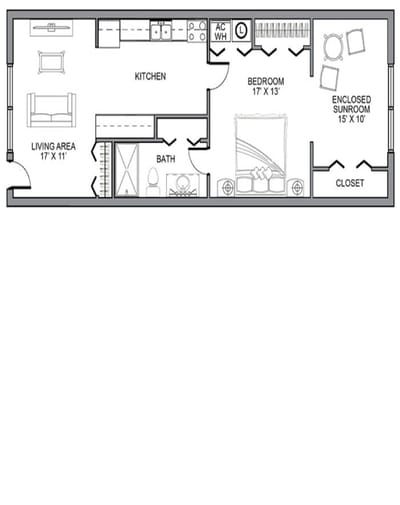
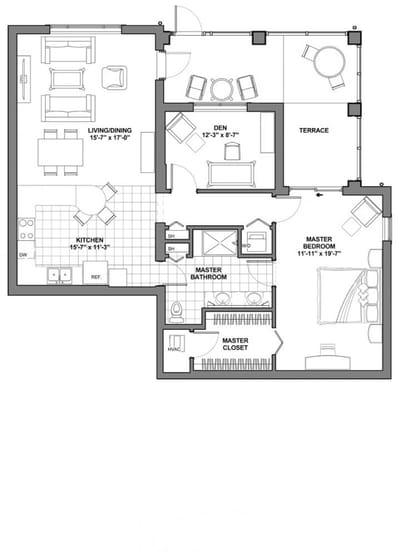
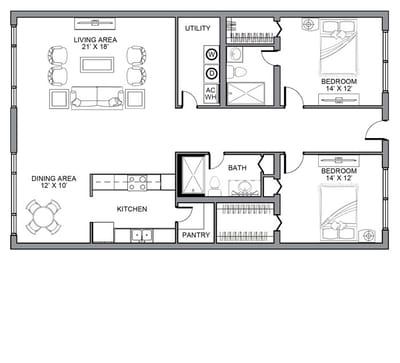
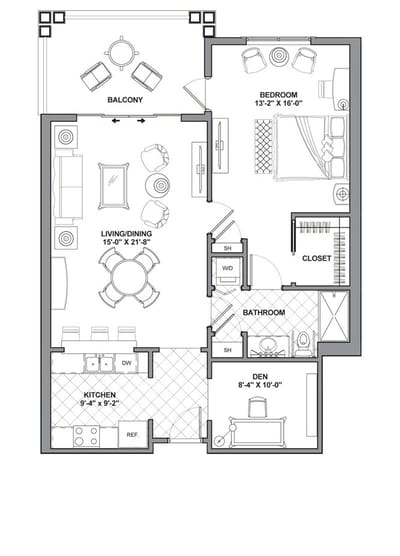
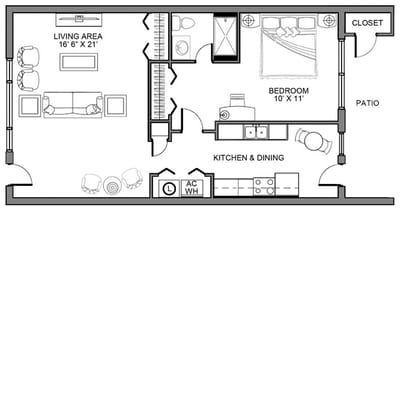
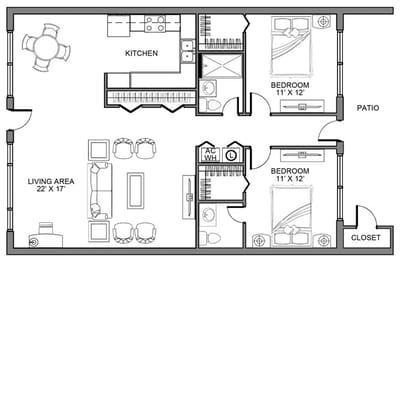
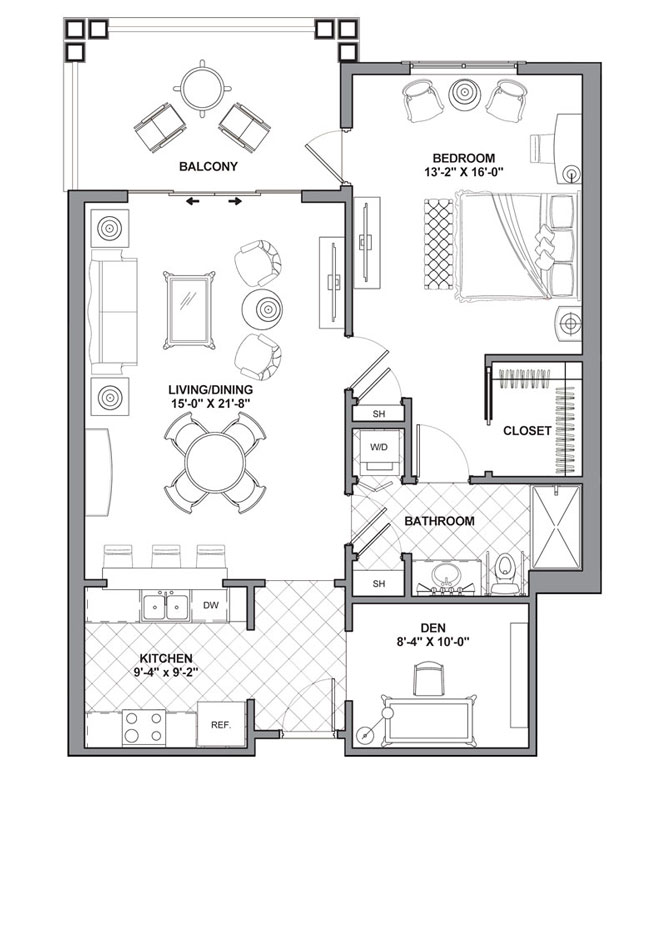
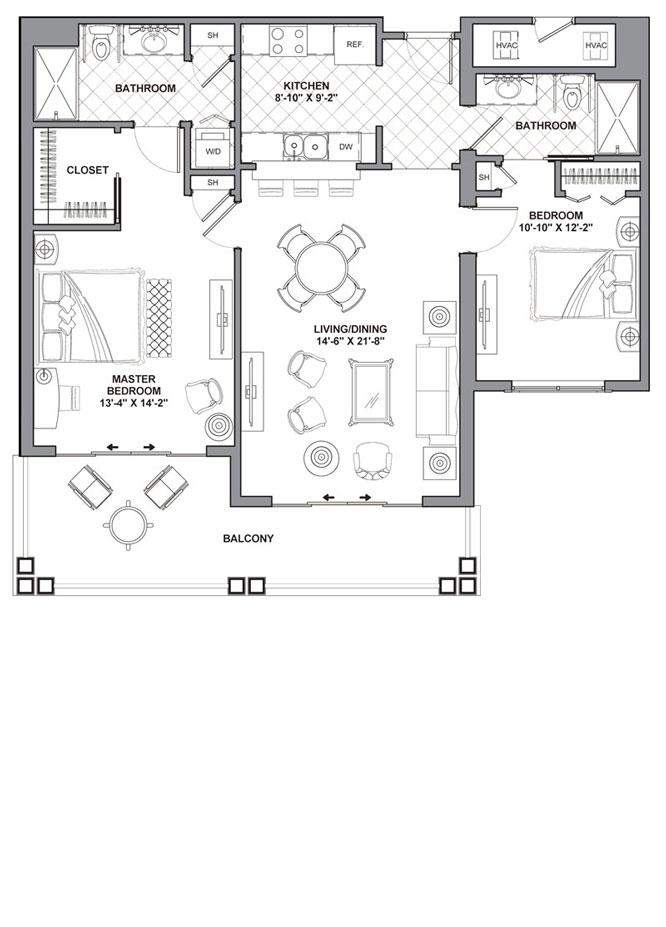
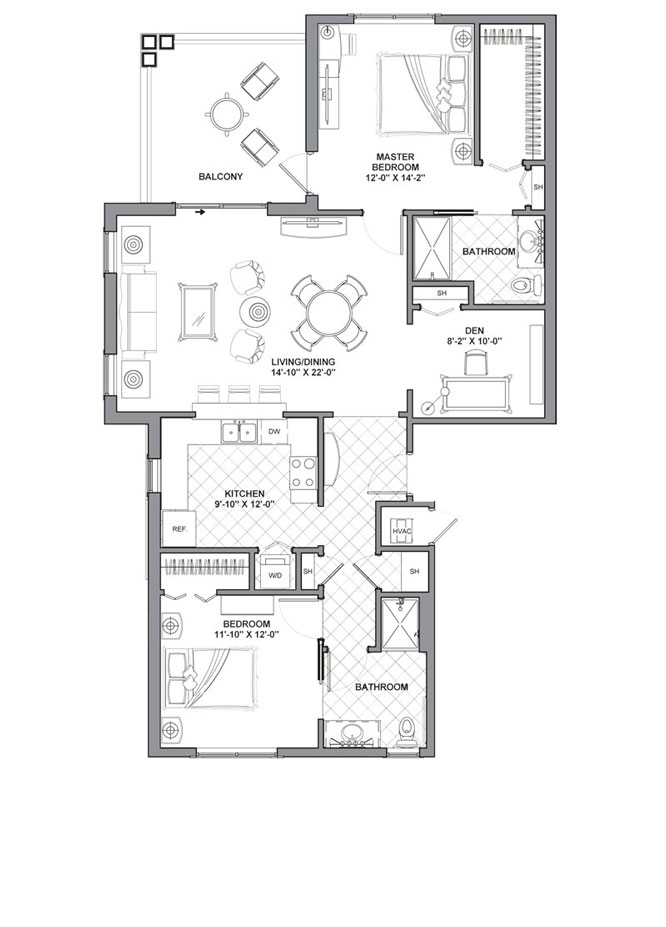
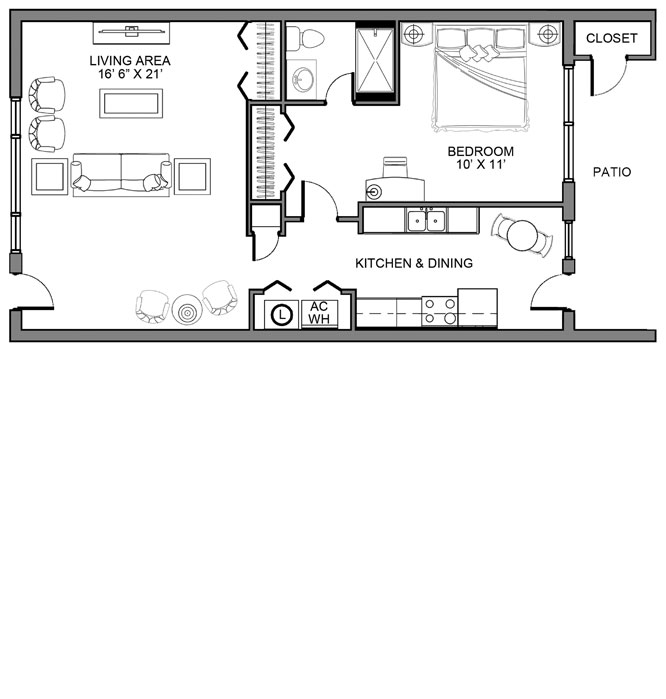
Yes — see the floorplan options available at Lakeview Terrace Assisted Living Facility on this page.

Guides for Better Senior Living

Care Cost Calculator: See Prices in Your Area

Nursing Home Data Explorer

Don’t Wait Too Long: 7 Red Flag Signs Your Parent Needs Assisted Living Now

The True Cost of Assisted Living in 2025 – And How Families Are Paying For It

Understanding Senior Living Costs: Pricing Models, Discounts & Financial Assistance