Explore Open Rooms

1 Contact details
2 What type of senior care service are you looking for?
3 What budget do you have in mind for senior care?
4 How soon do you need to find care?
5 Additional details

Thank you for your interest!

Our team will be in touch shortly to help with next steps.

Nursing Home

Lamar Estates, LLC

Nursing Home

Lamar Estates, LLC

205 S 10th St, Lamar, CO 81052 View map
Overview of Lamar Estates, LLC

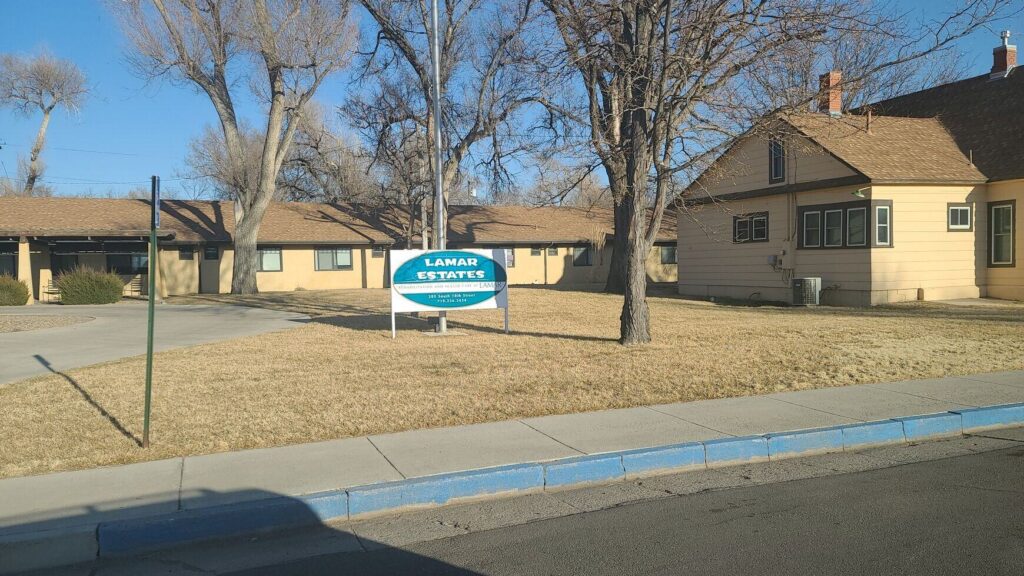
Find the care you need at Lamar Estates LLC, an outstanding community in Lamar, CO, offering skilled nursing. With a kind and well-trained team available around the clock, residents receive the highest quality of care tailored to their unique needs. Social services are also provided for residents’ convenience, ensuring they find reliable resources and optimize them.

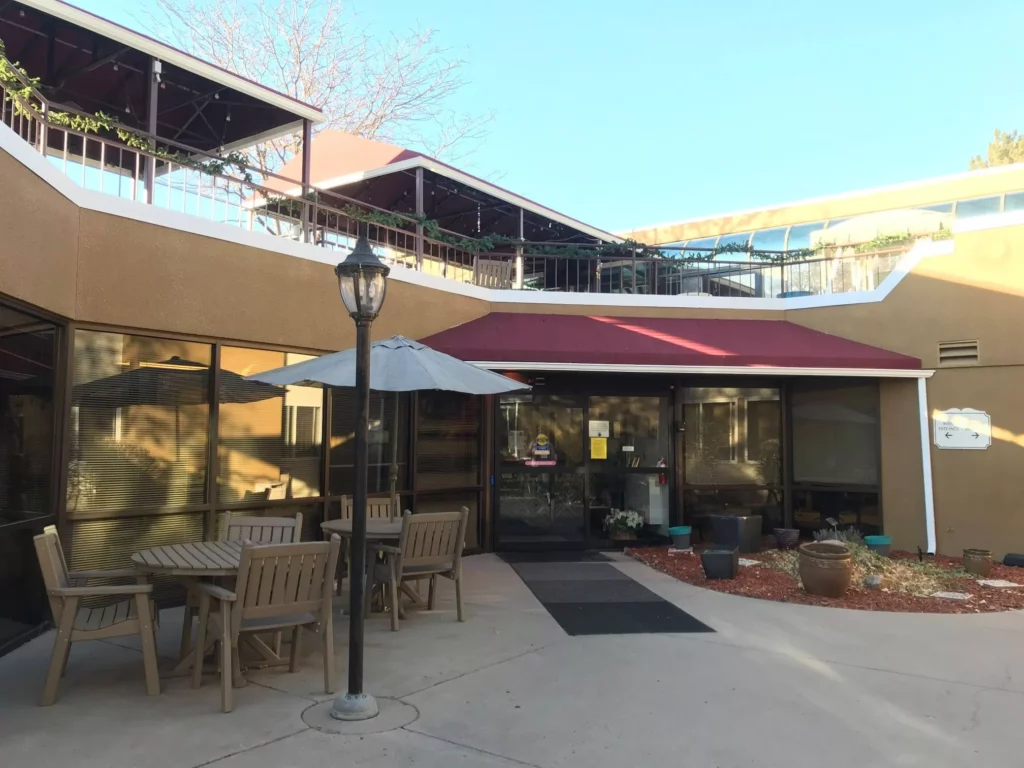
Aside from their healthcare needs, a variety of fun recreational activities are conducted for residents’ leisure and wellness. Healthy meals are important for residents’ well-being, so delicious and well-balanced dining options are provided to meet their dietary needs and preferences. Therapy services and rehabilitation are also provided to enhance residents’ living experiences. The community is a great option for those needing a higher level of care, especially with its top-notch services and state-of-the-art amenities.

(719) 336-3434

Quality ratings

Measured by Centers for Medicare & Medicaid Services (CMS)

Overall rating Info The Overall CMS Rating combines results from health inspections, staffing levels and quality measures. Health inspections carry the most weight. Staffing and quality scores can increase or decrease the final rating based on performance compared to state and national standards.
5/5
Colorado average: 3.2/5
Health Inspection Info Based on the results of the facility's three most recent standard inspections and any complaint investigations. CMS reviews the number, scope, and severity of deficiencies, with more recent findings weighted more heavily.
5/5
Colorado average: 2.8/5
Staffing Info Measures average nursing staff hours per resident per day, including Registered Nurses (RNs) and total nursing staff. Ratings are adjusted based on the level of care residents require and are compared to state and national benchmarks.
4/5
Colorado average: 3.1/5
Quality Measures Info Based on clinical and physical health indicators reported to CMS, such as hospital readmissions, falls, pressure ulcers, and improvements in mobility. These measures reflect how well residents' health needs are being managed.
2/5
Colorado average: 4.1/5

Nursing care per resident

Info This shows how many total hours of nursing staff time are available per resident each day. Higher numbers usually mean more staff support.
4h 17m per day

This home provides 11% more nursing time per resident than the Colorado average.

Colorado average: 3h 51m per day

Staffing hours breakdown

Info Hours of care per resident per day, broken down by staff type. Data from CMS Medicare.
Staff type Facility State avg National avg
Registered Nurse (RN) Info Registered nurse hours per resident per day. 35m per day 50m per day 41m per day
Nurse Aide Info Nurse aide hours per resident per day. 2h 10m per day 2h 13m per day 2h 21m per day
Total Nursing (Weekend) Info Total number of nurse staff hours per resident per day on weekends. 3h 6m per day 3h 17m per day 3h 26m per day
Physical Therapist Info Physical therapist staff hours per resident per day. 2m per day 5m per day 4m per day
RN (Weekend) Info Registered nurse hours per resident per day on weekends. 28m per day 36m per day 29m per day

Capacity and availability

Smaller home

May offer a more intimate, personalized care environment.

Total beds 60

This home usually has availability

Lower occupancy suggests more openings may be available.

Lower demand than the Colorado average
Occupancy rate 32.4%
Residents per day (avg) 24
Occupancy rate
32.4%
Residents per day (avg)
24

Who this home usually serves

TYPE OF STAY

Mostly long-term care residents

Most residents stay for extended periods and receive ongoing daily care.

Might be optimal for
Long-term daily care Ongoing support needs

Breakdown by payment type

Medicare

26% of new residents, usually for short-term rehab.

Typical stay 4 - 5 months

Private pay

42% of new residents, often for short stays.

Typical stay 7 - 8 months

Medicaid

32% of new residents, often for long-term daily care.

Typical stay 2 years

Finances and operations

Privately-owned community
Home revenue
$2.5M
Operating loss
-$586.2K
Privately-owned community
Home revenue
$2,479,380.00
Operating loss
$-586,190.00
Payroll costs Info The portion of the home's budget spent on staff, including nurses, caregivers, and other employees who support care and operations.
$1.2M
46.7% of revenue
Other operating costs Info All remaining costs needed to run the home, such as food, utilities, building maintenance, supplies and administrative expenses.
$1.9M
Total costs $3.1M
Walk Score
Walk Score: 55 / 100
Moderately walkable. Some errands can be accomplished on foot, with a mix of nearby amenities.
BBB Rating
BBB Rating: A+ (Not Accredited)
An independent rating from the Better Business Bureau based on factors such as complaint history, transparency, and business practices.
How BBB ratings work

Additional licensing details

CMS Certification Number: 65294

What does this home offer?

Accepts Medicaid icon

Accept Medicaid: Yes

Building type icon
Building type icon

Building Type: Single-story

On-site medical care and health services icon

On-site Medical Care and Health Services

Types of Care at Lamar Estates, LLC

Nursing Home
Contact Lamar Estates, LLC

Inspection History

In Colorado, the Department of Public Health and Environment, Health Facilities Division is the regulatory body that performs unannounced surveys and publishes facility inspection findings.

Health Inspection History

Inspections
Total health inspections 3

Colorado average 4.8


Last Health inspection on Sep 2023

Total health citations 15

Colorado average 24.8

Citations per inspection
5

Colorado average 5.2


Health citations are formal notices following inspections when they fail to comply with safety and care standards.

All 15 citations resulted from standard inspections.

Breakdown of citation severity (last 3 years)
Critical Health citations More info 0
100% better than Colorado average

Colorado average: 0.4


Serious Health citations More info 0
100% better than Colorado average

Colorado average: 2.1

0 critical citations More info Colorado average: 0.4

0 serious citations More info Colorado average: 2.1

15 moderate citations More info Colorado average: 22.2

0 minor citations More info Colorado average: 0.2
Citations history (last 3 years)
Care Planning moderate citation Info Issues related to creating and updating personalized care plans for residents based on their needs and conditions. Sep 27, 2023
Corrected

Care Planning moderate citation Info Issues related to creating and updating personalized care plans for residents based on their needs and conditions. Sep 27, 2023
Corrected

Abuse/Neglect moderate citation Info Issues related to protecting resident's from harm, including abuse, neglect, or mistreatment. Jun 29, 2022
Corrected

Infection Control moderate citation Info Issues related to preventing and controlling infections, including hygiene practices and safety protocols. Jun 29, 2022
Corrected

Compare Nursing Homes around Colorado The information below is reported by the Colorado Department of Public Health and Environment, Health Facilities Division.

5 facilities compared · CMS & CO Dept. of Health data · Updated Mar 2026

Lamar Estates, LLC
NH

Nursing Home Licensed facility providing 24/7 skilled nursing care for residents with complex, ongoing medical needs. Staffed by RNs, LPNs, and CNAs. Inspected and star-rated annually by CMS. Accepts Medicare (short-term rehab) and Medicaid (long-term care).

Lamar
60
32.4%
-58%
4.28
+41%
+11%
0
15
0
24
A+
55
Klippert, Crystal
$2,4M
$1,2M
49.1%
65294
Cherrelyn Healthcare Center
NH

Nursing Home Licensed facility providing 24/7 skilled nursing care for residents with complex, ongoing medical needs. Staffed by RNs, LPNs, and CNAs. Inspected and star-rated annually by CMS. Accepts Medicare (short-term rehab) and Medicaid (long-term care).

Littleton
190
86.5%
+13%
2.69
-20%
-30%
0
37
7
169
A+
78
Stellar Cherrelyn Management Llc
$23,2M
$11,1M
47.8%
65203
Skyline Ridge Skilled Nursing & Rehab in Cañon City, CO
NH

Nursing Home Licensed facility providing 24/7 skilled nursing care for residents with complex, ongoing medical needs. Staffed by RNs, LPNs, and CNAs. Inspected and star-rated annually by CMS. Accepts Medicare (short-term rehab) and Medicaid (long-term care).

Cañon City
85
91.9%
+20%
3.55
-26%
-8%
1
35
3
63
A+
20
Stellar Skyline Ridge Management Llc
$9,6M
$4,8M
49.8%
65250
Cedars Healthcare Center Rehab, Skilled Nursing & Short Term Care
NH

Nursing Home Licensed facility providing 24/7 skilled nursing care for residents with complex, ongoing medical needs. Staffed by RNs, LPNs, and CNAs. Inspected and star-rated annually by CMS. Accepts Medicare (short-term rehab) and Medicaid (long-term care).

Lakewood (Edgewood)
130
58.1%
-24%
4.04
-62%
+5%
2
44
3
101
A+
77
Snh Proj Lincoln Trs Llc
$9,2M
$5,8M
62.4%
65202
Willow Tree Care Center Skilled Nursing & Rehab
NH

Nursing Home Licensed facility providing 24/7 skilled nursing care for residents with complex, ongoing medical needs. Staffed by RNs, LPNs, and CNAs. Inspected and star-rated annually by CMS. Accepts Medicare (short-term rehab) and Medicaid (long-term care).

Delta
80
53.1%
-31%
3.85
+44%
0%
0
43
3
57
-
12
Stellar Willow Tree Management Llc
$5,3M
$2,6M
49.3%
65249

Places of interest near Lamar Estates, LLC

Address 0.5 miles from city center

Address 205 S 10th St, Lamar, CO 81052

Calculate Travel Distance to Lamar Estates, LLC

Add your location

Address

Staffing Data (Q2 2025)

This data corresponds to Q2 2025 and is based on CMS Payroll-Based Journal.

Total staff 47
Employees 38
Contractors 9
Staff to resident ratio 2.35:1
23% better than Colorado average

Colorado average ratio: 1.91:1

Avg staff/day 16
Average shift 6.8 hours
18% worse than Colorado average

Colorado average: 8.3 hours

Total staff hours (quarter) 9,838
Nursing staff breakdown
Registered Nurse

Manages medical care and health needs.

Total count 9
Average shift length Info Average shift length. Calculated as total hours divided by days worked and average staff per day. 7.2 hours

No contractors work on this role.

Licensed Practical Nurse

Assists with medical care and medications.

Total count 4
Average shift length Info Average shift length. Calculated as total hours divided by days worked and average staff per day. 7.8 hours

No contractors work on this role.

Certified Nursing Assistant

Helps with daily care and mobility.

Total count 15
Average shift length Info Average shift length. Calculated as total hours divided by days worked and average staff per day. 7.4 hours

No contractors work on this role.

Contractor staffing

Total hours from contractors

1.2%

123 contractor hours this quarter

Feeding Assistant: 2 Physician Assistant: 1 Medical Director: 1 Occupational Therapy Assistant: 1 Occupational Therapy Aide: 1 Mental Health Service Worker: 1 Dietitian: 1 Other Physician: 1
Staff by category
Certified Nursing Assistant150155,12791100%7.4
Registered Nurse9091,46291100%7.2
Licensed Practical Nurse4041,0007785%7.8
Dental Services Staff1015046369%8
Administrator1014966268%8
Nurse Practitioner1014886167%8
Clinical Nurse Specialist1011793033%6
Respiratory Therapy Technician2021755763%2.2
Physical Therapy Aide1011014853%2.1
Speech Language Pathologist101842426%3.5
Qualified Social Worker101502629%1.9
Physical Therapy Assistant101502730%1.8
Feeding Assistant022311112%2.3
Physician Assistant0112955%5.8
Occupational Therapy Aide0112133%6.9
Occupational Therapy Assistant0111233%4
Mental Health Service Worker0111233%4
Medical Director011933%3
Other Physician011811%8
Dietitian011133%0.4
15 Certified Nursing Assistant
% of Days 100%
9 Registered Nurse
% of Days 100%
4 Licensed Practical Nurse
% of Days 85%
1 Dental Services Staff
% of Days 69%
1 Administrator
% of Days 68%
1 Nurse Practitioner
% of Days 67%
1 Clinical Nurse Specialist
% of Days 33%
2 Respiratory Therapy Technician
% of Days 63%
1 Physical Therapy Aide
% of Days 53%
1 Speech Language Pathologist
% of Days 26%
1 Qualified Social Worker
% of Days 29%
1 Physical Therapy Assistant
% of Days 30%
2 Feeding Assistant
% of Days 12%
1 Physician Assistant
% of Days 5%
1 Occupational Therapy Aide
% of Days 3%
1 Occupational Therapy Assistant
% of Days 3%
1 Mental Health Service Worker
% of Days 3%
1 Medical Director
% of Days 3%
1 Other Physician
% of Days 1%
1 Dietitian
% of Days 3%

Facility Characteristics

Source: CMS Long-Term Care Facility Characteristics (Data as of Jan 2026)

Total census
20 residents
Residents by payment source
Medicare
1 resident (5%)
Medicaid
14 residents (70%)
Private pay or other
5 residents (25%)
Programs & Services
Residents' Group

Residents meet regularly to discuss policies, care quality, and activities

Active Resident Council

Organized group of residents that meets regularly to discuss facility policies, quality of life, and activities.

Quality of care over time

These measures show how residents usually do over time at this home, based on health outcomes and preventive care.

High-risk clinical events score Info A composite score based on pressure ulcers, falls with injury, weight loss, walking ability decline, and activities of daily living decline. 8.9
In line with Colorado average

Colorado average: 9.0

Functional decline score Info A composite score based on activities of daily living decline, walking ability decline, and incontinence. 17.4
7% better than Colorado average

Colorado average: 18.8

Long-stay resident measures
Significantly below average Colorado avg: 3.8 Info CMS star rating based on long-stay quality measure performance. 5 stars = significantly above average, 1 star = significantly below average.
Need for Help with Daily Activities Increased Info Percent of long-stay residents whose need for help with daily activities has increased 14.5%
9% better than Colorado average

Colorado average: 16.0%

Walking Ability Worsened Info Percent of long-stay residents whose ability to move independently worsened 18.7%
10% worse than Colorado average

Colorado average: 17.0%

Low Risk Residents with Bowel/Bladder Incontinence Info Percent of low risk long-stay residents who lose control of their bowels or bladder 19.1%
18% better than Colorado average

Colorado average: 23.2%

Falls with Major Injury Info Percent of long-stay residents experiencing one or more falls with major injury 1.3%
62% better than Colorado average

Colorado average: 3.3%

High Risk Residents with Pressure Ulcers Info Percent of long-stay high risk residents with pressure ulcers 8.3%
114% worse than Colorado average

Colorado average: 3.9%

Urinary Tract Infection Info Percent of long-stay residents with a urinary tract infection 4.3%
199% worse than Colorado average

Colorado average: 1.4%

Lost Too Much Weight Info Percent of long-stay residents who lose too much weight 1.6%
68% better than Colorado average

Colorado average: 5.2%

Depressive Symptoms Info Percent of long-stay residents who have depressive symptoms 2.9%
60% better than Colorado average

Colorado average: 7.2%

Antipsychotic Use Info Percent of long-stay residents who received an antipsychotic medication 12.8%
32% better than Colorado average

Colorado average: 18.8%

Pneumococcal Vaccine Info Percent of long-stay residents assessed and appropriately given the pneumococcal vaccine 92.4%
In line with Colorado average

Colorado average: 93.3%

Influenza Vaccine Info Percent of long-stay residents assessed and appropriately given the seasonal influenza vaccine 87.5%
8% worse than Colorado average

Colorado average: 94.7%

Hospitalizations per 1,000 days Info Number of hospitalizations per 1,000 long-stay resident days. 3.75
188% worse than Colorado average

Colorado average: 1.30

ED visits per 1,000 days Info Number of outpatient emergency department visits per 1,000 long-stay resident days. 5.37
222% worse than Colorado average

Colorado average: 1.67

Short-stay resident measures
Pneumococcal Vaccine Info Percent of short-stay residents assessed and appropriately given the pneumococcal vaccine 49.1%
36% worse than Colorado average

Colorado average: 76.6%

Antipsychotic medication increase Info Percent of short-stay residents who newly received an antipsychotic medication 0.0%
100% better than Colorado average

Colorado average: 1.4%

Falls with major injury Info Percentage of SNF residents who experience falls with major injury during their stay. 0.0%
100% better than Colorado average

Colorado average: 0.8%

Guides for Better Senior Living

Care Cost Calculator: See Prices in Your Area

Nursing Home Data Explorer

Don’t Wait Too Long: 7 Red Flag Signs Your Parent Needs Assisted Living Now

The True Cost of Assisted Living in 2025 – And How Families Are Paying For It

Understanding Senior Living Costs: Pricing Models, Discounts & Financial Assistance

Financial Aid for Colorado Seniors

Get financial aid guidance

Elderly, Blind, and Disabled Waiver

Colorado Medicaid EBD Waiver

Age 65+ or disabled, Colorado resident, Medicaid- eligible, nursing home-level care need.

~$2,829/month (300% FBR, individual).

$2,000 (individual), $3,000 (couple).

Requires level-of-care assessment by case manager.

Old Age Pension (OAP) Health Care Program

Colorado OAP

Age 60+, Colorado resident.

~$1,215/month (individual).

$2,000 (individual).

Supplements SSI; limited medical coverage.

Program of All-Inclusive Care for the Elderly (PACE)

Colorado Medicaid PACE

Age 55+, Colorado resident, nursing home-level care need, safe with PACE support.

~$2,829/month (300% FBR).

$2,000 (individual), $3,000 (couple).

Limited to specific regions (e.g., Denver, Pueblo).

Home Care Allowance (HCA)

Colorado Home Care Allowance (HCA)

Seniors typically 65+, Age 5+ with disability, Colorado resident, financial/functional need.

~$1,004/month (individual, stricter than waivers).

$2,000 (individual), $3,000 (couple).

Must need help with ADLs; not Medicaid-waiver eligible.

Senior Community Service Employment Program (SCSEP)

Colorado SCSEP (federally funded, state-administered)

Age 55+, unemployed, low-income, Colorado resident.

~$1,983/month (125% FPL, individual).

Not specified; income-focused.

Priority for veterans, rural residents.

Tour Icon
Planning a tour? Check our touring checklist.
Chat Icon
Thinking of living here? We can help you speak to a current resident