Skyline Ridge Skilled Nursing & Rehab in Cañon City, CO
CMS overall rating Info CMS (the Centers for Medicare & Medicaid Services) is the federal agency that rates nursing home quality. Its Overall Rating runs from 1 to 5 stars, combining health inspections, staffing, and quality measures, with inspections weighted most heavily.

Skyline Ridge Skilled Nursing & Rehab in Cañon City, CO

CMS overall rating Info CMS (the Centers for Medicare & Medicaid Services) is the federal agency that rates nursing home quality. Its Overall Rating runs from 1 to 5 stars, combining health inspections, staffing, and quality measures, with inspections weighted most heavily.
Calculator: See prices in your area
Skyline Ridge Skilled Nursing & Rehab in Cañon City, CO accepts Medicare, Medicaid, and private pay.

Overview of Skyline Ridge Skilled Nursing & Rehab in Cañon City, CO

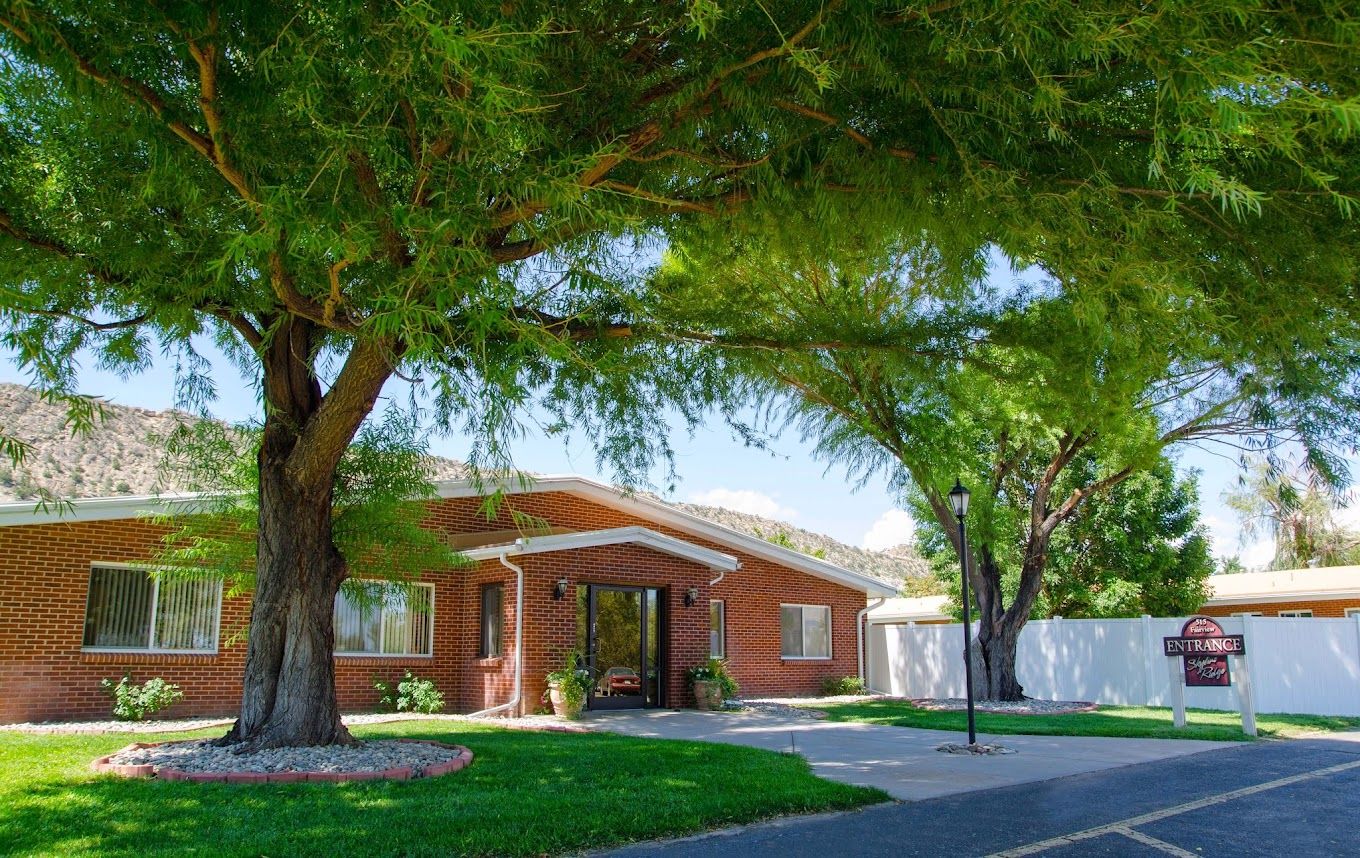
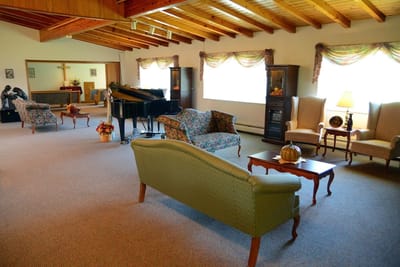
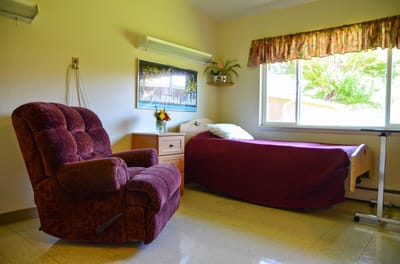
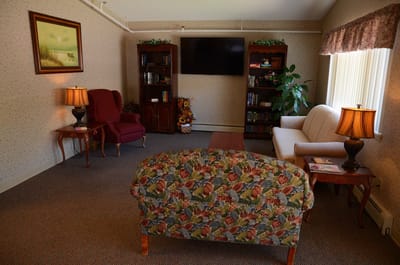
Tucked away in Cañon City, CO, Skyline Ridge Skilled Nursing & Rehab is a compassionate senior care provider offering skilled nursing and rehabilitation services. Residents enjoy a variety of amenities, including spacious common areas, community Wi-Fi, and individually controlled heating in every room. The community focuses on providing a warm, inviting atmosphere where residents and their families feel at home.

Skyline Ridge is committed to delivering exceptional care that ensures residents feel glad to be part of the community. With amenities such as daily housekeeping, laundry services, and a responsive call-light system, residents receive comprehensive support. Programs include 24-hour skilled nursing, specialized wound care, rehabilitation services, and hospice care, ensuring tailored, compassionate care for every individual.

Quality ratings

Measured by Centers for Medicare & Medicaid Services (CMS)

Overall rating Info The Overall CMS Rating combines results from health inspections, staffing levels and quality measures. Health inspections carry the most weight. Staffing and quality scores can increase or decrease the final rating based on performance compared to state and national standards.
Health Inspection Info Based on the results of the facility's three most recent standard inspections and any complaint investigations. CMS reviews the number, scope, and severity of deficiencies, with more recent findings weighted more heavily.
Staffing Info Measures average nursing staff hours per resident per day, including Registered Nurses (RNs) and total nursing staff. Ratings are adjusted based on the level of care residents require and are compared to state and national benchmarks.
Quality Measures Info Based on clinical and physical health indicators reported to CMS, such as hospital readmissions, falls, pressure ulcers, and improvements in mobility. These measures reflect how well residents' health needs are being managed.

Staffing hours breakdown

Info Daily nursing hours per resident by staff type, reported to CMS. Higher is generally better — compare this facility to state and national averages to see where staffing stands.

Hours per resident per day — compared to state averages

Total nursing care / resident Info Total adjusted nursing hours per resident per day, combining RN, LPN, and aide time. CMS adjusts this for case-mix so facilities can be fairly compared.
3h 33m per day
Rank #117 / 215Nurse hours — State benchmarkedThis home is ranked 117th out of 215 homes in Colorado. Shows adjusted nurse hours per resident per day benchmarked to the Colorado average, with a ranking across 215 Colorado facilities. More hours mean more direct care. The national average is about 3.5 hrs; below 3.0 is a red flag.Rankings are based only on facilities in Colorado that report data for that category. Facilities without available data are excluded from the ranking.Click the rank badge to see the full State ranking.Click here to see the full State ranking.
vs avg

4 of 6 metrics below state avg

Standout metric Physical Therapist is +7% above state avg
Staff typeHours / Day / Residentvs state avg
Registered Nurse (RN) Info RNs hold the highest nursing license and can assess residents, interpret test results, and direct care plans. More RN hours per day often signals stronger clinical oversight and faster response to health changes. 32m per day ▼ 36% State avg: 50m per day · National avg: 41m per day
LPN / LVN Info Licensed Practical Nurses (LPNs) or Licensed Vocational Nurses (LVNs) deliver routine hands-on care — medication administration, wound dressing, and monitoring vital signs. They work under RN supervision and make up a large share of daily bedside care. 40m per day ■ Avg State avg: 41m per day · National avg: 52m per day
Nurse Aide Info Certified Nurse Aides (CNAs) provide the most direct day-to-day assistance: bathing, dressing, feeding, and mobility. Nurse aide hours are typically the largest staffing category and directly affect residents' quality of life. 1h 53m per day ▼ 15% State avg: 2h 13m per day · National avg: 2h 21m per day
Weekend Total Nursing Info Combined nursing hours (RN + LPN + Nurse Aide) per resident per day on weekends. Staffing often drops on weekends — this figure reveals whether the facility maintains adequate coverage outside of weekday hours. 2h 47m per day ▼ 15% State avg: 3h 17m per day · National avg: 3h 26m per day
Physical Therapist Info Hours per resident per day provided by licensed Physical Therapists (PTs) or PT Assistants. PT services help residents recover mobility after injury or illness and are especially important for post-acute (short-stay) rehabilitation. 5m per day ▲ 7% State avg: 5m per day · National avg: 4m per day
Weekend RN Info Registered nurse hours specifically on weekends. Facilities sometimes reduce RN presence on Saturdays and Sundays — a low weekend RN figure compared to weekday hours can indicate reduced clinical oversight when most administrative staff are absent. 22m per day ▼ 38% State avg: 36m per day · National avg: 29m per day

Capacity and availability

This home is often near full

Higher occupancy than the state average
Occupancy rate
115.3% Rank #171 / 221Occupancy rate — State benchmarkedThis home is ranked 171st out of 221 homes in Colorado. Shows this facility's occupancy rate versus the Colorado average, with its Statewide rank out of 221. Higher occupancy signals strong local demand and financial stability.Rankings are based only on facilities in Colorado that report data for that category. Facilities without available data are excluded from the ranking.Click the rank badge to see the full State ranking.Click here to see the full State ranking.
Avg. Length of Stay
226 days
Bed community size
85-bed community Rank #222 / 533Bed count — State benchmarkedThis home is ranked 222nd out of 533 homes in Colorado. Shows this facility's certified or reported bed count compared to other Colorado facilities. Larger communities may offer more amenities, programs, and on-site services for residents and families.Rankings are based only on facilities in Colorado that report data for that category. Facilities without available data are excluded from the ranking.Click the rank badge to see the full State ranking.Click here to see the full State ranking.
A larger shared setting that may offer more common spaces and organized community services.
Years in operation
25 years in operation
A longer operating history, which may indicate experience navigating regulations and delivering ongoing care.
Walk Score
Walk Score: 20 / 100 Rank #749 / 872Walk Score — State benchmarkedThis home is ranked 749th out of 872 homes in Colorado. Shows how walkable this facility's neighborhood is compared to the average Walk Score across Colorado facilities. Higher scores benefit residents, families, and staff.Rankings are based only on facilities in Colorado that report data for that category. Facilities without available data are excluded from the ranking.Click the rank badge to see the full State ranking.Click here to see the full State ranking.
Car-dependent. Most errands require a car, with limited nearby walkable options.
BBB Rating
BBB Rating: A+ (Not Accredited)
An independent rating from the Better Business Bureau based on factors such as complaint history, transparency, and business practices.
How BBB ratings work

Staffing

Key information about the people who lead and staff this community.

Leadership

ContactMr. Larry Lavelle

Contact Skyline Ridge Skilled Nursing & Rehab in Cañon City, CO

Inspection History

In Colorado, the Department of Public Health and Environment, Health Facilities Division is the regulatory body that performs unannounced surveys and publishes facility inspection findings.

Since 2022 · 4 years of data 80 deficiencies

Inspection Scorecard Info This scorecard compares key inspection, deficiency, and complaint metrics at this facility against the Colorado state average. Metrics rated ≥15% worse than average are highlighted in red; those ≥15% better are highlighted in green.

Since 2022 vs. Colorado state average
Overall vs. CO average 2 Worse Metrics worse than Colorado average:
• Total deficiencies (167% above)
• Deficiencies per year (167% above)
0 Better No metrics in this bucket.
Latest Inspection December 9, 2025 Complaint Investigation

Deficiencies Info Deficiencies are formal regulatory issues recorded during state inspections.

This FacilityCO Averagevs. CO Avg
Total deficiencies Info Formal regulatory issues recorded by inspectors across all inspection types. 8030 This facility has 167% more total deficiencies than a typical Colorado assisted living residence (80 vs. CO avg 30).↑ 167% worse
Deficiencies per year Info Average deficiencies per year since 2022. 207.5 This facility has 167% more deficiencies per year than a typical Colorado assisted living residence (20 vs. CO avg 7.5).↑ 167% worse

Inspection Reports Summary Info An editor-reviewed summary of the themes and findings across this facility's recent inspection reports.

  • December 9, 2025 complaint investigation found failure to prevent and report physical abuse between residents, resulting in facial injuries and staff failures in supervision and safety measures.
  • September 19, 2024 complaint and annual inspections identified 14 deficiencies including failure to prevent abuse, timely abuse reporting, fall prevention causing fracture, medication errors, and poor infection control.
  • January 16, 2025 routine inspection found two infection control deficiencies related to COVID-19 vaccine documentation and infection preventionist qualifications, with no immediate jeopardy or harm-level citations.

Health Inspection History

Inspections since 2022
Total health inspections 4

State average N/A


Last Health inspection on Jan 2025

Total health citations
35 Rank #170 / 221Health citations — State benchmarkedThis home is ranked 170th out of 221 homes in Colorado. Shows this facility's total health deficiency citations benchmarked to the Colorado State average, with a ranking across all 221 CO facilities. Lower citation counts earn a better rank.Rankings are based only on facilities in Colorado that report data for that category. Facilities without available data are excluded from the ranking.Click the rank badge to see the full State ranking.Click here to see the full State ranking.

State average N/A

Citations per inspection
8.75 Rank #205 / 221Citations per inspection — State benchmarkedThis home is ranked 205th out of 221 homes in Colorado. Shows average deficiency citations per CMS inspection for this facility versus the Colorado mean across 221 facilities with citation data. Lower is better.Rankings are based only on facilities in Colorado that report data for that category. Facilities without available data are excluded from the ranking.Click the rank badge to see the full State ranking.Click here to see the full State ranking.

State average N/A


Health citations are formal notices following inspections when they fail to comply with safety and care standards.

31 of 35 citations resulted from standard inspections; 2 of 35 resulted from complaint investigations; and 2 of 35 came from combined inspections (standard and complaint).

Breakdown of citation severity (last 4 years)
Critical health citations
0
In line with State average

State average: N/A


Serious health citations
3
In line with State average

State average: N/A

0 critical citations State average: N/A

3 serious citations State average: N/A

32 moderate citations State average: N/A

0 minor citations State average: N/A
Citations history (last 4 years)
Infection Control moderate citation Jan 16, 2025
Corrected

Infection Control moderate citation Jan 16, 2025
Corrected

Abuse/Neglect moderate citation Sep 19, 2024
Corrected

Abuse/Neglect moderate citation Sep 19, 2024
Corrected

Staffing Data

Reporting period: October 1 – December 31, 2025 (Q4 2025). Source: CMS Payroll-Based Journal report.

Total staff 139
Employees 77
Contractors 62
Staff to resident ratio 1.78 : 1
0% compared with State average

State average ratio: 0 : 0

Avg staff/day 34
Average shift 7.6 hours
0% compared with State average

State average: 0 hours

Total staff hours (quarter) 23,639

Nursing staff breakdown

Q4 2025 · Oct 1 – Dec 31 More info This data comes from the CMS Payroll-Based Journal report covering October 1 – December 31, 2025.
Registered Nurse

Manages medical care and health needs.

RN Staff Info 17 total: 9 full-time employees and 8 contractors. 17
Average shift length Info Average shift length. Calculated as total hours divided by days worked and average staff per day. 9.5 hours
Licensed Practical Nurse

Assists with medical care and medications.

LPN Staff Info 30 total: 10 full-time employees and 20 contractors. 30
Average shift length Info Average shift length. Calculated as total hours divided by days worked and average staff per day. 10.5 hours
Certified Nursing Assistant

Helps with daily care and mobility.

CNA Staff Info 70 total: 39 full-time employees and 31 contractors. 70
Average shift length Info Average shift length. Calculated as total hours divided by days worked and average staff per day. 7.2 hours

Contractor staffing

Q4 2025 · Oct 1 – Dec 31 More info This data comes from the CMS Payroll-Based Journal report covering October 1 – December 31, 2025.

Total hours from contractors

5.3%

1,248 contractor hours this quarter

Certified Nursing Assistant: 31 Licensed Practical Nurse: 20 Registered Nurse: 8 Occupational Therapy Aide: 1 Physical Therapy Assistant: 1 Medical Director: 1

Staff by category

Q4 2025 · Oct 1 – Dec 31 More info This data comes from the CMS Payroll-Based Journal report covering October 1 – December 31, 2025.
Certified Nursing Assistant39317012,32992100%7.2
Licensed Practical Nurse1020303,86892100%10.5
Registered Nurse98172,5219199%9.5
Clinical Nurse Specialist5059636571%7.7
Occupational Therapy Aide2138228289%6.8
Respiratory Therapy Technician3035836470%6.2
Dental Services Staff1015045863%8.7
RN Director of Nursing1014826166%7.9
Administrator1014806470%7.5
Speech Language Pathologist1013333639%9.2
Physical Therapy Aide1013124953%6.4
Other Dietary Services Staff2022574347%6
Medical Director011736166%1.2
Physical Therapy Assistant112701820%3.9
Qualified Activities Professional10144910%4.9
70 Certified Nursing Assistant
% of Days 100%
30 Licensed Practical Nurse
% of Days 100%
17 Registered Nurse
% of Days 99%
5 Clinical Nurse Specialist
% of Days 71%
3 Occupational Therapy Aide
% of Days 89%
3 Respiratory Therapy Technician
% of Days 70%
1 Dental Services Staff
% of Days 63%
1 RN Director of Nursing
% of Days 66%
1 Administrator
% of Days 70%
1 Speech Language Pathologist
% of Days 39%
1 Physical Therapy Aide
% of Days 53%
2 Other Dietary Services Staff
% of Days 47%
1 Medical Director
% of Days 66%
2 Physical Therapy Assistant
% of Days 20%
1 Qualified Activities Professional
% of Days 10%

Penalties and fines

Includes penalties issued in 2024

Federal penalties imposed by CMS for regulatory violations, including civil money penalties (fines) and denials of payment for new Medicare/Medicaid admissions.

Source: CMS Penalties Database (Data as of Jan 2026)

Total fines amount $21K Rank #138 / 221Federal fines — State benchmarkedThis home is ranked 138th out of 221 homes in Colorado. Shows this facility's cumulative CMS federal fine dollars versus the Colorado average among facilities with fines, and where it ranks among 221 facilities in the pool. Lower total dollars mean a better rank.Rankings are based only on facilities in Colorado that report data for that category. Facilities without available data are excluded from the ranking.Click the rank badge to see the full State ranking.Click here to see the full State ranking.
46% lower than State average

State average: $40K

Number of fines 1
55% fewer fines than State average

State average: 2.2

Payment Denials Info Serious action where Medicare and/or Medicaid temporarily stops payments for new residents until issues are fixed. 0
100% fewer payment denials than State average

State average: 0.3

Fines amount comparison
This facility $21K
State average $40K
Penalty History

Penalties are imposed by CMS for violations of federal nursing home regulations.

1 penalty in the past 3 years

Sep 19, 2024 · $21K

Civil Money Penalty Info Fines imposed for noncompliance, which can be assessed per day or per instance of violation. Sep 19, 2024
$21K

Last updated: Jan 2026

Quality of care over time

These measures show how residents usually do over time at this home, based on health outcomes and preventive care.

High-risk clinical events score Info A composite score based on pressure ulcers, falls with injury, weight loss, walking ability decline, and activities of daily living decline. 12.5
39% worse than State average

State average: 9.0

Functional decline score Info A composite score based on activities of daily living decline, walking ability decline, and incontinence. 23.5
25% worse than State average

State average: 18.8

Long-stay resident measures
Average State avg: 3.9 Info CMS star rating based on long-stay quality measure performance. 5 stars = significantly above average, 1 star = significantly below average.
Need for Help with Daily Activities Increased Info Percent of long-stay residents whose need for help with daily activities has increased 23.7%
48% worse than State average

State average: 16.0%

Walking Ability Worsened Info Percent of long-stay residents whose ability to move independently worsened 22.4%
32% worse than State average

State average: 17.0%

Low Risk Residents with Bowel/Bladder Incontinence Info Percent of low risk long-stay residents who lose control of their bowels or bladder 24.3%
5% worse than State average

State average: 23.2%

Falls with Major Injury Info Percent of long-stay residents experiencing one or more falls with major injury 6.2%
87% worse than State average

State average: 3.3%

High Risk Residents with Pressure Ulcers Info Percent of long-stay high risk residents with pressure ulcers 2.7%
30% better than State average

State average: 3.9%

Urinary Tract Infection Info Percent of long-stay residents with a urinary tract infection 2.8%
93% worse than State average

State average: 1.4%

Lost Too Much Weight Info Percent of long-stay residents who lose too much weight 7.6%
45% worse than State average

State average: 5.2%

Depressive Symptoms Info Percent of long-stay residents who have depressive symptoms 5.8%
19% better than State average

State average: 7.2%

Antipsychotic Use Info Percent of long-stay residents who received an antipsychotic medication 17.5%
7% better than State average

State average: 18.8%

Pneumococcal Vaccine Info Percent of long-stay residents assessed and appropriately given the pneumococcal vaccine 92.2%
In line with State average

State average: 93.3%

Influenza Vaccine Info Percent of long-stay residents assessed and appropriately given the seasonal influenza vaccine 84.5%
11% worse than State average

State average: 94.7%

Hospitalizations per 1,000 days Info Number of hospitalizations per 1,000 long-stay resident days. 0.30
77% better than State average

State average: 1.30

ED visits per 1,000 days Info Number of outpatient emergency department visits per 1,000 long-stay resident days. 1.69
In line with State average

State average: 1.67

Short-stay resident measures
Above average State avg: 2.7 Info CMS star rating based on short-stay quality measure performance. 5 stars = much above average, 1 star = much below average.
Pneumococcal Vaccine Info Percent of short-stay residents assessed and appropriately given the pneumococcal vaccine 61.6%
20% worse than State average

State average: 76.6%

Antipsychotic medication increase Info Percent of short-stay residents who newly received an antipsychotic medication 0.0%
100% better than State average

State average: 1.4%

Influenza Vaccine Info Percent of short-stay residents assessed and appropriately given the seasonal influenza vaccine 36.2%
52% worse than State average

State average: 75.6%

Re-hospitalized after SNF stay Info Percentage of short-stay residents who were re-hospitalized after their nursing home admission. 3.9%
81% better than State average

State average: 20.3%

Emergency department visits Info Percentage of short-stay residents who had an outpatient emergency department visit. 20.3%
59% worse than State average

State average: 12.8%

Falls with major injury Info Percentage of SNF residents who experience falls with major injury during their stay. 0.0%
100% better than State average

State average: 0.8%

Ability to care for self at discharge Info Percentage of residents at or above expected ability to care for themselves at discharge. 67.9%
26% better than State average

State average: 53.7%

Successful return to home or community Info Rate of successful return to home or community from a skilled nursing facility. 50.6%
In line with State average

State average: 50.6%

Breakdown by payment type

Medicare

43% of new residents, usually for short-term rehab.

Typical stay 30 days

Private pay

36% of new residents, often for short stays.

Typical stay 4 months

Medicaid

20% of new residents, often for long-term daily care.

Typical stay 1 - 2 years

Facility Characteristics

Source: CMS Long-Term Care Facility Characteristics (Data as of Jan 2026)

Total residents 78
Medicare
5
6.4% of residents
Medicaid
52
66.7% of residents
Private pay or other
21
26.9% of residents
Programs & Services
Residents Group

Residents meet regularly to discuss policies, care quality, and activities

Active Resident Council

Organized group of residents that meets regularly to discuss facility policies, quality of life, and activities.

Finances and operations

Based on CMS SNF Cost Report for fiscal year ending in 12/2023.

For-profit
Corporation
Net patient revenue Info Net patient revenue — what the home actually collects for resident care, after contractual allowances, bad debt and discounts are subtracted from its gross charges (CMS cost report, Worksheet G-3). It covers resident care only; money the home earns from other sources is shown separately as "Other income."
$8.7M
Net patient income Info Net patient income: net patient revenue minus the home's total operating expenses. A positive figure means it earns more from resident care than it spends to deliver it; a negative figure means the opposite. It excludes non-operating "other income."
-$448.0K
For-profit Corporation
Net patient revenue Info Net patient revenue — what the home actually collects for resident care, after contractual allowances, bad debt and discounts are subtracted from its gross charges (CMS cost report, Worksheet G-3). It covers resident care only; money the home earns from other sources is shown separately as "Other income."
$8.7M Rank #137 / 221Revenue — State benchmarkedThis home is ranked 137th out of 221 homes in Colorado. Shows this facility's annual revenue compared to the Colorado average. Higher revenue generally means more resources for staffing and capital — read alongside Payroll %.Rankings are based only on facilities in Colorado that report data for that category. Facilities without available data are excluded from the ranking.Click the rank badge to see the full State ranking.Click here to see the full State ranking.
Net patient income Info Net patient income: net patient revenue minus the home's total operating expenses. A positive figure means it earns more from resident care than it spends to deliver it; a negative figure means the opposite. It excludes non-operating "other income."
-$448.0K
Other income Info Money the home earns outside of resident care — such as investments, grants, rentals and other non-operating sources (CMS cost report, Worksheet G-3). It is tracked separately from net patient revenue: it is not part of that figure, and it is not included in net patient income.
$449.4K
Payroll costs Info Staff salaries plus wage-related costs — benefits such as payroll taxes, health insurance and retirement — from the home's own accounting records (CMS cost report, Worksheet A). Contract or agency labor is counted separately, under other operating costs. Rank #113 / 221Payroll — State benchmarkedThis home is ranked 113th out of 221 homes in Colorado. Shows total annual staff payroll benchmarked to the Colorado average. Higher payroll investment relative to peers often signals better staffing and less reliance on cheaper contract labor.Rankings are based only on facilities in Colorado that report data for that category. Facilities without available data are excluded from the ranking.Click the rank badge to see the full State ranking.Click here to see the full State ranking.
$5.7M 66.1% of net patient revenue Info Payroll as a share of revenue: staff salaries and wage-related benefits divided by net patient revenue. A higher figure means more of each revenue dollar goes to staff pay. Rank #61 / 221Payroll % — State benchmarkedThis home is ranked 61st out of 221 homes in Colorado. Shows payroll as a percentage of revenue versus the Colorado average. Well-run Colorado facilities typically land around 59–66% — the top third Statewide. Below 25% may signal understaffing or heavy agency use — read with Staffing ratings.Rankings are based only on facilities in Colorado that report data for that category. Facilities without available data are excluded from the ranking.Click the rank badge to see the full State ranking.Click here to see the full State ranking.
Other operating costs Info Everything it costs to run the home apart from payroll — food, utilities, supplies, maintenance, contract labor and administration. Calculated as total operating expense minus payroll (staff salaries and wage-related benefits).
$3.4M
Total costs Info The home's total operating expense for the year — all the costs of running it, salaries included (CMS cost report, Worksheet G-3).
$9.2M

What does this home offer?

Building type icon
Building type icon

Building Type: Single-story

Transportation services icon

Transportation Services

Fitness and recreation icon

Fitness and Recreation

Who this home usually serves

TYPE OF STAY

Mostly short-term rehab stays

Most residents typically stay for a few weeks or months before returning home or moving on.

New residents most often arrive under Medicare (43% of admissions), and a typical Medicare stay runs around 30 days.

Admissions
160 total

Coverage residents most often arrive under.

Medicare 43%
Private pay 36%
Medicaid 20%
Discharges
126 total

Coverage residents most often leave under.

Medicare 19%
Private pay 52%
Medicaid 29%

Places of interest near Skyline Ridge Skilled Nursing & Rehab in Cañon City, CO

Address 1.4 miles from city center Info Estimated distance in miles from Cañon City's city center to Skyline Ridge Skilled Nursing & Rehab in Cañon City, CO's address, calculated via Google Maps.

Calculate Travel Distance to Skyline Ridge Skilled Nursing & Rehab in Cañon City, CO

Add your location

Address

Compare Nursing Homes around the area

The information below is reported by the Colorado Department of Public Health and Environment, Health Facilities Division.

Skyline Ridge Skilled Nursing & Rehab in Cañon City, CO
NH
Cañon City -85 A+ 20 -
Brookdale Greenwood Village
NH
AL
IL
MC
Greenwood Village -90 B- 71 Studio / 1 Bed / Semi-Private / Private
Life Care Center of Westminster
NH
Westminster (South Westminster) -120 A+ 73 1 Bed / 2 Bed
Life Care Center of Colorado Springs
NH
Colorado Springs (Southeast Colorado Springs) -121 A+ 63 -
Peaks Care Center
NH
AL
IL
Longmont (Coffman Street) -92 A+ 80 -

Frequently Asked Questions about Skyline Ridge Skilled Nursing & Rehab in Cañon City, CO

Is Skyline Ridge Skilled Nursing & Rehab in Cañon City, CO in a walkable area?

Skyline Ridge Skilled Nursing & Rehab in Cañon City, CO has a walk score of 20. Car-dependent. Most errands require a car, with limited nearby walkable options.

What is the occupancy rate at Skyline Ridge Skilled Nursing & Rehab in Cañon City, CO?

Skyline Ridge Skilled Nursing & Rehab in Cañon City, CO's occupancy is 91.9%.

Does Skyline Ridge Skilled Nursing & Rehab in Cañon City, CO operate as a for-profit or non-profit?

Skyline Ridge Skilled Nursing & Rehab in Cañon City, CO is registered as a for-profit in CO.

Are there photos of Skyline Ridge Skilled Nursing & Rehab in Cañon City, CO?

Yes — there are 4 photos of Skyline Ridge Skilled Nursing & Rehab in Cañon City, CO in the photo gallery on this page.

What is the address of Skyline Ridge Skilled Nursing & Rehab in Cañon City, CO?

Skyline Ridge Skilled Nursing & Rehab in Cañon City, CO is located at 515 Fairview Ave, Cañon City, CO 81212.

What is the phone number of Skyline Ridge Skilled Nursing & Rehab in Cañon City, CO?

(719) 275-0665 will put you in contact with the team at Skyline Ridge Skilled Nursing & Rehab in Cañon City, CO.

Is Skyline Ridge Skilled Nursing & Rehab in Cañon City, CO Medicare or Medicaid certified?

Yes — Skyline Ridge Skilled Nursing & Rehab in Cañon City, CO is a CMS-certified provider of Medicare and Medicaid.

Guides for Better Senior Living

Care Cost Calculator: See Prices in Your Area

Nursing Home Data Explorer

Don’t Wait Too Long: 7 Red Flag Signs Your Parent Needs Assisted Living Now

The True Cost of Assisted Living in 2025 – And How Families Are Paying For It

Understanding Senior Living Costs: Pricing Models, Discounts & Financial Assistance