Willow Tree Care Center Skilled Nursing & Rehab
CMS overall rating Info CMS (the Centers for Medicare & Medicaid Services) is the federal agency that rates nursing home quality. Its Overall Rating runs from 1 to 5 stars, combining health inspections, staffing, and quality measures, with inspections weighted most heavily.

Willow Tree Care Center Skilled Nursing & Rehab

CMS overall rating Info CMS (the Centers for Medicare & Medicaid Services) is the federal agency that rates nursing home quality. Its Overall Rating runs from 1 to 5 stars, combining health inspections, staffing, and quality measures, with inspections weighted most heavily.
Calculator: See prices in your area
Willow Tree Care Center Skilled Nursing & Rehab accepts Medicare, Medicaid, and private pay.

Overview of Willow Tree Care Center Skilled Nursing & Rehab

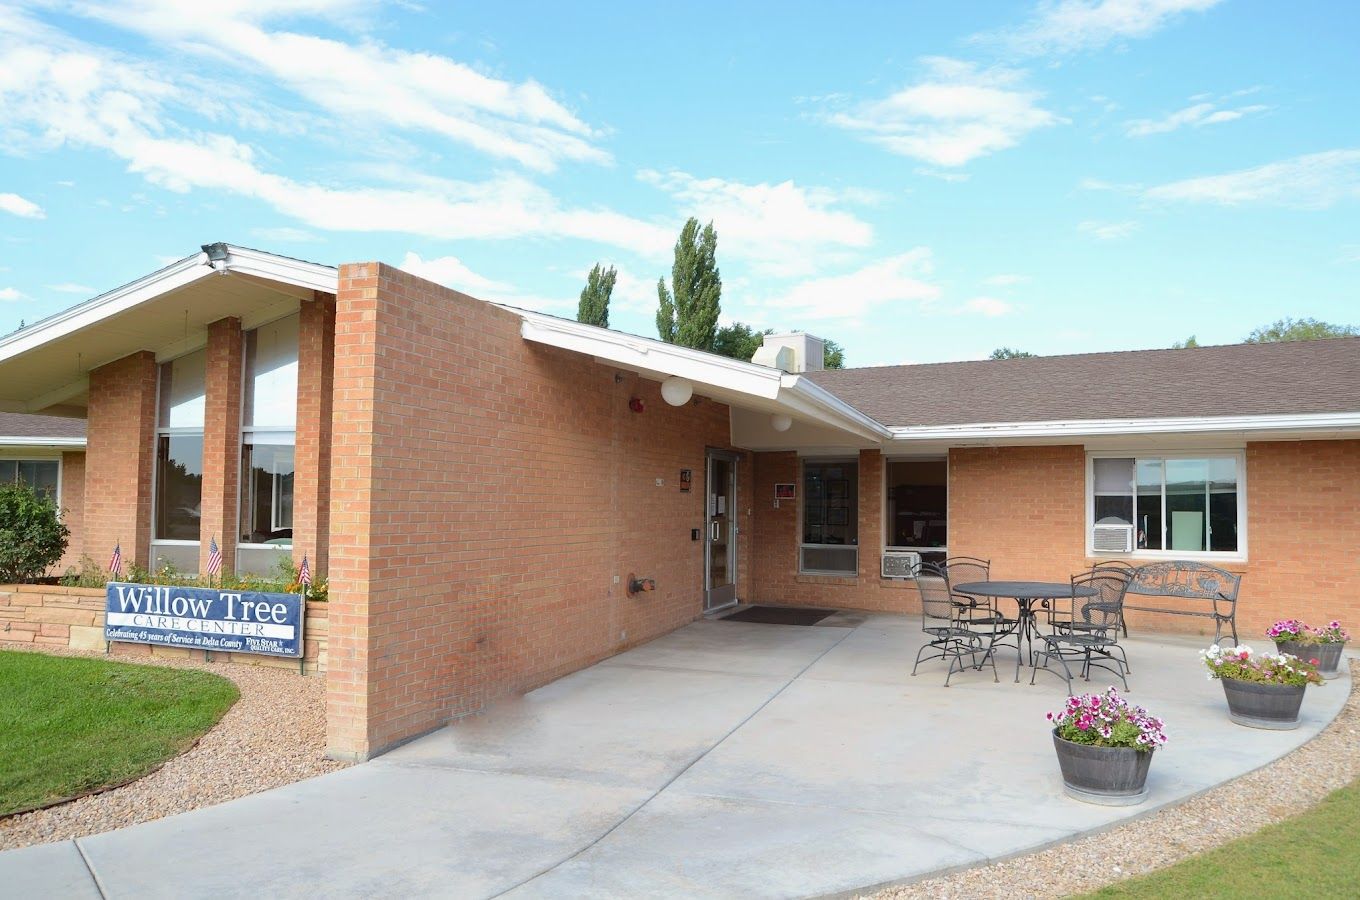
Willow Tree Care Center is a tight-knit senior living community in Delta, CO, offering skilled nursing, rehabilitation, and short-term stays, providing a supportive environment for seniors recovering from health setbacks or experiencing a decline in quality of life. The community ensures seniors enjoy daily housekeeping, chef-prepared meals, and a variety of social activities, creating a comfortable and engaging living space.

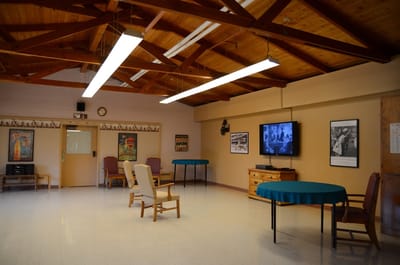
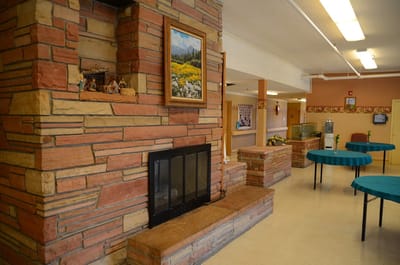
The community aims to make residents glad they chose their community, focusing on healing and comfort. Amenities include a beauty salon, weekly shuttle bus excursions, and a call-light system in every room. With individually controlled heating and the freedom to personalize their rooms, residents feel at home while receiving top-notch care.

Quality ratings

Measured by Centers for Medicare & Medicaid Services (CMS)

Overall rating Info The Overall CMS Rating combines results from health inspections, staffing levels and quality measures. Health inspections carry the most weight. Staffing and quality scores can increase or decrease the final rating based on performance compared to state and national standards.
Health Inspection Info Based on the results of the facility's three most recent standard inspections and any complaint investigations. CMS reviews the number, scope, and severity of deficiencies, with more recent findings weighted more heavily.
Staffing Info Measures average nursing staff hours per resident per day, including Registered Nurses (RNs) and total nursing staff. Ratings are adjusted based on the level of care residents require and are compared to state and national benchmarks.
Quality Measures Info Based on clinical and physical health indicators reported to CMS, such as hospital readmissions, falls, pressure ulcers, and improvements in mobility. These measures reflect how well residents' health needs are being managed.

Staffing hours breakdown

Info Daily nursing hours per resident by staff type, reported to CMS. Higher is generally better — compare this facility to state and national averages to see where staffing stands.

Hours per resident per day — compared to state averages

Total nursing care / resident Info Total adjusted nursing hours per resident per day, combining RN, LPN, and aide time. CMS adjusts this for case-mix so facilities can be fairly compared.
3h 51m per day
Rank #80 / 215Nurse hours — State benchmarkedThis home is ranked 80th out of 215 homes in Colorado. Shows adjusted nurse hours per resident per day benchmarked to the Colorado average, with a ranking across 215 Colorado facilities. More hours mean more direct care. The national average is about 3.5 hrs; below 3.0 is a red flag.Rankings are based only on facilities in Colorado that report data for that category. Facilities without available data are excluded from the ranking.Click the rank badge to see the full State ranking.Click here to see the full State ranking.
vs avg

3 of 6 metrics below state avg

Standout metric Physical Therapist is +56% above state avg
Staff typeHours / Day / Residentvs state avg
Registered Nurse (RN) Info RNs hold the highest nursing license and can assess residents, interpret test results, and direct care plans. More RN hours per day often signals stronger clinical oversight and faster response to health changes. 51m per day ■ Avg State avg: 50m per day · National avg: 41m per day
LPN / LVN Info Licensed Practical Nurses (LPNs) or Licensed Vocational Nurses (LVNs) deliver routine hands-on care — medication administration, wound dressing, and monitoring vital signs. They work under RN supervision and make up a large share of daily bedside care. 41m per day ■ Avg State avg: 41m per day · National avg: 52m per day
Nurse Aide Info Certified Nurse Aides (CNAs) provide the most direct day-to-day assistance: bathing, dressing, feeding, and mobility. Nurse aide hours are typically the largest staffing category and directly affect residents' quality of life. 1h 47m per day ▼ 20% State avg: 2h 13m per day · National avg: 2h 21m per day
Weekend Total Nursing Info Combined nursing hours (RN + LPN + Nurse Aide) per resident per day on weekends. Staffing often drops on weekends — this figure reveals whether the facility maintains adequate coverage outside of weekday hours. 2h 51m per day ▼ 13% State avg: 3h 17m per day · National avg: 3h 26m per day
Physical Therapist Info Hours per resident per day provided by licensed Physical Therapists (PTs) or PT Assistants. PT services help residents recover mobility after injury or illness and are especially important for post-acute (short-stay) rehabilitation. 8m per day ▲ 56% State avg: 5m per day · National avg: 4m per day
Weekend RN Info Registered nurse hours specifically on weekends. Facilities sometimes reduce RN presence on Saturdays and Sundays — a low weekend RN figure compared to weekday hours can indicate reduced clinical oversight when most administrative staff are absent. 34m per day ▼ 6% State avg: 36m per day · National avg: 29m per day

Capacity and availability

This home usually has availability

Lower occupancy than the state average
Occupancy rate
53.1% Rank #180 / 221Occupancy rate — State benchmarkedThis home is ranked 180th out of 221 homes in Colorado. Shows this facility's occupancy rate versus the Colorado average, with its Statewide rank out of 221. Higher occupancy signals strong local demand and financial stability.Rankings are based only on facilities in Colorado that report data for that category. Facilities without available data are excluded from the ranking.Click the rank badge to see the full State ranking.Click here to see the full State ranking.
Avg. Length of Stay
135 days
Bed community size
80-bed community Rank #237 / 533Bed count — State benchmarkedThis home is ranked 237th out of 533 homes in Colorado. Shows this facility's certified or reported bed count compared to other Colorado facilities. Larger communities may offer more amenities, programs, and on-site services for residents and families.Rankings are based only on facilities in Colorado that report data for that category. Facilities without available data are excluded from the ranking.Click the rank badge to see the full State ranking.Click here to see the full State ranking.
A larger shared setting that may offer more common spaces and organized community services.
Walk Score
Walk Score: 12 / 100 Rank #796 / 872Walk Score — State benchmarkedThis home is ranked 796th out of 872 homes in Colorado. Shows how walkable this facility's neighborhood is compared to the average Walk Score across Colorado facilities. Higher scores benefit residents, families, and staff.Rankings are based only on facilities in Colorado that report data for that category. Facilities without available data are excluded from the ranking.Click the rank badge to see the full State ranking.Click here to see the full State ranking.
Car-dependent. Most errands require a car, with limited nearby walkable options.

Contact Willow Tree Care Center Skilled Nursing & Rehab

Staffing Data

Reporting period: October 1 – December 31, 2025 (Q4 2025). Source: CMS Payroll-Based Journal report.

Total staff 108
Employees 71
Contractors 37
Staff to resident ratio 2.57 : 1
0% compared with State average

State average ratio: 0 : 0

Avg staff/day 27
Average shift 8.2 hours
0% compared with State average

State average: 0 hours

Total staff hours (quarter) 20,403

Nursing staff breakdown

Q4 2025 · Oct 1 – Dec 31 More info This data comes from the CMS Payroll-Based Journal report covering October 1 – December 31, 2025.
Registered Nurse

Manages medical care and health needs.

RN Staff Info 11 total: 7 full-time employees and 4 contractors. 11
Average shift length Info Average shift length. Calculated as total hours divided by days worked and average staff per day. 10.7 hours
Licensed Practical Nurse

Assists with medical care and medications.

LPN Staff Info 20 total: 11 full-time employees and 9 contractors. 20
Average shift length Info Average shift length. Calculated as total hours divided by days worked and average staff per day. 9.8 hours
Certified Nursing Assistant

Helps with daily care and mobility.

CNA Staff Info 55 total: 32 full-time employees and 23 contractors. 55
Average shift length Info Average shift length. Calculated as total hours divided by days worked and average staff per day. 8.2 hours

Contractor staffing

Q4 2025 · Oct 1 – Dec 31 More info This data comes from the CMS Payroll-Based Journal report covering October 1 – December 31, 2025.

Total hours from contractors

11.6%

2,367 contractor hours this quarter

Certified Nursing Assistant: 23 Licensed Practical Nurse: 9 Registered Nurse: 4 Medical Director: 1

Staff by category

Q4 2025 · Oct 1 – Dec 31 More info This data comes from the CMS Payroll-Based Journal report covering October 1 – December 31, 2025.
Certified Nursing Assistant3223559,13192100%8.2
Licensed Practical Nurse119203,06092100%9.8
Registered Nurse74112,92692100%10.7
Other Dietary Services Staff4041,2938997%7.2
Clinical Nurse Specialist3039366773%6.8
Respiratory Therapy Technician4046656470%5.7
Dental Services Staff1015296874%7.8
RN Director of Nursing1014806470%7.5
Nurse Practitioner1014736368%7.5
Administrator2022483336%7.5
Dietitian1012203235%6.9
Physical Therapy Assistant2021773942%4.1
Speech Language Pathologist1011244852%2.6
Occupational Therapy Aide101901213%7.5
Medical Director011511415%3.6
55 Certified Nursing Assistant
% of Days 100%
20 Licensed Practical Nurse
% of Days 100%
11 Registered Nurse
% of Days 100%
4 Other Dietary Services Staff
% of Days 97%
3 Clinical Nurse Specialist
% of Days 73%
4 Respiratory Therapy Technician
% of Days 70%
1 Dental Services Staff
% of Days 74%
1 RN Director of Nursing
% of Days 70%
1 Nurse Practitioner
% of Days 68%
2 Administrator
% of Days 36%
1 Dietitian
% of Days 35%
2 Physical Therapy Assistant
% of Days 42%
1 Speech Language Pathologist
% of Days 52%
1 Occupational Therapy Aide
% of Days 13%
1 Medical Director
% of Days 15%

Penalties and fines

Federal penalties imposed by CMS for regulatory violations, including civil money penalties (fines) and denials of payment for new Medicare/Medicaid admissions.

Source: CMS Penalties Database

No penalties in the past 3 years

No civil money penalties or payment denials were reported in the last 3 years.

Quality of care over time

These measures show how residents usually do over time at this home, based on health outcomes and preventive care.

High-risk clinical events score Info A composite score based on pressure ulcers, falls with injury, weight loss, walking ability decline, and activities of daily living decline. 15.6
73% worse than State average

State average: 9.0

Functional decline score Info A composite score based on activities of daily living decline, walking ability decline, and incontinence. 29.0
54% worse than State average

State average: 18.8

Long-stay resident measures
Below average State avg: 3.9 Info CMS star rating based on long-stay quality measure performance. 5 stars = significantly above average, 1 star = significantly below average.
Need for Help with Daily Activities Increased Info Percent of long-stay residents whose need for help with daily activities has increased 34.7%
116% worse than State average

State average: 16.0%

Walking Ability Worsened Info Percent of long-stay residents whose ability to move independently worsened 25.5%
50% worse than State average

State average: 17.0%

Low Risk Residents with Bowel/Bladder Incontinence Info Percent of low risk long-stay residents who lose control of their bowels or bladder 26.9%
16% worse than State average

State average: 23.2%

Falls with Major Injury Info Percent of long-stay residents experiencing one or more falls with major injury 5.6%
68% worse than State average

State average: 3.3%

High Risk Residents with Pressure Ulcers Info Percent of long-stay high risk residents with pressure ulcers 7.3%
89% worse than State average

State average: 3.9%

Urinary Tract Infection Info Percent of long-stay residents with a urinary tract infection 3.8%
165% worse than State average

State average: 1.4%

Lost Too Much Weight Info Percent of long-stay residents who lose too much weight 4.8%
7% better than State average

State average: 5.2%

Depressive Symptoms Info Percent of long-stay residents who have depressive symptoms 2.1%
71% better than State average

State average: 7.2%

Antipsychotic Use Info Percent of long-stay residents who received an antipsychotic medication 29.3%
56% worse than State average

State average: 18.8%

Pneumococcal Vaccine Info Percent of long-stay residents assessed and appropriately given the pneumococcal vaccine 97.5%
5% better than State average

State average: 93.3%

Influenza Vaccine Info Percent of long-stay residents assessed and appropriately given the seasonal influenza vaccine 91.5%
In line with State average

State average: 94.7%

Hospitalizations per 1,000 days Info Number of hospitalizations per 1,000 long-stay resident days. 0.37
72% better than State average

State average: 1.30

ED visits per 1,000 days Info Number of outpatient emergency department visits per 1,000 long-stay resident days. 2.21
32% worse than State average

State average: 1.67

Short-stay resident measures
Average State avg: 2.7 Info CMS star rating based on short-stay quality measure performance. 5 stars = much above average, 1 star = much below average.
Pneumococcal Vaccine Info Percent of short-stay residents assessed and appropriately given the pneumococcal vaccine 82.9%
8% better than State average

State average: 76.6%

Antipsychotic medication increase Info Percent of short-stay residents who newly received an antipsychotic medication 0.0%
100% better than State average

State average: 1.4%

Influenza Vaccine Info Percent of short-stay residents assessed and appropriately given the seasonal influenza vaccine 85.7%
13% better than State average

State average: 75.6%

Re-hospitalized after SNF stay Info Percentage of short-stay residents who were re-hospitalized after their nursing home admission. 14.8%
27% better than State average

State average: 20.3%

Emergency department visits Info Percentage of short-stay residents who had an outpatient emergency department visit. 34.3%
168% worse than State average

State average: 12.8%

Falls with major injury Info Percentage of SNF residents who experience falls with major injury during their stay. 0.0%
100% better than State average

State average: 0.8%

Ability to care for self at discharge Info Percentage of residents at or above expected ability to care for themselves at discharge. 56.0%
In line with State average

State average: 53.7%

Successful return to home or community Info Rate of successful return to home or community from a skilled nursing facility. 58.1%
15% better than State average

State average: 50.6%

Breakdown by payment type

Medicare

39% of new residents, usually for short-term rehab.

Typical stay 1 - 2 months

Private pay

43% of new residents, often for short stays.

Typical stay 3 - 4 months

Medicaid

18% of new residents, often for long-term daily care.

Typical stay 1 - 2 years

Facility Characteristics

Source: CMS Long-Term Care Facility Characteristics (Data as of Jan 2026)

Total residents 42
Medicare
4
9.5% of residents
Medicaid
28
66.7% of residents
Private pay or other
10
23.8% of residents
Programs & Services
Residents Group

Residents meet regularly to discuss policies, care quality, and activities

Active Resident Council

Organized group of residents that meets regularly to discuss facility policies, quality of life, and activities.

Finances and operations

Based on CMS SNF Cost Report for fiscal year ending in 12/2023.

For-profit
Operated by a single business entity.
Net patient revenue Info Net patient revenue — what the home actually collects for resident care, after contractual allowances, bad debt and discounts are subtracted from its gross charges (CMS cost report, Worksheet G-3). It covers resident care only; money the home earns from other sources is shown separately as "Other income."
$4.9M
Net patient income Info Net patient income: net patient revenue minus the home's total operating expenses. A positive figure means it earns more from resident care than it spends to deliver it; a negative figure means the opposite. It excludes non-operating "other income."
-$420.1K
For-profit Operated by a single business entity.
Net patient revenue Info Net patient revenue — what the home actually collects for resident care, after contractual allowances, bad debt and discounts are subtracted from its gross charges (CMS cost report, Worksheet G-3). It covers resident care only; money the home earns from other sources is shown separately as "Other income."
$4.9M Rank #207 / 221Revenue — State benchmarkedThis home is ranked 207th out of 221 homes in Colorado. Shows this facility's annual revenue compared to the Colorado average. Higher revenue generally means more resources for staffing and capital — read alongside Payroll %.Rankings are based only on facilities in Colorado that report data for that category. Facilities without available data are excluded from the ranking.Click the rank badge to see the full State ranking.Click here to see the full State ranking.
Net patient income Info Net patient income: net patient revenue minus the home's total operating expenses. A positive figure means it earns more from resident care than it spends to deliver it; a negative figure means the opposite. It excludes non-operating "other income."
-$420.1K
Other income Info Money the home earns outside of resident care — such as investments, grants, rentals and other non-operating sources (CMS cost report, Worksheet G-3). It is tracked separately from net patient revenue: it is not part of that figure, and it is not included in net patient income.
$13.2K
Payroll costs Info Staff salaries plus wage-related costs — benefits such as payroll taxes, health insurance and retirement — from the home's own accounting records (CMS cost report, Worksheet A). Contract or agency labor is counted separately, under other operating costs. Rank #197 / 221Payroll — State benchmarkedThis home is ranked 197th out of 221 homes in Colorado. Shows total annual staff payroll benchmarked to the Colorado average. Higher payroll investment relative to peers often signals better staffing and less reliance on cheaper contract labor.Rankings are based only on facilities in Colorado that report data for that category. Facilities without available data are excluded from the ranking.Click the rank badge to see the full State ranking.Click here to see the full State ranking.
$3.2M 64.6% of net patient revenue Info Payroll as a share of revenue: staff salaries and wage-related benefits divided by net patient revenue. A higher figure means more of each revenue dollar goes to staff pay. Rank #34 / 221Payroll % — State benchmarkedThis home is ranked 34th out of 221 homes in Colorado. Shows payroll as a percentage of revenue versus the Colorado average. Well-run Colorado facilities typically land around 59–66% — the top third Statewide. Below 25% may signal understaffing or heavy agency use — read with Staffing ratings.Rankings are based only on facilities in Colorado that report data for that category. Facilities without available data are excluded from the ranking.Click the rank badge to see the full State ranking.Click here to see the full State ranking.
Other operating costs Info Everything it costs to run the home apart from payroll — food, utilities, supplies, maintenance, contract labor and administration. Calculated as total operating expense minus payroll (staff salaries and wage-related benefits).
$2.2M
Total costs Info The home's total operating expense for the year — all the costs of running it, salaries included (CMS cost report, Worksheet G-3).
$5.4M

What does this home offer?

Building type icon
Building type icon

Building Type: Single-story

Transportation services icon

Transportation Services

Fitness and recreation icon

Fitness and Recreation

Who this home usually serves

TYPE OF STAY

Mix of rehab and long-term care

This home supports both short-term rehab and long-term care, with residents staying for a wide range of durations.

New residents most often arrive under private pay (43% of admissions), and a typical private pay stay runs around 3 - 4 months.

Admissions
102 total

Coverage residents most often arrive under.

Medicare 39%
Private pay 43%
Medicaid 18%
Discharges
115 total

Coverage residents most often leave under.

Medicare 30%
Private pay 54%
Medicaid 17%

Places of interest near Willow Tree Care Center Skilled Nursing & Rehab

Address 1.9 miles from city center Info Estimated distance in miles from Delta's city center to Willow Tree Care Center Skilled Nursing & Rehab's address, calculated via Google Maps.

Calculate Travel Distance to Willow Tree Care Center Skilled Nursing & Rehab

Add your location

Address

Compare Nursing Homes around the area

The information below is reported by the Colorado Department of Public Health and Environment, Health Facilities Division.

Willow Tree Care Center Skilled Nursing & Rehab
NH
Delta -80 - 12 -
Brookdale Greenwood Village
NH
AL
IL
MC
Greenwood Village -90 B- 71 Studio / 1 Bed / Semi-Private / Private
Life Care Center of Westminster
NH
Westminster (South Westminster) -120 A+ 73 1 Bed / 2 Bed
Life Care Center of Colorado Springs
NH
Colorado Springs (Southeast Colorado Springs) -121 A+ 63 -
Peaks Care Center
NH
AL
IL
Longmont (Coffman Street) -92 A+ 80 -

Frequently Asked Questions about Willow Tree Care Center Skilled Nursing & Rehab

What neighborhood is Willow Tree Care Center Skilled Nursing & Rehab in?

Willow Tree Care Center Skilled Nursing & Rehab is in the Delta neighborhood.

Is Willow Tree Care Center Skilled Nursing & Rehab in a walkable area?

Willow Tree Care Center Skilled Nursing & Rehab has a walk score of 12. Car-dependent. Most errands require a car, with limited nearby walkable options.

What is the occupancy rate at Willow Tree Care Center Skilled Nursing & Rehab?

Willow Tree Care Center Skilled Nursing & Rehab's occupancy is 53.1%.

Does Willow Tree Care Center Skilled Nursing & Rehab operate as a for-profit or non-profit?

Willow Tree Care Center Skilled Nursing & Rehab is registered as a for-profit.

Are there photos of Willow Tree Care Center Skilled Nursing & Rehab?

Yes — there are 4 photos of Willow Tree Care Center Skilled Nursing & Rehab in the photo gallery on this page.

What is the address of Willow Tree Care Center Skilled Nursing & Rehab?

Willow Tree Care Center Skilled Nursing & Rehab is located at 2050 S Main St, Delta, CO 81416.

What is the phone number of Willow Tree Care Center Skilled Nursing & Rehab?

(970) 874-9773 will put you in contact with the team at Willow Tree Care Center Skilled Nursing & Rehab.

Guides for Better Senior Living

Care Cost Calculator: See Prices in Your Area

Nursing Home Data Explorer

Don’t Wait Too Long: 7 Red Flag Signs Your Parent Needs Assisted Living Now

The True Cost of Assisted Living in 2025 – And How Families Are Paying For It

Understanding Senior Living Costs: Pricing Models, Discounts & Financial Assistance