Larksfield Place Independent Living
Nursing Home, Assisted Living, Independent Living, Memory Care & Respite Care · Wichita, KS
CMS overall rating Info CMS (the Centers for Medicare & Medicaid Services) is the federal agency that rates nursing home quality. Its Overall Rating runs from 1 to 5 stars, combining health inspections, staffing, and quality measures, with inspections weighted most heavily.

Larksfield Place Independent Living

Nursing Home, Assisted Living, Independent Living, Memory Care & Respite Care · Wichita, KS
CMS overall rating Info CMS (the Centers for Medicare & Medicaid Services) is the federal agency that rates nursing home quality. Its Overall Rating runs from 1 to 5 stars, combining health inspections, staffing, and quality measures, with inspections weighted most heavily.
Calculator: See prices in your area
Larksfield Place Independent Living accepts Medicare and private pay.

Overview of Larksfield Place Independent Living

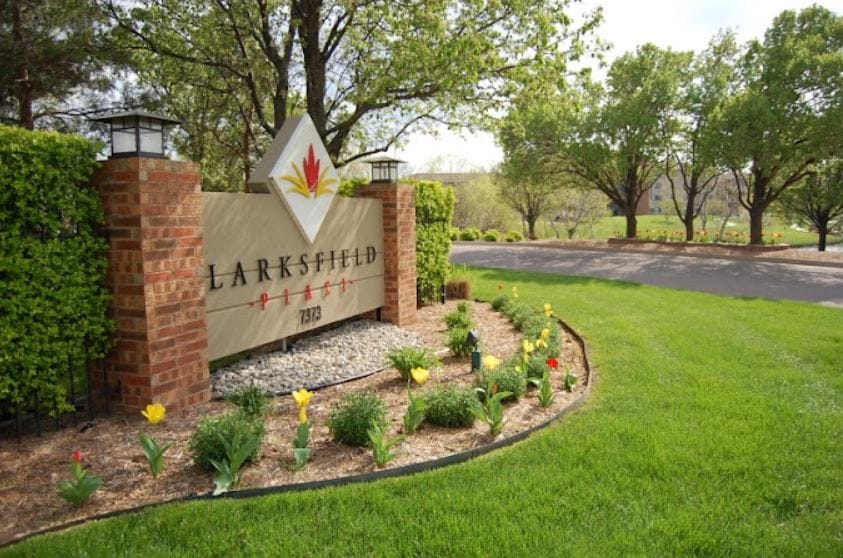
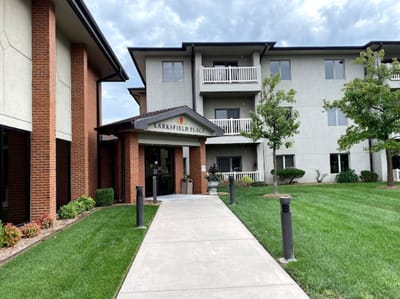
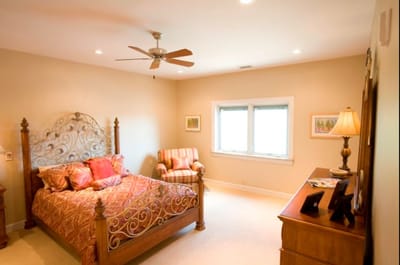
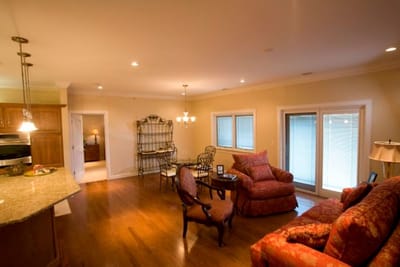
Larksfield Place Independent Living is a luxury senior living community in Wichita, Kansas, offering various senior living solutions, including independent living, assisted living, and skilled nursing. Residents can choose from their thoughtfully designed apartments, including a studio, one-bedroom, and a villa. As a not-for-profit community, Larksfield Place is fully focused on delivering the best senior living experience and less on its bottom line.

Known for their exceptionally high standards and unsurpassed service, the community has the most highly trained and experienced professionals in the Wichita area, ensuring residents can access top-rated senior health services, including respite care, transitional care, memory support, and rehabilitation. Residents can also participate in various activities, including music therapy, art therapy, cognitive programs, exercise and fitness, concerts, and happy hour, ensuring an enriched and vibrant life.

(316) 636-1000

Quality ratings

Measured by Centers for Medicare & Medicaid Services (CMS)

Overall rating Info The Overall CMS Rating combines results from health inspections, staffing levels and quality measures. Health inspections carry the most weight. Staffing and quality scores can increase or decrease the final rating based on performance compared to state and national standards.
▲ 72.9% Above KS avg. ▲ 72.9% Above KS avg.KS average: 2.9Click the badge to see the full State ranking.Click here to see the full State ranking.
Health Inspection Info Based on the results of the facility's three most recent standard inspections and any complaint investigations. CMS reviews the number, scope, and severity of deficiencies, with more recent findings weighted more heavily.
▲ 44.8% Above KS avg. ▲ 44.8% Above KS avg.KS average: 2.8Click the badge to see the full State ranking.Click here to see the full State ranking.
Staffing Info Measures average nursing staff hours per resident per day, including Registered Nurses (RNs) and total nursing staff. Ratings are adjusted based on the level of care residents require and are compared to state and national benchmarks.
▲ 44.6% Above KS avg. ▲ 44.6% Above KS avg.KS average: 3.5Click the badge to see the full State ranking.Click here to see the full State ranking.
Quality Measures Info Based on clinical and physical health indicators reported to CMS, such as hospital readmissions, falls, pressure ulcers, and improvements in mobility. These measures reflect how well residents' health needs are being managed.
▲ 61.7% Above KS avg. ▲ 61.7% Above KS avg.KS average: 3.1Click the badge to see the full State ranking.Click here to see the full State ranking.

Staffing hours breakdown

Info Daily nursing hours per resident by staff type, reported to CMS. Higher is generally better — compare this facility to state and national averages to see where staffing stands.

Hours per resident per day — compared to Kansas state averages

Total nursing care / resident Info Total adjusted nursing hours per resident per day, combining RN, LPN, and aide time. CMS adjusts this for case-mix so facilities can be fairly compared.
5h 34m per day
This facility Kansas avg (4h 38m per day)
vs Kansas avg
+20%

1 of 6 metrics below state avg

Standout metric Physical Therapist is +89% above state avg
Staff typeHours / Day / Residentvs state avg
Registered Nurse (RN) Info RNs hold the highest nursing license and can assess residents, interpret test results, and direct care plans. More RN hours per day often signals stronger clinical oversight and faster response to health changes. 40m per day ▼ 5% State avg: 42m per day · National avg: 41m per day
LPN / LVN Info Licensed Practical Nurses (LPNs) or Licensed Vocational Nurses (LVNs) deliver routine hands-on care — medication administration, wound dressing, and monitoring vital signs. They work under RN supervision and make up a large share of daily bedside care. 1h 15m per day ▲ 88% State avg: 40m per day · National avg: 52m per day
Nurse Aide Info Certified Nurse Aides (CNAs) provide the most direct day-to-day assistance: bathing, dressing, feeding, and mobility. Nurse aide hours are typically the largest staffing category and directly affect residents' quality of life. 2h 58m per day ▲ 11% State avg: 2h 41m per day · National avg: 2h 20m per day
Weekend Total Nursing Info Combined nursing hours (RN + LPN + Nurse Aide) per resident per day on weekends. Staffing often drops on weekends — this figure reveals whether the facility maintains adequate coverage outside of weekday hours. 4h 22m per day ▲ 20% State avg: 3h 38m per day · National avg: 3h 27m per day
Physical Therapist Info Hours per resident per day provided by licensed Physical Therapists (PTs) or PT Assistants. PT services help residents recover mobility after injury or illness and are especially important for post-acute (short-stay) rehabilitation. 5m per day ▲ 89% State avg: 2m per day · National avg: 4m per day
Weekend RN Info Registered nurse hours specifically on weekends. Facilities sometimes reduce RN presence on Saturdays and Sundays — a low weekend RN figure compared to weekday hours can indicate reduced clinical oversight when most administrative staff are absent. 35m per day ▲ 20% State avg: 29m per day · National avg: 29m per day

Capacity and availability

This home usually has limited availability

Higher occupancy than the Kansas average: 79.5%
Occupancy rate
92.7%
Avg. Length of Stay
57 days
Bed community size
80-bed community Rank #59 / 224Bed count — State benchmarkedThis home is ranked 59th out of 224 homes in Kansas. Shows this facility's certified or reported bed count compared to other Kansas facilities. Larger communities may offer more amenities, programs, and on-site services for residents and families.Rankings are based only on facilities in Kansas that report data for that category. Facilities without available data are excluded from the ranking.Click the rank badge to see the full State ranking.Click here to see the full State ranking.
A larger shared setting that may offer more common spaces and organized community services.
Years in operation
41 years in operation
A longer operating history, which may indicate experience navigating regulations and delivering ongoing care.
Walk Score
Walk Score: 32 / 100 Rank #252 / 363Walk Score — State benchmarkedThis home is ranked 252nd out of 363 homes in Kansas. Shows how walkable this facility's neighborhood is compared to the average Walk Score across Kansas facilities. Higher scores benefit residents, families, and staff.Rankings are based only on facilities in Kansas that report data for that category. Facilities without available data are excluded from the ranking.Click the rank badge to see the full State ranking.Click here to see the full State ranking.
Somewhat walkable. A few nearby services may be reachable on foot, but most trips require transportation.
BBB Rating
BBB Rating: A+ (Not Accredited)
An independent rating from the Better Business Bureau based on factors such as complaint history, transparency, and business practices.
How BBB ratings work

About this community

Awards

BEST Independent Living
BEST Assisted Living
BEST Skilled Nursing Facility
BEST Memory Care
BEST Nursing Home

Staffing

Key information about the people who lead and staff this community.

Leadership

ContactMichael (Mike) Hambley, President/CEO

Therapy & Rehabilitation

3 services
Rehabilitation Services
Respite Care
Short-Term Rehab

Additional Services

1 service
Memory Support

Contact Larksfield Place Independent Living

Health Inspection History

Inspections since 2021
Total health inspections 3

Kansas average 4.5


Last Health inspection on Oct 2024

Total health citations
13

Kansas average 26.9

Citations per inspection
4.33

Kansas average 6.07


Health citations are formal notices following inspections when they fail to comply with safety and care standards.

All 13 citations resulted from standard inspections.

Breakdown of citation severity (last 5 years)
Critical health citations
0
100% better than Kansas average

Kansas average: 0.9


Serious health citations
0
100% better than Kansas average

Kansas average: 0.9

0 critical citations Kansas average: 0.9

0 serious citations Kansas average: 0.9

13 moderate citations Kansas average: 24.6

0 minor citations Kansas average: 0.5
Citations history (last 5 years)
Infection Control moderate citation Oct 09, 2024
Corrected

Nutrition moderate citation Oct 09, 2024
Corrected

Pharmacy moderate citation Oct 09, 2024
Corrected

Quality of Care moderate citation Oct 09, 2024
Corrected

Staffing Data

Reporting period: October 1 – December 31, 2025 (Q4 2025). Source: CMS Payroll-Based Journal report.

Total staff 193
Employees 190
Contractors 3
Staff to resident ratio 2.61 : 1
16% more staff per resident than Kansas average
Kansas average ratio: 2.24 : 1 Kansas average ratio: 2.24 : 1See full Kansas ranking
Avg staff/day 64
Average shift 7.3 hours
5% worse than Kansas average
Kansas average: 7.7 hours Kansas average shift: 7.7 hoursSee full Kansas ranking
Total staff hours (quarter) 42,871

Nursing staff breakdown

Q4 2025 · Oct 1 – Dec 31 More info This data comes from the CMS Payroll-Based Journal report covering October 1 – December 31, 2025.
Registered Nurse

Manages medical care and health needs.

RN Staff Info All 18 RN Staff are full-time employees. No contractors work on this role. 18
Average shift length Info Average shift length. Calculated as total hours divided by days worked and average staff per day. 8.6 hours
Licensed Practical Nurse

Assists with medical care and medications.

LPN Staff Info All 31 LPN Staff are full-time employees. No contractors work on this role. 31
Average shift length Info Average shift length. Calculated as total hours divided by days worked and average staff per day. 8.3 hours
Certified Nursing Assistant

Helps with daily care and mobility.

CNA Staff Info All 77 CNA Staff are full-time employees. No contractors work on this role. 77
Average shift length Info Average shift length. Calculated as total hours divided by days worked and average staff per day. 7 hours

Contractor staffing

Q4 2025 · Oct 1 – Dec 31 More info This data comes from the CMS Payroll-Based Journal report covering October 1 – December 31, 2025.

Total hours from contractors

0.5%

214 contractor hours this quarter

Medical Director: 1 Occupational Therapy Aide: 1 Occupational Therapy Assistant: 1

Staff by category

Q4 2025 · Oct 1 – Dec 31 More info This data comes from the CMS Payroll-Based Journal report covering October 1 – December 31, 2025.
Certified Nursing Assistant7707718,06292100%7
Licensed Practical Nurse310317,36892100%8.3
Medication Aide/Technician160163,76792100%7.1
Registered Nurse180183,68692100%8.6
RN Director of Nursing4041,8297076%7.6
Speech Language Pathologist8081,2447076%6
Physical Therapy Aide8081,0938087%6.3
Other Dietary Services Staff7071,0629199%6.2
Clinical Nurse Specialist2028848896%8
Respiratory Therapy Technician5055757582%5.9
Physical Therapy Assistant6065586672%5.7
Dietitian1014725964%8
Dental Services Staff1014725964%8
Administrator1014085155%8
Mental Health Service Worker1014005054%8
Qualified Social Worker3033926368%5.9
Nurse Practitioner1013844852%8
Occupational Therapy Aide0111773639%4.9
Occupational Therapy Assistant0112767%4.5
Medical Director01110910%1.1
77 Certified Nursing Assistant
% of Days 100%
31 Licensed Practical Nurse
% of Days 100%
16 Medication Aide/Technician
% of Days 100%
18 Registered Nurse
% of Days 100%
4 RN Director of Nursing
% of Days 76%
8 Speech Language Pathologist
% of Days 76%
8 Physical Therapy Aide
% of Days 87%
7 Other Dietary Services Staff
% of Days 99%
2 Clinical Nurse Specialist
% of Days 96%
5 Respiratory Therapy Technician
% of Days 82%
6 Physical Therapy Assistant
% of Days 72%
1 Dietitian
% of Days 64%
1 Dental Services Staff
% of Days 64%
1 Administrator
% of Days 55%
1 Mental Health Service Worker
% of Days 54%
3 Qualified Social Worker
% of Days 68%
1 Nurse Practitioner
% of Days 52%
1 Occupational Therapy Aide
% of Days 39%
1 Occupational Therapy Assistant
% of Days 7%
1 Medical Director
% of Days 10%

Penalties and fines

Federal penalties imposed by CMS for regulatory violations, including civil money penalties (fines) and denials of payment for new Medicare/Medicaid admissions.

Source: CMS Penalties Database

No penalties in the past 3 years

No civil money penalties or payment denials were reported in the last 3 years.

Quality of care over time

These measures show how residents usually do over time at this home, based on health outcomes and preventive care.

High-risk clinical events score Info A composite score based on pressure ulcers, falls with injury, weight loss, walking ability decline, and activities of daily living decline. 9.2
13% better than Kansas average

Kansas average: 10.5

Functional decline score Info A composite score based on activities of daily living decline, walking ability decline, and incontinence. 17.9
14% better than Kansas average

Kansas average: 20.7

Long-stay resident measures
Need for Help with Daily Activities Increased Info Percent of long-stay residents whose need for help with daily activities has increased 9.2%
51% better than Kansas average

Kansas average: 19.0%

Walking Ability Worsened Info Percent of long-stay residents whose ability to move independently worsened 22.0%
13% worse than Kansas average

Kansas average: 19.4%

Low Risk Residents with Bowel/Bladder Incontinence Info Percent of low risk long-stay residents who lose control of their bowels or bladder 22.4%
6% better than Kansas average

Kansas average: 23.8%

Falls with Major Injury Info Percent of long-stay residents experiencing one or more falls with major injury 4.6%
5% worse than Kansas average

Kansas average: 4.4%

High Risk Residents with Pressure Ulcers Info Percent of long-stay high risk residents with pressure ulcers 4.8%
In line with Kansas average

Kansas average: 4.6%

Urinary Tract Infection Info Percent of long-stay residents with a urinary tract infection 0.0%
100% better than Kansas average

Kansas average: 3.1%

Lost Too Much Weight Info Percent of long-stay residents who lose too much weight 5.2%
In line with Kansas average

Kansas average: 5.1%

Depressive Symptoms Info Percent of long-stay residents who have depressive symptoms 7.9%
54% worse than Kansas average

Kansas average: 5.2%

Antipsychotic Use Info Percent of long-stay residents who received an antipsychotic medication 2.6%
85% better than Kansas average

Kansas average: 16.9%

Pneumococcal Vaccine Info Percent of long-stay residents assessed and appropriately given the pneumococcal vaccine 100.0%
9% better than Kansas average

Kansas average: 91.9%

Influenza Vaccine Info Percent of long-stay residents assessed and appropriately given the seasonal influenza vaccine 96.4%
In line with Kansas average

Kansas average: 95.5%

Short-stay resident measures
Pneumococcal Vaccine Info Percent of short-stay residents assessed and appropriately given the pneumococcal vaccine 98.3%
30% better than Kansas average

Kansas average: 75.6%

Antipsychotic medication increase Info Percent of short-stay residents who newly received an antipsychotic medication 0.7%
70% better than Kansas average

Kansas average: 2.2%

Influenza Vaccine Info Percent of short-stay residents assessed and appropriately given the seasonal influenza vaccine 97.2%
32% better than Kansas average

Kansas average: 73.5%

Breakdown by payment type

Medicare

53% of new residents, usually for short-term rehab.

Typical stay 20 days

Private pay

47% of new residents, often for short stays.

Typical stay 2 - 3 months

Facility Characteristics

Source: CMS Long-Term Care Facility Characteristics (Data as of Jan 2026)

Total residents 74
Medicare
23
31.1% of residents
Medicaid
10
13.5% of residents
Private pay or other
41
55.4% of residents
Programs & Services
Residents Group

Residents meet regularly to discuss policies, care quality, and activities

CCRC

Part of a Continuing Care Retirement Community offering multiple care levels

Active Resident Council

Organized group of residents that meets regularly to discuss facility policies, quality of life, and activities.

Finances and operations

Based on CMS SNF Cost Report for fiscal year ending in 06/2024.

Governmental community
Operated by a subsidized facility district.
Net patient revenue Info Net patient revenue — what the home actually collects for resident care, after contractual allowances, bad debt and discounts are subtracted from its gross charges (CMS cost report, Worksheet G-3). It covers resident care only; money the home earns from other sources is shown separately as "Other income."
$24.9M
Net patient income Info Net patient income: net patient revenue minus the home's total operating expenses. A positive figure means it earns more from resident care than it spends to deliver it; a negative figure means the opposite. It excludes non-operating "other income."
-$2.7M
Governmental community Operated by a subsidized facility district.
Net patient revenue Info Net patient revenue — what the home actually collects for resident care, after contractual allowances, bad debt and discounts are subtracted from its gross charges (CMS cost report, Worksheet G-3). It covers resident care only; money the home earns from other sources is shown separately as "Other income."
$24.9M
Net patient income Info Net patient income: net patient revenue minus the home's total operating expenses. A positive figure means it earns more from resident care than it spends to deliver it; a negative figure means the opposite. It excludes non-operating "other income."
-$2.7M
Other income Info Money the home earns outside of resident care — such as investments, grants, rentals and other non-operating sources (CMS cost report, Worksheet G-3). It is tracked separately from net patient revenue: it is not part of that figure, and it is not included in net patient income.
$2.5M
Payroll costs Info Staff salaries plus wage-related costs — benefits such as payroll taxes, health insurance and retirement — from the home's own accounting records (CMS cost report, Worksheet A). Contract or agency labor is counted separately, under other operating costs.
$11.8M 47.4% of net patient revenue Info Payroll as a share of revenue: staff salaries and wage-related benefits divided by net patient revenue. A higher figure means more of each revenue dollar goes to staff pay.
Other operating costs Info Everything it costs to run the home apart from payroll — food, utilities, supplies, maintenance, contract labor and administration. Calculated as total operating expense minus payroll (staff salaries and wage-related benefits).
$15.8M
Total costs Info The home's total operating expense for the year — all the costs of running it, salaries included (CMS cost report, Worksheet G-3).
$27.6M

What does this home offer?

Room sizes icon
Room sizes icon

Room Sizes: 1 Bed

Men / Women icon

Men / Women: 3-story

Transportation services icon

Transportation Services

Fitness and recreation icon

Fitness and Recreation

Who this home usually serves

TYPE OF STAY

Mostly short-term rehab stays

Most residents typically stay for a few weeks or months before returning home or moving on.

Most new residents arrive under Medicare (53% of admissions), and a typical Medicare stay runs around 20 days.

Admissions
474 total

Coverage residents most often arrive under.

Medicare 53%
Private pay 47%
Discharges
474 total

Coverage residents most often leave under.

Medicare 42%
Private pay 56%
Medicaid 3%

Places of interest near Larksfield Place Independent Living

Address 7.3 miles from city center Info Estimated distance in miles from Wichita's city center to Larksfield Place Independent Living's address, calculated via Google Maps.

Calculate Travel Distance to Larksfield Place Independent Living

Add your location

Address

Compare Nursing Homes around Wichita

The information below is reported by the Kansas Department for Aging and Disability Services.

5 facilities compared · CMS & KS Dept. of Health data

Regent Park Rehabilitation and Healthcare
NH
AL
HC
IL
MC
NC
RC
Wichita (Bradford Place)
84
Facility 84
KS AVG 69
Rank #54 / 224
83.1% +5%5.17 +6%+12%$0144.7-71-
28
Facility 28
KS AVG 46
Rank #269 / 363
Legend Senior Properties$10.9M$6.7M61.5%175527
Larksfield Place Independent Living
NH
AL
IL
MC
RC
Wichita
80
Facility 80
KS AVG 69
Rank #59 / 224
92.7% +17%5.57 -8%+20%$0134.3-80A+
32
Facility 32
KS AVG 46
Rank #252 / 363
Larksfield Place Retirement Communities, Inc$24.9M$11.8M47.4%175181
Hilltop Manor
NH
HC
Cunningham
45
Facility 45
KS AVG 69
Rank #152 / 224
58.8% -26%4.19 -33%-10%$0103.3138-
20
Facility 20
KS AVG 46
Rank #311 / 363
Darcy Kemmis$4.0M$2.4M60.8%175545
Ascension Living Via Christi Village Ridge
NH
ADC
AL
IL
MC
Wichita
80
Facility 80
KS AVG 69
Rank #59 / 224
88.7% +12%4.47 -6%-4%$0162.7271-
25
Facility 25
KS AVG 46
Rank #282 / 363
Trisha Chege$13.8M$6.5M46.8%175539
Eureka Nursing
NH
HC
Eureka
58
Facility 58
KS AVG 69
Rank #115 / 224
74.1% -7%4.78 +58%+3%$23.9k287.0345-
21
Facility 21
KS AVG 46
Rank #305 / 363
Jolene Signhateh$4.5M$2.5M54.5%175287

Financial Assistance for
Nursing Home in Kansas

Larksfield Place Independent Living is located in Wichita, Kansas.
Here are the financial assistance programs available to residents in Kansas.

Get Financial aid guidance

Frail Elderly Waiver

Kansas Medicaid FE Waiver

Age 65+
General Kansas resident, Medicaid-eligible, nursing home- level care need.
Income Limits (2025) ~$2,829/month 300% FBR, individual
Asset Limits $2,000 (individual), $3,000 (couple).
KS

Requires care level assessment.

Benefits
Personal care (5-7 hours/day) Respite (240 hours/year) Adult day care (~$60/day) Home aides

Senior Care Act

Kansas SCA

Age 60+
General Kansas resident, at risk of nursing home.
Income Limits ~$1,800/month individual, varies
Asset Limits $2,000 individual
KS

Limited funding; waitlists common.

Benefits
In-home care (3-5 hours/week) Respite (up to 10 days/year) Homemaker services

Medicare Savings Program (MSP)

Kansas Medicare Savings Program

Age 65+ or disabled
General Kansas resident, Medicare Part A/B.
Income Limits (2025) ~$2,510/month (QMB), ~$3,380/month (SLMB), ~$3,598/month (QI)—individual.
Asset Limits $9,430 (individual), $14,130 (couple).
KS

Three tiers; no waitlist.

Benefits
Covers Part B premiums ($174.70/month) Deductibles ($240/year) Copays (~20%)

National Family Caregiver Support Program (NFCSP) Respite

Kansas NFCSP Respite Care

Age
General Caregivers of 60+ needing care or 55+ caregivers of others; Kansas resident; functional needs (2+ ADLs).
Income Limits (2025) Prioritizes ~$24,980/year (individual); no strict cap.
Asset Limits Not assessed; need-based.
KS

11 AAAs; prioritizes low-income, rural caregivers.

Benefits
Respite (4-6 hours/week or 5 days/year) Adult day care ($60/day) Caregiver training

VA Aid and Attendance (A&A) and Housebound Benefits

Kansas VA Aid and Attendance/Housebound

Age 65+ or disabled veteran/spouse
General Kansas resident, wartime service, need for ADL help (A&A) or homebound.
Income Limits (2025) Net income < ~$1,984/month (veteran with dependent, A&A); pension offsets income.
Asset Limits ~$155,356 net worth limit
KS

High veteran demand in rural/urban areas.

Benefits
Cash (~$1,433-$2,642/month veteran, ~$951-$1,318 spouse) for care costs (e.g., in-home, assisted living)

Frequently Asked Questions about Larksfield Place Independent Living

Is Larksfield Place Independent Living in a walkable area?

Larksfield Place Independent Living has a walk score of 32. Somewhat walkable. A few nearby services may be reachable on foot, but most trips require transportation.

What is the occupancy rate at Larksfield Place Independent Living?

Larksfield Place Independent Living's occupancy is 92.7%.

Are there photos of Larksfield Place Independent Living?

Yes — there are 4 photos of Larksfield Place Independent Living in the photo gallery on this page.

What is the address of Larksfield Place Independent Living?

Larksfield Place Independent Living is located at 7373 East 29Th St N, Wichita, KS 67226.

What is the phone number of Larksfield Place Independent Living?

(316) 636-1000 will put you in contact with the team at Larksfield Place Independent Living.

Is Larksfield Place Independent Living Medicare or Medicaid certified?

Yes — Larksfield Place Independent Living is a CMS-certified provider of Medicare and Medicaid.

Guides for Better Senior Living

Care Cost Calculator: See Prices in Your Area

Nursing Home Data Explorer

Don’t Wait Too Long: 7 Red Flag Signs Your Parent Needs Assisted Living Now

The True Cost of Assisted Living in 2025 – And How Families Are Paying For It

Understanding Senior Living Costs: Pricing Models, Discounts & Financial Assistance