


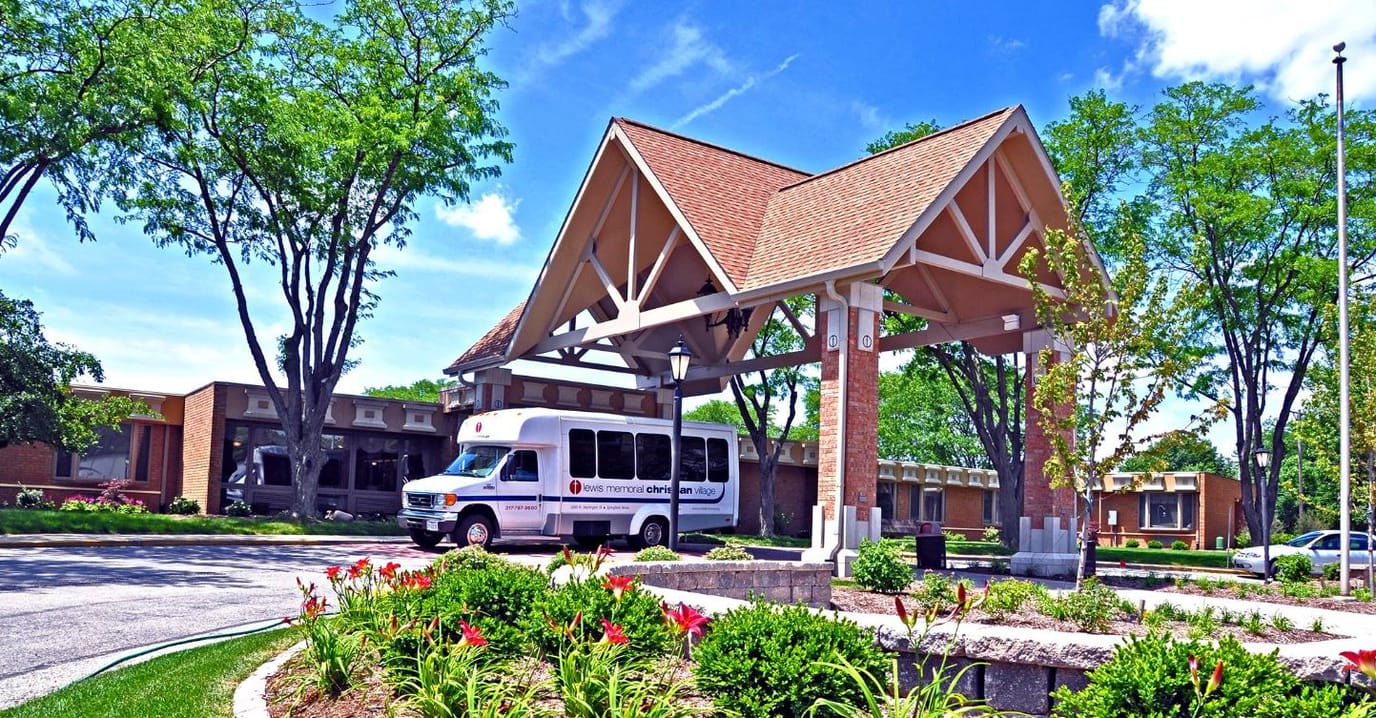
Lewis Memorial Christian Village
Nursing Home & Assisted Living · Springfield, IL
Lewis Memorial Christian Village
Nursing Home & Assisted Living · Springfield, IL
Hickory Point Christian Village, Inc. operates Lewis Memorial Christian Village, a faith-led, 19-acre senior living campus in Springfield, Illinois. The property handles independent living, assisted living, long-term nursing, and a short-term rehab program called Gracepoint. It houses 171 residents across its patio townhomes and apartments, running at a 74.3 percent occupancy level. Stays average about 82 days, a timeline showing that daily floor operations move quickly to balance short-term therapy turnarounds with permanent residential care.
The daily routine centers on a hands-on nursing schedule that averages 2 hours and 25 minutes of direct attention per resident each day. Registered nurses, practical nurses, and aides split this time to run clinical monitoring alongside on-site speech, physical, occupational, and respiratory therapy sessions. If you plan to visit, keep in mind the campus carries a low walk score of 13, meaning the location is car-dependent and you will need a vehicle to reach the nearby hospitals, shops, or churches.
State regulators have previously noted safety and care compliance issues at this facility. Specifically, inspection records point to ongoing problems with resident supervision, fall prevention, nutritional support, and maintaining the functional physical abilities of residents over time. Talking through these past survey reports with the director of nursing is a smart way to find out what specific training updates they have added to their daily floor routines.
Interested individuals can reach out to the admissions office to check on open townhome layouts, apartment vacancies, or the standard entry checklist.
Walk Score: 13 / 100 Rank #581 / 648Walk Score — State benchmarkedThis home is ranked 581st out of 648 homes in Illinois for Walk Score. Shows how walkable this facility's neighborhood is compared to the average Walk Score across Illinois facilities. Higher scores benefit residents, families, and staff.Facilities with the same value for a metric share the same rank. Rankings are based only on facilities in Illinois that report data for that category. Facilities without available data are excluded from the ranking.Click the rank badge to see the full State ranking.Click here to see the full State ranking.
Car-dependent. Most errands require a car, with limited nearby walkable options.
Financial Assistance for
Nursing Home in Illinois
Lewis Memorial Christian Village is located in Springfield, Illinois.
Here are the financial assistance programs available to residents in Illinois.
Frequently Asked Questions about Lewis Memorial Christian Village
Is Lewis Memorial Christian Village in a walkable area?
Lewis Memorial Christian Village has a walk score of 13. Car-dependent. Most errands require a car, with limited nearby walkable options.
Are there photos of Lewis Memorial Christian Village?
Yes — there is 1 photo of Lewis Memorial Christian Village in the photo gallery on this page.
What is the phone number of Lewis Memorial Christian Village?
(217) 726-5606 will put you in contact with the team at Lewis Memorial Christian Village.
Guides for Better Senior Living
Care Cost Calculator: See Prices in Your Area
Nursing Home Data Explorer
Don’t Wait Too Long: 7 Red Flag Signs Your Parent Needs Assisted Living Now
The True Cost of Assisted Living in 2025 – And How Families Are Paying For It
Understanding Senior Living Costs: Pricing Models, Discounts & Financial Assistance
Updated on
