Lexington Park Assisted Living
Nursing Home, Assisted Living & Independent Living · Topeka, KS
CMS overall rating Info CMS (the Centers for Medicare & Medicaid Services) is the federal agency that rates nursing home quality. Its Overall Rating runs from 1 to 5 stars, combining health inspections, staffing, and quality measures, with inspections weighted most heavily.

Lexington Park Assisted Living

Nursing Home, Assisted Living & Independent Living · Topeka, KS
CMS overall rating Info CMS (the Centers for Medicare & Medicaid Services) is the federal agency that rates nursing home quality. Its Overall Rating runs from 1 to 5 stars, combining health inspections, staffing, and quality measures, with inspections weighted most heavily.
Calculator: See prices in your area
Lexington Park Assisted Living accepts Medicare and private pay.

Overview of Lexington Park Assisted Living

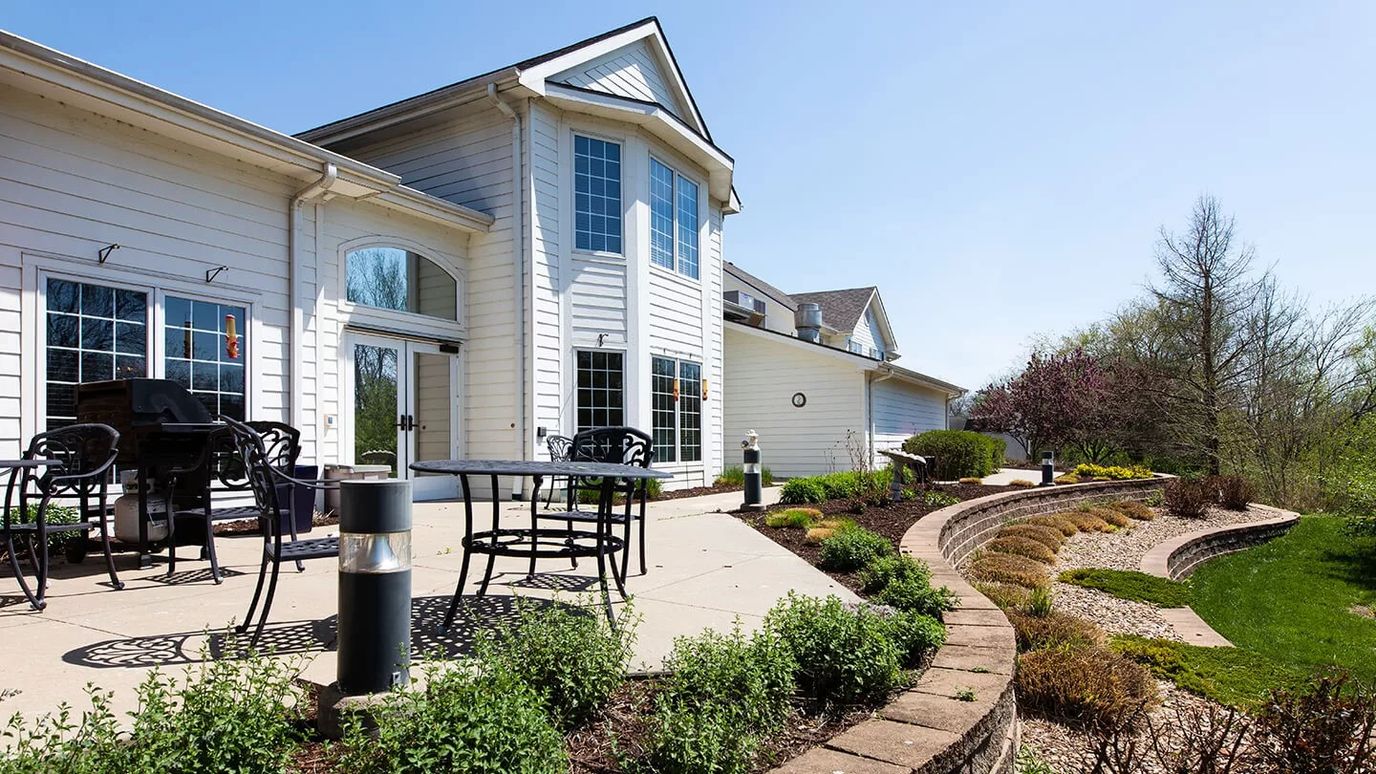
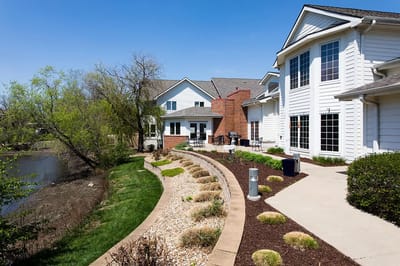
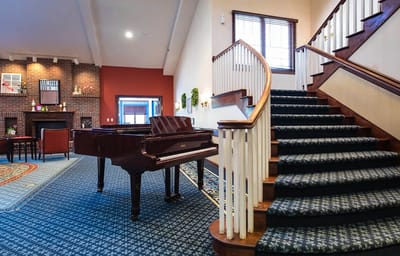
A Sister company of Rolling Hills and Homestead, Lexington Park is an assisted living community that also extends to independent living, memory care, rapid recovery, and skilled nursing services in Topeka. The community programs and activities are designed to help individuals develop an active lifestyle and hassle-free living while maintaining independence through a personalized-style approach in a nurturing setting. The senior living home creates an environment that promotes holistic wellness. There is a vibrant home-like atmosphere with world-class service that elevates their daily living.  As a proud member of Midwest Health, Lexington Park is the ideal home where seniors thrive. 
Lexington Park aims to enhance the quality of life for its residents by ensuring that seniors are able to satisfy their holistic wellness. They house licensed physicians and professionals and offer a list of social and stimulating activities, nutritional programs, and specialized training for residents for an enriching experience– short-term and long-term care, post-hospital and post-surgical care, respiration therapy, and social services available.  

(785) 347-6617

Quality ratings

Measured by Centers for Medicare & Medicaid Services (CMS)

Overall rating Info The Overall CMS Rating combines results from health inspections, staffing levels and quality measures. Health inspections carry the most weight. Staffing and quality scores can increase or decrease the final rating based on performance compared to state and national standards.
▲ 72.9% Above KS avg. ▲ 72.9% Above KS avg.KS average: 2.9Click the badge to see the full State ranking.Click here to see the full State ranking.
Health Inspection Info Based on the results of the facility's three most recent standard inspections and any complaint investigations. CMS reviews the number, scope, and severity of deficiencies, with more recent findings weighted more heavily.
▲ 81.0% Above KS avg. ▲ 81.0% Above KS avg.KS average: 2.8Click the badge to see the full State ranking.Click here to see the full State ranking.
Staffing Info Measures average nursing staff hours per resident per day, including Registered Nurses (RNs) and total nursing staff. Ratings are adjusted based on the level of care residents require and are compared to state and national benchmarks.
▲ 44.6% Above KS avg. ▲ 44.6% Above KS avg.KS average: 3.5Click the badge to see the full State ranking.Click here to see the full State ranking.
Quality Measures Info Based on clinical and physical health indicators reported to CMS, such as hospital readmissions, falls, pressure ulcers, and improvements in mobility. These measures reflect how well residents' health needs are being managed.
▲ 29.4% Above KS avg. ▲ 29.4% Above KS avg.KS average: 3.1Click the badge to see the full State ranking.Click here to see the full State ranking.

Staffing hours breakdown

Info Daily nursing hours per resident by staff type, reported to CMS. Higher is generally better — compare this facility to state and national averages to see where staffing stands.

Hours per resident per day — compared to Kansas state averages

Total nursing care / resident Info This home is ranked 74th out of 141 homes in Kansas for nurse hours. Total adjusted nursing hours per resident per day, combining RN, LPN, and aide time. CMS adjusts this for case-mix so facilities can be fairly compared.
4h 29m per day
Rank #74 / 141Nurse hours — State benchmarkedThis home is ranked 74th out of 141 homes in Kansas. Shows adjusted nurse hours per resident per day benchmarked to the Kansas average, with a ranking across 141 Kansas facilities. More hours mean more direct care. The national average is about 3.5 hrs; below 3.0 is a red flag.Ranking totals vary by category as each rank only includes facilities that report data for that metric. Homes missing that data point aren't included in the ranking.Click the rank badge to see the full State ranking.Click here to see the full State ranking.
This facility Kansas avg (4h 38m per day)
vs Kansas avg
-3%

0 of 6 metrics below state avg

Standout metric Physical Therapist is +497% above state avg
Staff typeHours / Day / Residentvs state avg
Registered Nurse (RN) Info RNs hold the highest nursing license and can assess residents, interpret test results, and direct care plans. More RN hours per day often signals stronger clinical oversight and faster response to health changes. 44m per day ▲ 3% State avg: 42m per day · National avg: 41m per day
LPN / LVN Info Licensed Practical Nurses (LPNs) or Licensed Vocational Nurses (LVNs) deliver routine hands-on care — medication administration, wound dressing, and monitoring vital signs. They work under RN supervision and make up a large share of daily bedside care. 45m per day ▲ 14% State avg: 40m per day · National avg: 52m per day
Nurse Aide Info Certified Nurse Aides (CNAs) provide the most direct day-to-day assistance: bathing, dressing, feeding, and mobility. Nurse aide hours are typically the largest staffing category and directly affect residents' quality of life. 3h 1m per day ▲ 13% State avg: 2h 41m per day · National avg: 2h 20m per day
Weekend Total Nursing Info Combined nursing hours (RN + LPN + Nurse Aide) per resident per day on weekends. Staffing often drops on weekends — this figure reveals whether the facility maintains adequate coverage outside of weekday hours. 4h 8m per day ▲ 14% State avg: 3h 38m per day · National avg: 3h 27m per day
Physical Therapist Info Hours per resident per day provided by licensed Physical Therapists (PTs) or PT Assistants. PT services help residents recover mobility after injury or illness and are especially important for post-acute (short-stay) rehabilitation. 15m per day ▲ 497% State avg: 2m per day · National avg: 4m per day
Weekend RN Info Registered nurse hours specifically on weekends. Facilities sometimes reduce RN presence on Saturdays and Sundays — a low weekend RN figure compared to weekday hours can indicate reduced clinical oversight when most administrative staff are absent. 32m per day ▲ 9% State avg: 29m per day · National avg: 29m per day

Capacity and availability

Avg. Length of Stay
101 days
Bed community size
60-bed community Rank #94 / 224Bed count — State benchmarkedThis home is ranked 94th out of 224 homes in Kansas. Shows this facility's certified or reported bed count compared to other Kansas facilities. Larger communities may offer more amenities, programs, and on-site services for residents and families.Ranking totals vary by category as each rank only includes facilities that report data for that metric. Homes missing that data point aren't included in the ranking.Click the rank badge to see the full State ranking.Click here to see the full State ranking.
A moderately sized community that may balance personal attention with shared amenities and social activities.
Years in operation
22 years in operation
A longer operating history, which may indicate experience navigating regulations and delivering ongoing care.
Walk Score
Walk Score: 60 / 100 Rank #99 / 363Walk Score — State benchmarkedThis home is ranked 99th out of 363 homes in Kansas. Shows how walkable this facility's neighborhood is compared to the average Walk Score across Kansas facilities. Higher scores benefit residents, families, and staff.Ranking totals vary by category as each rank only includes facilities that report data for that metric. Homes missing that data point aren't included in the ranking.Click the rank badge to see the full State ranking.Click here to see the full State ranking.
Moderately walkable. Some errands can be accomplished on foot, with a mix of nearby amenities.
BBB Rating
BBB Rating: A+ (Not Accredited)
An independent rating from the Better Business Bureau based on factors such as complaint history, transparency, and business practices.
How BBB ratings work

About this community

Occupancy

Occupancy rate
84%
Rank #95 / 218Occupancy rate — State benchmarkedThis home is ranked 95th out of 218 homes in Kansas. Shows this facility's occupancy rate versus the Kansas average, with its Statewide rank out of 218. Higher occupancy signals strong local demand and financial stability.Ranking totals vary by category as each rank only includes facilities that report data for that metric. Homes missing that data point aren't included in the ranking.Click the rank badge to see the full State ranking.Click here to see the full State ranking.
Higher than the Kansas average: 79.5%
Occupied beds
50 / 60
Average occupied beds in Kansas homes 50 beds

License Details

Facility TypeAssisted Living Facility
StatusActive
CountyShawnee
License NumberN089041

Ownership & Operating Entity

Lexington Park Assisted Living is administrated by Ben Rigdon.

OwnerLEXINGTON PARK LLC

Type Of Units

Assisted Living
60 units
Total beds
60 units

Staffing

Key information about the people who lead and staff this community.

Leadership

ContactBeverly Blassingame, Executive Director

Contact Lexington Park Assisted Living

Inspection History

In Kansas, the Department for Aging and Disability Services, Survey and Certification Commission performs the unannounced inspections required for facility licensing and federal certification.

Since 2014 · 12 years of data 16 inspections

Inspection Scorecard Info This scorecard compares key inspection, citation, and complaint metrics at this facility against the Kansas state average. Metrics rated ≥15% worse than average are highlighted in red; those ≥15% better are highlighted in green.

Since 2014 vs. Kansas state average
Overall vs. KS average 0 Worse No metrics in this bucket. 1 Better Metrics better than Kansas average:
• Total inspections (50% below)
Latest Inspection September 24, 2025

Inspections Info State inspections evaluate whether the facility meets health and safety standards.

This FacilityKS Averagevs. KS Avg
Total inspections Info Combined count of all routine and focused inspections. Excludes complaint investigations. 1632 This facility has 50% fewer total inspections than a typical Kansas nursing home (16 vs. KS avg 32).↓ 50% better

Health Inspection History

Inspections since 2021
Total health inspections 3

Kansas average 4.5


Last Health inspection on Jul 2024

Total health citations
8 Rank #6 / 143Health citations — State benchmarkedThis home is ranked 6th out of 143 homes in Kansas. Shows this facility's total health deficiency citations benchmarked to the Kansas State average, with a ranking across all 143 KS facilities. Lower citation counts earn a better rank.Ranking totals vary by category as each rank only includes facilities that report data for that metric. Homes missing that data point aren't included in the ranking.Click the rank badge to see the full State ranking.Click here to see the full State ranking.

Kansas average 26.9

Citations per inspection
2.67 Rank #3 / 143Citations per inspection — State benchmarkedThis home is ranked 3rd out of 143 homes in Kansas. Shows average deficiency citations per CMS inspection for this facility versus the Kansas mean across 143 facilities with citation data. Lower is better.Ranking totals vary by category as each rank only includes facilities that report data for that metric. Homes missing that data point aren't included in the ranking.Click the rank badge to see the full State ranking.Click here to see the full State ranking.

Kansas average 6.07


Health citations are formal notices following inspections when they fail to comply with safety and care standards.

6 of 8 citations resulted from standard inspections; and 2 of 8 came from combined inspections (standard and complaint).

Breakdown of citation severity (last 5 years)
Critical health citations
0
100% better than Kansas average

Kansas average: 0.9


Serious health citations
0
100% better than Kansas average

Kansas average: 0.9

0 critical citations Kansas average: 0.9

0 serious citations Kansas average: 0.9

7 moderate citations Kansas average: 24.6

1 minor citation Kansas average: 0.5
Citations history (last 5 years)
Pharmacy moderate citation Jul 17, 2024
Corrected

Resident Rights moderate citation Jul 17, 2024
Corrected

Nursing Services minor citation Mar 28, 2023
Corrected

Pharmacy moderate citation Mar 28, 2023
Corrected

Staffing Data

Reporting period: October 1 – December 31, 2025 (Q4 2025). Source: CMS Payroll-Based Journal report.

Total staff 195
Employees 195
Contractors 0
Staff to resident ratio 2.53 : 1
13% more staff per resident than Kansas average
Kansas average ratio: 2.24 : 1 Kansas average ratio: 2.24 : 1See full Kansas ranking
Avg staff/day 71
Average shift 7.1 hours
8% worse than Kansas average
Kansas average: 7.7 hours Kansas average shift: 7.7 hoursSee full Kansas ranking
Total staff hours (quarter) 46,181

Nursing staff breakdown

Q4 2025 · Oct 1 – Dec 31 More info This data comes from the CMS Payroll-Based Journal report covering October 1 – December 31, 2025.
Registered Nurse

Manages medical care and health needs.

RN Staff Info All 10 RN Staff are full-time employees. No contractors work on this role. 10
Average shift length Info Average shift length. Calculated as total hours divided by days worked and average staff per day. 9.1 hours
Licensed Practical Nurse

Assists with medical care and medications.

LPN Staff Info All 15 LPN Staff are full-time employees. No contractors work on this role. 15
Average shift length Info Average shift length. Calculated as total hours divided by days worked and average staff per day. 9.7 hours
Certified Nursing Assistant

Helps with daily care and mobility.

CNA Staff Info All 77 CNA Staff are full-time employees. No contractors work on this role. 77
Average shift length Info Average shift length. Calculated as total hours divided by days worked and average staff per day. 6.9 hours

Contractor staffing

Q4 2025 · Oct 1 – Dec 31 More info This data comes from the CMS Payroll-Based Journal report covering October 1 – December 31, 2025.
Total hours from contractors 0% — all staff are direct employees this quarter

Staff by category

Q4 2025 · Oct 1 – Dec 31 More info This data comes from the CMS Payroll-Based Journal report covering October 1 – December 31, 2025.
Certified Nursing Assistant7707716,29092100%6.9
Physical Therapist170176,38892100%6.5
Medication Aide/Technician220226,00592100%6.9
Licensed Practical Nurse150155,18792100%9.7
Registered Nurse100103,78292100%9.1
Physical Therapy Assistant160161,9868390%5.8
Respiratory Therapy Technician100101,8217480%6.2
Clinical Nurse Specialist3031,0866975%7
Qualified Social Worker4045637379%4.6
Administrator1015126470%8
Nurse Practitioner1015126470%8
Dental Services Staff1015127076%7.3
Speech Language Pathologist120124097177%3.5
RN Director of Nursing1014035762%7.1
Other Dietary Services Staff1013724650%8.1
Dietitian1012985560%5.4
Physical Therapy Aide303561516%3.3
77 Certified Nursing Assistant
% of Days 100%
17 Physical Therapist
% of Days 100%
22 Medication Aide/Technician
% of Days 100%
15 Licensed Practical Nurse
% of Days 100%
10 Registered Nurse
% of Days 100%
16 Physical Therapy Assistant
% of Days 90%
10 Respiratory Therapy Technician
% of Days 80%
3 Clinical Nurse Specialist
% of Days 75%
4 Qualified Social Worker
% of Days 79%
1 Administrator
% of Days 70%
1 Nurse Practitioner
% of Days 70%
1 Dental Services Staff
% of Days 76%
12 Speech Language Pathologist
% of Days 77%
1 RN Director of Nursing
% of Days 62%
1 Other Dietary Services Staff
% of Days 50%
1 Dietitian
% of Days 60%
3 Physical Therapy Aide
% of Days 16%

Penalties and fines

Federal penalties imposed by CMS for regulatory violations, including civil money penalties (fines) and denials of payment for new Medicare/Medicaid admissions.

Source: CMS Penalties Database

No penalties in the past 3 years

No civil money penalties or payment denials were reported in the last 3 years.

Quality of care over time

These measures show how residents usually do over time at this home, based on health outcomes and preventive care.

High-risk clinical events score Info A composite score based on pressure ulcers, falls with injury, weight loss, walking ability decline, and activities of daily living decline. 8.7
17% better than Kansas average

Kansas average: 10.5

Functional decline score Info A composite score based on activities of daily living decline, walking ability decline, and incontinence. 21.2
In line with Kansas average

Kansas average: 20.7

Long-stay resident measures
Need for Help with Daily Activities Increased Info Percent of long-stay residents whose need for help with daily activities has increased 14.4%
24% better than Kansas average

Kansas average: 19.0%

Walking Ability Worsened Info Percent of long-stay residents whose ability to move independently worsened 21.4%
10% worse than Kansas average

Kansas average: 19.4%

Low Risk Residents with Bowel/Bladder Incontinence Info Percent of low risk long-stay residents who lose control of their bowels or bladder 28.0%
18% worse than Kansas average

Kansas average: 23.8%

Falls with Major Injury Info Percent of long-stay residents experiencing one or more falls with major injury 0.9%
80% better than Kansas average

Kansas average: 4.4%

High Risk Residents with Pressure Ulcers Info Percent of long-stay high risk residents with pressure ulcers 4.3%
7% better than Kansas average

Kansas average: 4.6%

Urinary Tract Infection Info Percent of long-stay residents with a urinary tract infection 0.9%
71% better than Kansas average

Kansas average: 3.1%

Lost Too Much Weight Info Percent of long-stay residents who lose too much weight 2.5%
51% better than Kansas average

Kansas average: 5.1%

Depressive Symptoms Info Percent of long-stay residents who have depressive symptoms 0.0%
100% better than Kansas average

Kansas average: 5.2%

Antipsychotic Use Info Percent of long-stay residents who received an antipsychotic medication 7.8%
54% better than Kansas average

Kansas average: 16.9%

Pneumococcal Vaccine Info Percent of long-stay residents assessed and appropriately given the pneumococcal vaccine 93.3%
In line with Kansas average

Kansas average: 91.9%

Influenza Vaccine Info Percent of long-stay residents assessed and appropriately given the seasonal influenza vaccine 90.0%
6% worse than Kansas average

Kansas average: 95.5%

Short-stay resident measures
Pneumococcal Vaccine Info Percent of short-stay residents assessed and appropriately given the pneumococcal vaccine 92.0%
22% better than Kansas average

Kansas average: 75.6%

Antipsychotic medication increase Info Percent of short-stay residents who newly received an antipsychotic medication 0.7%
69% better than Kansas average

Kansas average: 2.2%

Influenza Vaccine Info Percent of short-stay residents assessed and appropriately given the seasonal influenza vaccine 76.3%
In line with Kansas average

Kansas average: 73.5%

Breakdown by payment type

Medicare

75% of new residents, usually for short-term rehab.

Typical stay 28 days

Private pay

25% of new residents, often for short stays.

Typical stay 10 months

Facility Characteristics

Source: CMS Long-Term Care Facility Characteristics (Data as of Jan 2026)

Total residents 77
Medicare
19
24.7% of residents
Medicaid
44
57.1% of residents
Private pay or other
14
18.2% of residents
Programs & Services
Residents Group

Residents meet regularly to discuss policies, care quality, and activities

CCRC

Part of a Continuing Care Retirement Community offering multiple care levels

Active Resident Council

Organized group of residents that meets regularly to discuss facility policies, quality of life, and activities.

Finances and operations

Based on CMS SNF Cost Report for fiscal year ending in 12/2023.

Voluntary non-profit community
Operated by a church.
Net patient revenue Info Net patient revenue — what the home actually collects for resident care, after contractual allowances, bad debt and discounts are subtracted from its gross charges (CMS cost report, Worksheet G-3). It covers resident care only; money the home earns from other sources is shown separately as "Other income."
$8.4M
Net patient income Info Net patient income: net patient revenue minus the home's total operating expenses. A positive figure means it earns more from resident care than it spends to deliver it; a negative figure means the opposite. It excludes non-operating "other income."
-$375.6K
Voluntary non-profit community Operated by a church.
Net patient revenue Info Net patient revenue — what the home actually collects for resident care, after contractual allowances, bad debt and discounts are subtracted from its gross charges (CMS cost report, Worksheet G-3). It covers resident care only; money the home earns from other sources is shown separately as "Other income."
$8.4M Rank #47 / 144Revenue — State benchmarkedThis home is ranked 47th out of 144 homes in Kansas. Shows this facility's annual revenue compared to the Kansas average. Higher revenue generally means more resources for staffing and capital — read alongside Payroll %.Ranking totals vary by category as each rank only includes facilities that report data for that metric. Homes missing that data point aren't included in the ranking.Click the rank badge to see the full State ranking.Click here to see the full State ranking.
Net patient income Info Net patient income: net patient revenue minus the home's total operating expenses. A positive figure means it earns more from resident care than it spends to deliver it; a negative figure means the opposite. It excludes non-operating "other income."
-$375.6K
Other income Info Money the home earns outside of resident care — such as investments, grants, rentals and other non-operating sources (CMS cost report, Worksheet G-3). It is tracked separately from net patient revenue: it is not part of that figure, and it is not included in net patient income.
$30.7K
Payroll costs Info Staff salaries plus wage-related costs — benefits such as payroll taxes, health insurance and retirement — from the home's own accounting records (CMS cost report, Worksheet A). Contract or agency labor is counted separately, under other operating costs. Rank #64 / 144Payroll — State benchmarkedThis home is ranked 64th out of 144 homes in Kansas. Shows total annual staff payroll benchmarked to the Kansas average. Higher payroll investment relative to peers often signals better staffing and less reliance on cheaper contract labor.Ranking totals vary by category as each rank only includes facilities that report data for that metric. Homes missing that data point aren't included in the ranking.Click the rank badge to see the full State ranking.Click here to see the full State ranking.
$4.3M 51.3% of net patient revenue Info Payroll as a share of revenue: staff salaries and wage-related benefits divided by net patient revenue. A higher figure means more of each revenue dollar goes to staff pay. Rank #129 / 144Payroll % — State benchmarkedThis home is ranked 129th out of 144 homes in Kansas. Shows payroll as a percentage of revenue versus the Kansas average. Well-run Kansas facilities typically land around 57–67% — the top third Statewide. Below 25% may signal understaffing or heavy agency use — read with Staffing ratings.Ranking totals vary by category as each rank only includes facilities that report data for that metric. Homes missing that data point aren't included in the ranking.Click the rank badge to see the full State ranking.Click here to see the full State ranking.
Other operating costs Info Everything it costs to run the home apart from payroll — food, utilities, supplies, maintenance, contract labor and administration. Calculated as total operating expense minus payroll (staff salaries and wage-related benefits).
$4.5M
Total costs Info The home's total operating expense for the year — all the costs of running it, salaries included (CMS cost report, Worksheet G-3).
$8.8M

Who this home usually serves

TYPE OF STAY

Mostly short-term rehab stays

Most residents typically stay for a few weeks or months before returning home or moving on.

Most new residents arrive under Medicare (75% of admissions), and a typical Medicare stay runs around 28 days.

Admissions
254 total

Coverage residents most often arrive under.

Medicare 75%
Private pay 25%
Discharges
242 total

Coverage residents most often leave under.

Medicare 74%
Private pay 26%

Living Spaces & Floor Plans for Lexington Park Assisted Living

Lexington Park Assisted Living Deluxe Studio
Lexington Park Assisted Living One Bed
Lexington Park Assisted Living One Bed Deluxe
Lexington Park Assisted Living Studio

Places of interest near Lexington Park Assisted Living

Address 3.1 miles from city center Info Estimated distance in miles from Topeka's city center to Lexington Park Assisted Living's address, calculated via Google Maps. — 0.6 miles to nearest hospital (Stormont Vail Health)

Calculate Travel Distance to Lexington Park Assisted Living

Add your location

Address

Compare Nursing Home around Topeka

The information below is reported by the Kansas Department for Aging and Disability Services.

5 facilities compared · CMS & KS Dept. of Health data

Lexington Park Assisted Living
NH
AL
IL
Topeka (West Southwest 2)
60
Facility 60
KS AVG 69
Rank #94 / 224
83.9%
Facility 83.9%
KS AVG 79.5%
Rank #95 / 218
+6%
4.49
Facility 4.49
KS AVG 4.63
Rank #74 / 141
-50%-3%
$0
Facility $0
KS AVG $49.2k
Rank #1 / 144
8
Facility 8
KS AVG 26.9
Rank #6 / 143
2.7
Facility 2.7
KS AVG 6.1
Rank #3 / 143
-80A+
60
Facility 60
KS AVG 46
Rank #99 / 363
Floyd Eaton
$8.4M
Facility $8.4M
KS AVG $7.3M
Rank #47 / 144
$4.3M
Facility $4.3M
KS AVG $3.3M
Rank #64 / 144
51.3%
Facility 51.3%
KS AVG 47.9%
Rank #129 / 144
175154
Brewster Place
NH
AL
IL
MC
RC
Topeka (South/Southeast 1)
141
Facility 141
KS AVG 69
Rank #10 / 224
74.3%
Facility 74.3%
KS AVG 79.5%
Rank #138 / 218
-7%
6.62
Facility 6.62
KS AVG 4.63
Rank #7 / 141
-64%+43%
$0
Facility $0
KS AVG $49.2k
Rank #1 / 144
19
Facility 19
KS AVG 26.9
Rank #47 / 143
6.3
Facility 6.3
KS AVG 6.1
Rank #85 / 143
-76A+
56
Facility 56
KS AVG 46
Rank #124 / 363
Melissa Reynolds
$20.7M
Facility $20.7M
KS AVG $7.3M
Rank #5 / 144
$13.6M
Facility $13.6M
KS AVG $3.3M
Rank #5 / 144
65.8%
Facility 65.8%
KS AVG 47.9%
Rank #114 / 144
175044
Sabetha Manor
NH
HC
Sabetha
40
Facility 40
KS AVG 69
Rank #193 / 224
65.0%
Facility 65.0%
KS AVG 79.5%
Rank #172 / 218
-18%
5.64
Facility 5.64
KS AVG 4.63
Rank #23 / 141
-34%+22%
$0
Facility $0
KS AVG $49.2k
Rank #1 / 144
18
Facility 18
KS AVG 26.9
Rank #37 / 143
3.6
Facility 3.6
KS AVG 6.1
Rank #17 / 143
-27-
8
Facility 8
KS AVG 46
Rank #342 / 363
Sabetha Nursing LLC
$2.2M
Facility $2.2M
KS AVG $7.3M
Rank #141 / 144
$1.2M
Facility $1.2M
KS AVG $3.3M
Rank #142 / 144
54.5%
Facility 54.5%
KS AVG 47.9%
Rank #58 / 144
175241
Protected: Rolling Hills Retirement Community
NH
AL
RC
Topeka (Southwest Topeka)
70
Facility 70
KS AVG 69
Rank #83 / 224
60.9%
Facility 60.9%
KS AVG 79.5%
Rank #188 / 218
-23%
3.87
Facility 3.87
KS AVG 4.63
Rank #107 / 141
-30%-17%
$14.2k
Facility $14.2k
KS AVG $49.2k
Rank #1 / 144
44
Facility 44
KS AVG 26.9
Rank #119 / 143
8.8
Facility 8.8
KS AVG 6.1
Rank #123 / 143
143-
33
Facility 33
KS AVG 46
Rank #248 / 363
Floyd C Eaton III Trust 2012
$4.6M
Facility $4.6M
KS AVG $7.3M
Rank #92 / 144
$2.3M
Facility $2.3M
KS AVG $3.3M
Rank #109 / 144
51.1%
Facility 51.1%
KS AVG 47.9%
Rank #106 / 144
175165
The Gardens at Aldersgate LLC
NH
HC
MC
PC
RC
Topeka (Downtown)
175
Facility 175
KS AVG 69
Rank #4 / 224
65.1%
Facility 65.1%
KS AVG 79.5%
Rank #171 / 218
-18%
3.72
Facility 3.72
KS AVG 4.63
Rank #122 / 141
+32%-20%
$56.6k
Facility $56.6k
KS AVG $49.2k
Rank #122 / 144
40
Facility 40
KS AVG 26.9
Rank #113 / 143
4.4
Facility 4.4
KS AVG 6.1
Rank #35 / 143
4114B-
78
Facility 78
KS AVG 46
Rank #25 / 363
-
$19.2M
Facility $19.2M
KS AVG $7.3M
Rank #13 / 144
$7.8M
Facility $7.8M
KS AVG $3.3M
Rank #20 / 144
40.5%
Facility 40.5%
KS AVG 47.9%
Rank #121 / 144
175340

Financial Assistance for
Nursing Home in Kansas

Lexington Park Assisted Living is located in Topeka, Kansas.
Here are the financial assistance programs available to residents in Kansas.

Get Financial aid guidance

Frail Elderly Waiver

Kansas Medicaid FE Waiver

Age 65+
General Kansas resident, Medicaid-eligible, nursing home- level care need.
Income Limits (2025) ~$2,829/month 300% FBR, individual
Asset Limits $2,000 (individual), $3,000 (couple).
KS

Requires care level assessment.

Benefits
Personal care (5-7 hours/day) Respite (240 hours/year) Adult day care (~$60/day) Home aides

Senior Care Act

Kansas SCA

Age 60+
General Kansas resident, at risk of nursing home.
Income Limits ~$1,800/month individual, varies
Asset Limits $2,000 individual
KS

Limited funding; waitlists common.

Benefits
In-home care (3-5 hours/week) Respite (up to 10 days/year) Homemaker services

Medicare Savings Program (MSP)

Kansas Medicare Savings Program

Age 65+ or disabled
General Kansas resident, Medicare Part A/B.
Income Limits (2025) ~$2,510/month (QMB), ~$3,380/month (SLMB), ~$3,598/month (QI)—individual.
Asset Limits $9,430 (individual), $14,130 (couple).
KS

Three tiers; no waitlist.

Benefits
Covers Part B premiums ($174.70/month) Deductibles ($240/year) Copays (~20%)

National Family Caregiver Support Program (NFCSP) Respite

Kansas NFCSP Respite Care

Age
General Caregivers of 60+ needing care or 55+ caregivers of others; Kansas resident; functional needs (2+ ADLs).
Income Limits (2025) Prioritizes ~$24,980/year (individual); no strict cap.
Asset Limits Not assessed; need-based.
KS

11 AAAs; prioritizes low-income, rural caregivers.

Benefits
Respite (4-6 hours/week or 5 days/year) Adult day care ($60/day) Caregiver training

VA Aid and Attendance (A&A) and Housebound Benefits

Kansas VA Aid and Attendance/Housebound

Age 65+ or disabled veteran/spouse
General Kansas resident, wartime service, need for ADL help (A&A) or homebound.
Income Limits (2025) Net income < ~$1,984/month (veteran with dependent, A&A); pension offsets income.
Asset Limits ~$155,356 net worth limit
KS

High veteran demand in rural/urban areas.

Benefits
Cash (~$1,433-$2,642/month veteran, ~$951-$1,318 spouse) for care costs (e.g., in-home, assisted living)

Frequently Asked Questions about Lexington Park Assisted Living

What neighborhood is Lexington Park Assisted Living in?

Lexington Park Assisted Living is in the West Southwest 2 neighborhood of Topeka.

Who is the owner of Lexington Park Assisted Living?

The legal owner and operator of Lexington Park Assisted Living is Lexington Park Llc.

Is Lexington Park Assisted Living in a walkable area?

Lexington Park Assisted Living has a walk score of 60. Moderately walkable. Some errands can be accomplished on foot, with a mix of nearby amenities.

What is the license number of Lexington Park Assisted Living?

According to KS state health department records, Lexington Park Assisted Living's license number is N089041.

What is the occupancy rate at Lexington Park Assisted Living?

Lexington Park Assisted Living's occupancy is 84%.

Who is the administrator of Lexington Park Assisted Living?

Ben Rigdon is the administrator of Lexington Park Assisted Living.

How many beds does Lexington Park Assisted Living have?

Lexington Park Assisted Living has 60 beds.

Guides for Better Senior Living

Care Cost Calculator: See Prices in Your Area

Nursing Home Data Explorer

Don’t Wait Too Long: 7 Red Flag Signs Your Parent Needs Assisted Living Now

The True Cost of Assisted Living in 2025 – And How Families Are Paying For It

Understanding Senior Living Costs: Pricing Models, Discounts & Financial Assistance