Explore Open Rooms

1 Contact details
2 What type of senior care service are you looking for?
3 What budget do you have in mind for senior care?
4 How soon do you need to find care?
5 Additional details

Thank you for your interest!

Our team will be in touch shortly to help with next steps.

Nursing Home in Glendale

CMS overall rating Info The Overall CMS Rating combines results from health inspections, staffing levels and quality measures. Health inspections carry the most weight. Staffing and quality scores can increase or decrease the final rating based on performance compared to state and national standards.

Life Care Center of North Glendale

13620 N 55th Ave, Glendale, AZ 85304 View map
Overview of Life Care Center of North Glendale

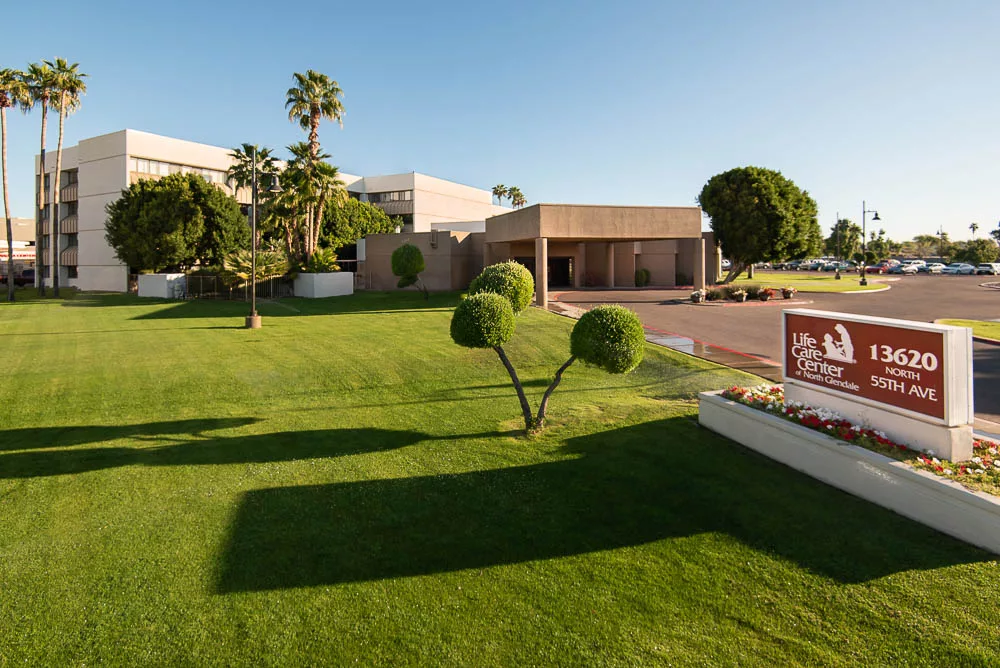
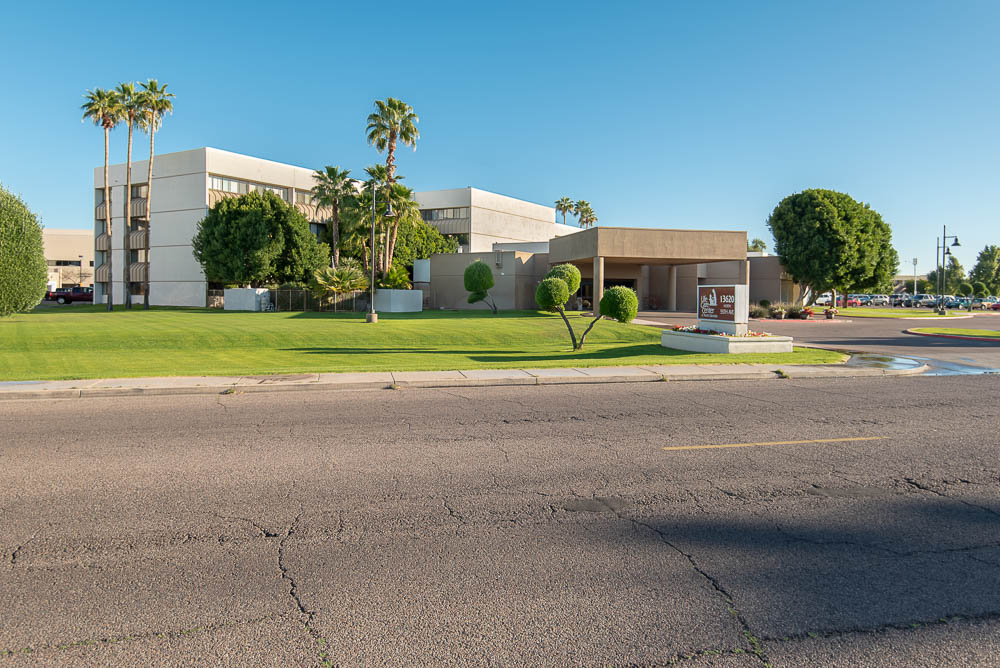
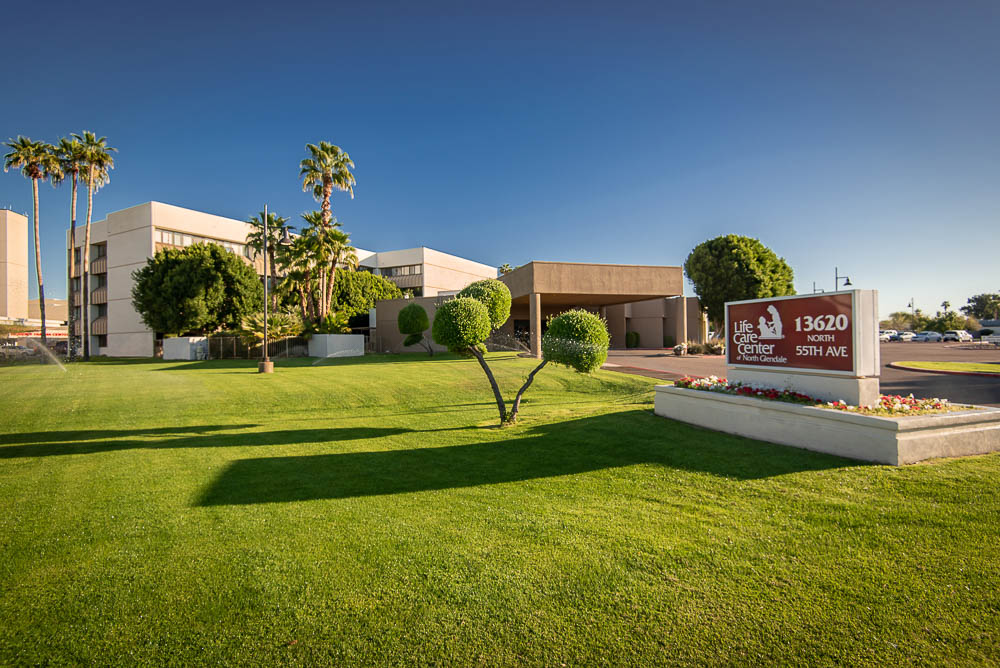
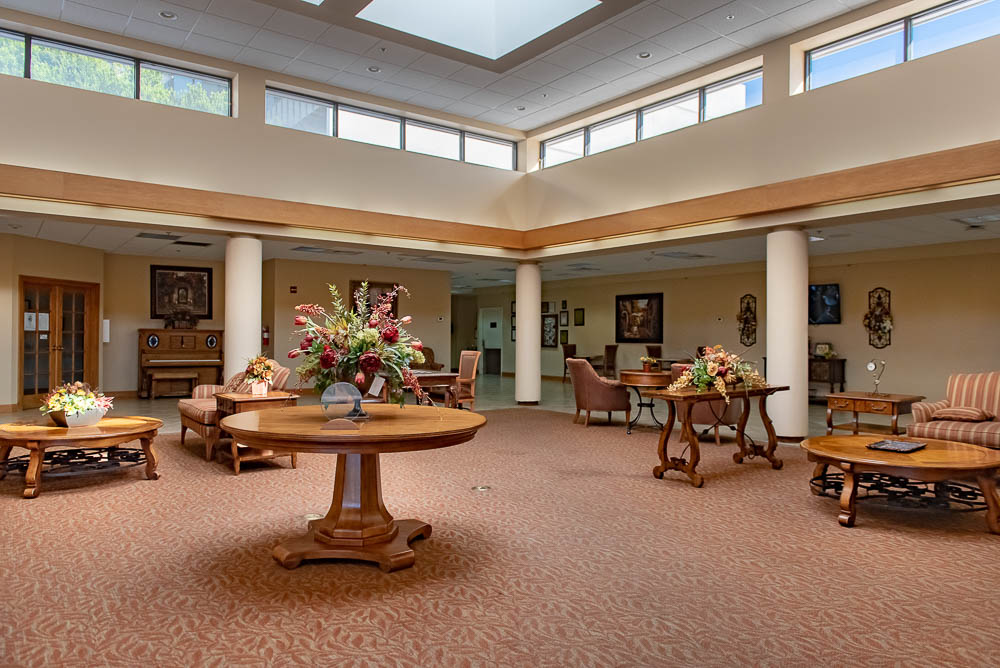
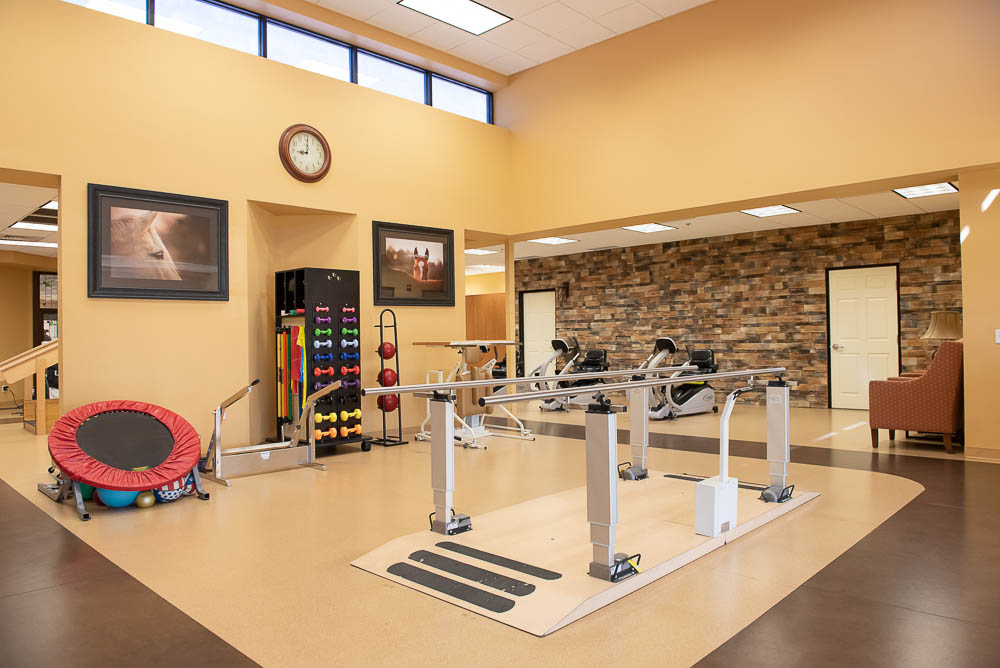
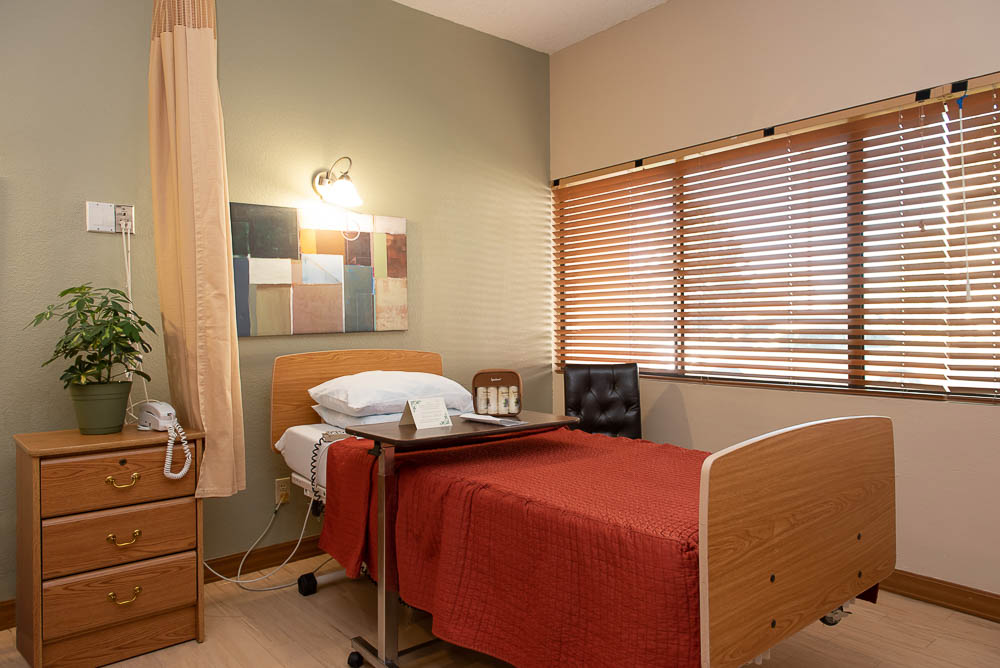
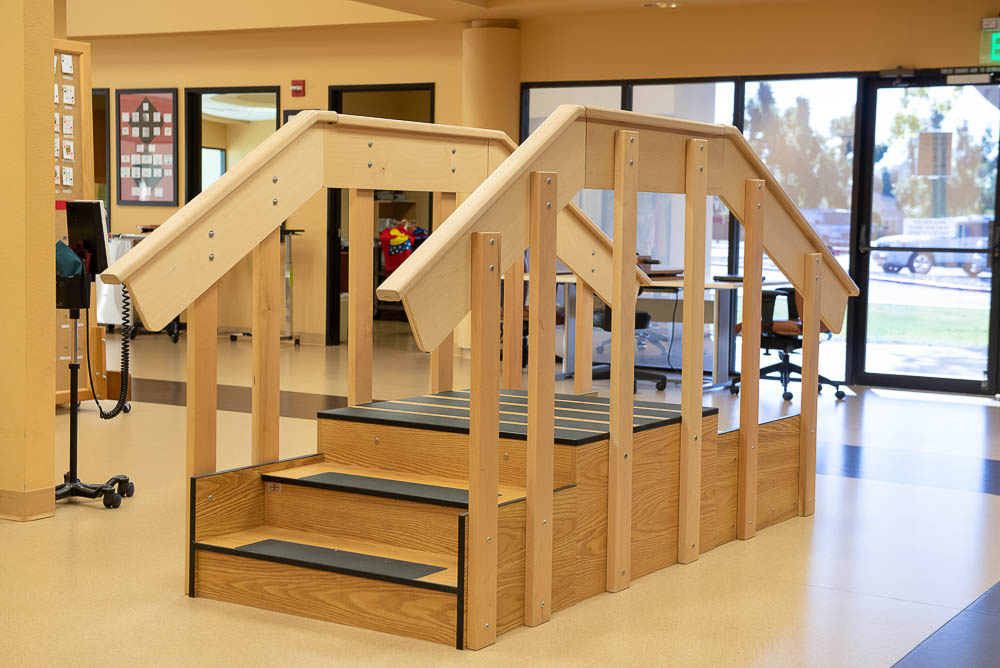
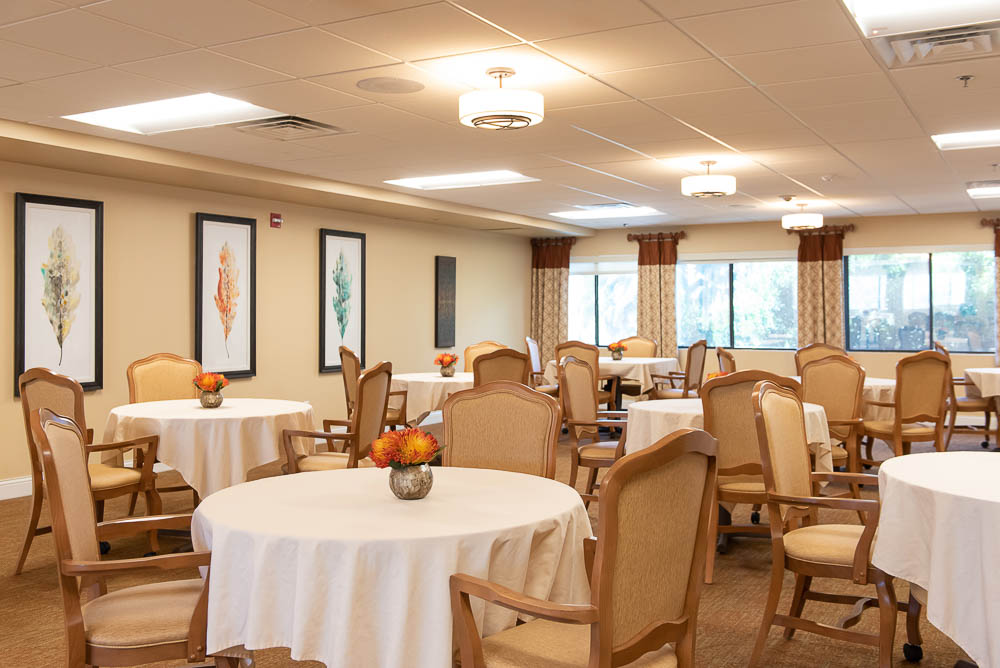
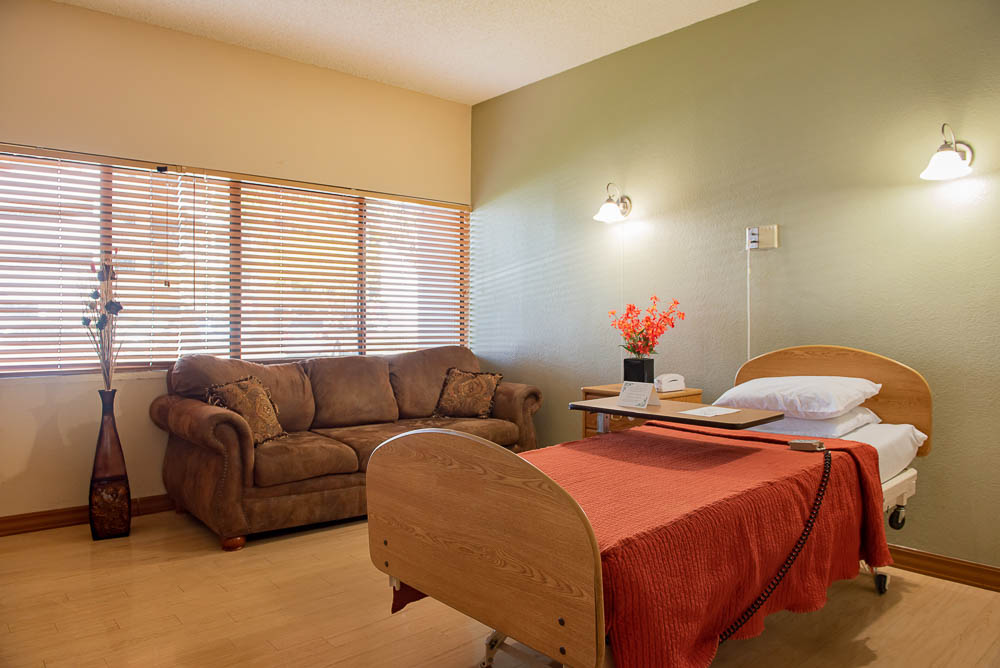
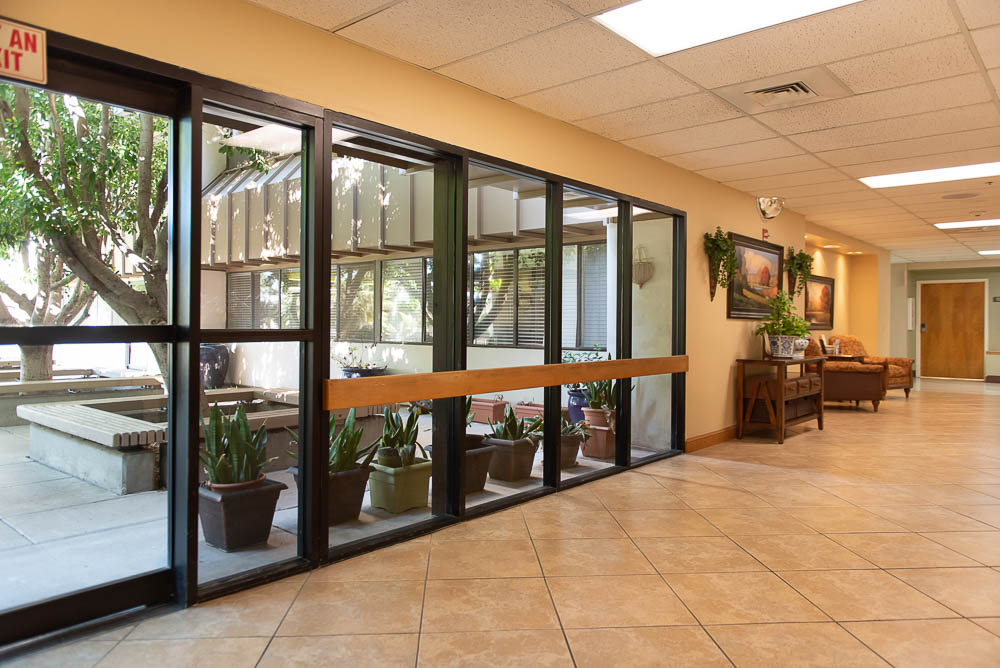
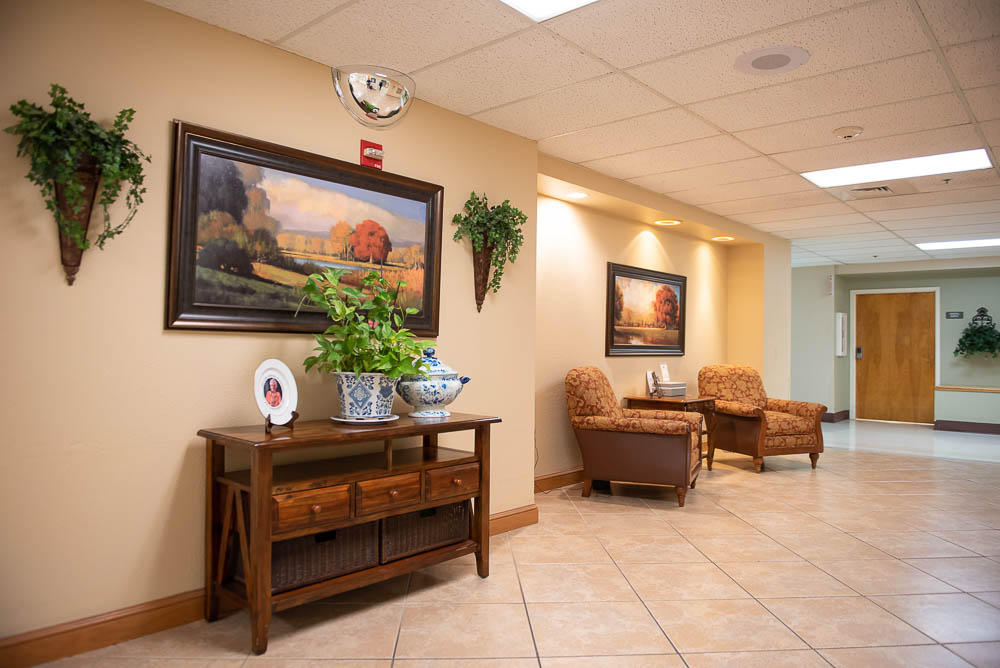
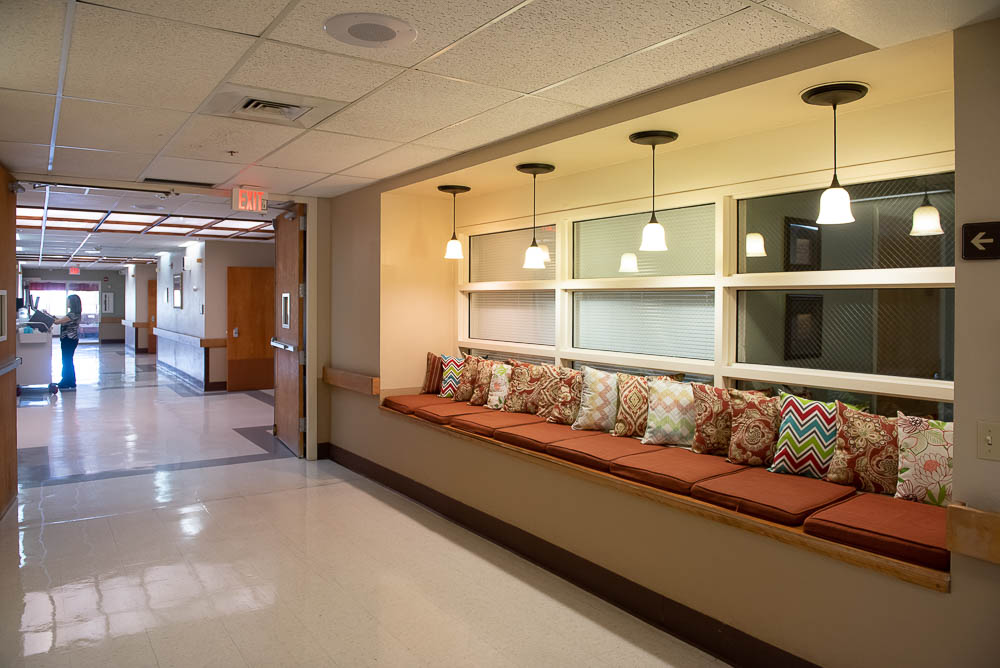
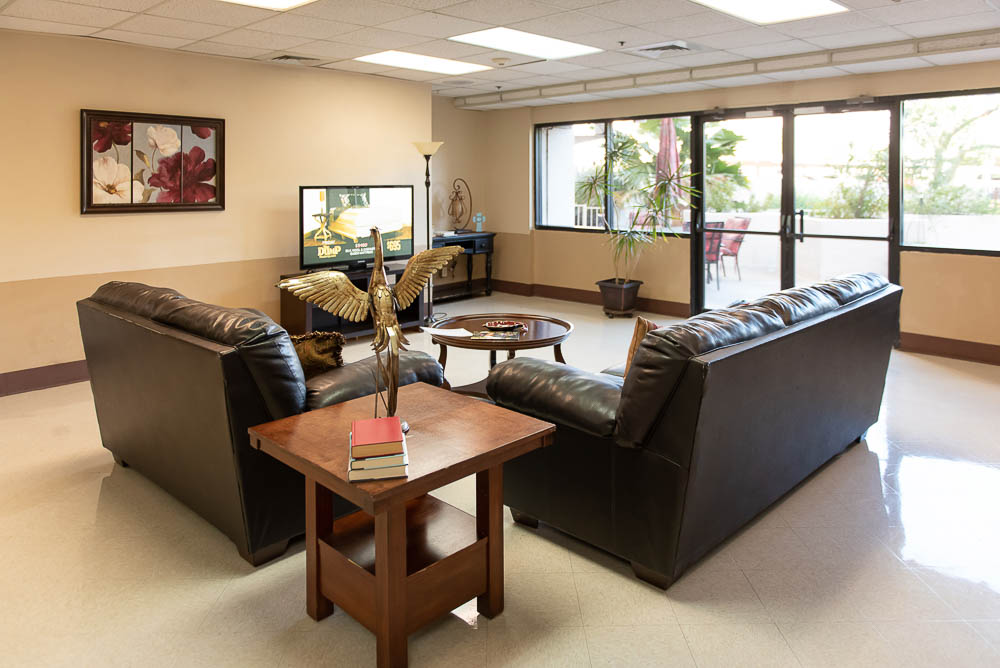
Life Care Center of North Glendale is a skilled nursing and rehabilitation facility. The upscale nursing home aims to change the meaning of skilled nursing and rehabilitation for seniors through the exceptional care delivered by their patient-friendly staff to offer the best care possible for their residents. Life Care Center can be trusted as a safe and secure community that cares for every patient’s needs.
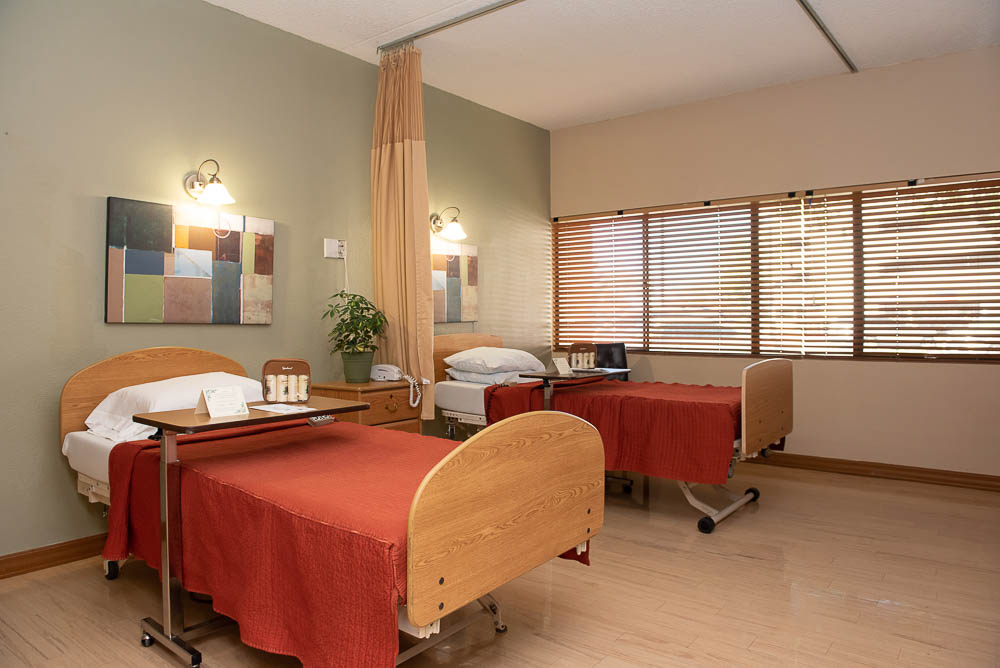
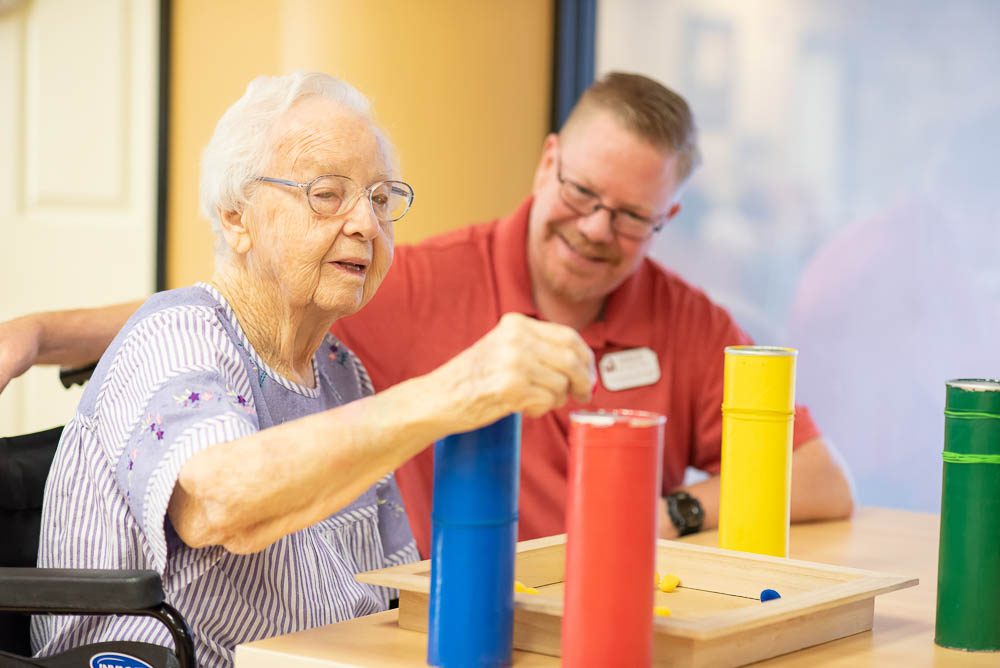
Convenience and hassle-free living is the center of Life Care Center services: medication management, post-surgical care, and wound care; their 24-hour skilled nursing care services provide compassionate care as it is their utmost priority. Other benefits include 24/7 easy admissions, fall prevention, IV therapy, discharge planning, and case management.

(602) 843-8433

Quality ratings

Measured by Centers for Medicare & Medicaid Services (CMS)

Overall rating Info The Overall CMS Rating combines results from health inspections, staffing levels and quality measures. Health inspections carry the most weight. Staffing and quality scores can increase or decrease the final rating based on performance compared to state and national standards.
4/5
Arizona average: 3.5/5
Health Inspection Info Based on the results of the facility's three most recent standard inspections and any complaint investigations. CMS reviews the number, scope, and severity of deficiencies, with more recent findings weighted more heavily.
3/5
Arizona average: 2.8/5
Staffing Info Measures average nursing staff hours per resident per day, including Registered Nurses (RNs) and total nursing staff. Ratings are adjusted based on the level of care residents require and are compared to state and national benchmarks.
3/5
Arizona average: 3.5/5
Quality Measures Info Based on clinical and physical health indicators reported to CMS, such as hospital readmissions, falls, pressure ulcers, and improvements in mobility. These measures reflect how well residents' health needs are being managed.
5/5
Arizona average: 4.6/5

Nursing care per resident

Info This shows how many total hours of nursing staff time are available per resident each day. Higher numbers usually mean more staff support.
3h 28m per day

This home provides 17% less nursing time per resident than the Arizona average.

Arizona average: 4h 11m per day

Staffing hours breakdown

Info Hours of care per resident per day, broken down by staff type. Data from CMS Medicare.
Staff type Facility State avg National avg
Registered Nurse (RN) Info Registered nurse hours per resident per day. 35m per day 43m per day 41m per day
Nurse Aide Info Nurse aide hours per resident per day. 2h 0m per day 2h 22m per day 2h 21m per day
Total Nursing (Weekend) Info Total number of nurse staff hours per resident per day on weekends. 3h 13m per day 3h 38m per day 3h 26m per day
Physical Therapist Info Physical therapist staff hours per resident per day. 4m per day 6m per day 4m per day
RN (Weekend) Info Registered nurse hours per resident per day on weekends. 21m per day 31m per day 29m per day

Capacity and availability

High-capacity home

May provide extensive amenities, services and programs.

Total beds 223

This home usually has availability

Lower occupancy suggests more openings may be available.

Lower demand than the Arizona average
Occupancy rate 52.9%
Residents per day (avg) 120
Occupancy rate
52.9%
Residents per day (avg)
120

Who this home usually serves

TYPE OF STAY

Primarily long-term care, limited rehab

Most residents stay long-term, while a smaller portion are admitted for short-term rehab.

Might be optimal for
Long-term residence Daily assistance Occasional rehab needs

Breakdown by payment type

Medicare

9% of new residents, usually for short-term rehab.

Typical stay 21 days

Private pay

75% of new residents, often for short stays.

Typical stay 16 days

Medicaid

15% of new residents, often for long-term daily care.

Typical stay 5 - 6 months

Finances and operations

Privately-owned community
Operated by a partnership between two or more business owners.
Home revenue
$18.0M
Operating loss
-$834.1K
Privately-owned community Operated by a partnership between two or more business owners.
Home revenue
$17,966,790.00
Operating loss
$-834,089.00
Payroll costs Info The portion of the home's budget spent on staff, including nurses, caregivers, and other employees who support care and operations.
$8.1M
45.2% of revenue
Other operating costs Info All remaining costs needed to run the home, such as food, utilities, building maintenance, supplies and administrative expenses.
$10.7M
Total costs $18.8M
Bed community size
223-bed community
A large-scale community that may provide a wide range of amenities, services, and structured programs.
Walk Score
Walk Score: 52 / 100
Moderately walkable. Some errands can be accomplished on foot, with a mix of nearby amenities.

About this community

License Details

Facility TypeNursing Care Institution
StatusActive
ExpirationApril 30, 2026

Additional Licensing Details

License NumberNCI-381
CMS Certification Number35126
QualificationHealth Care

Ownership & Operating Entity

Life Care Center of North Glendale is legally operated by Life Care Center Of North Glendale, and administrated by Kimberly A Trotta.

Therapy & Rehabilitation

1 service
Rehabilitation Services

Staffing & Medical

2 services
Skilled Nursing
24-Hour Staffing

Additional Services

1 service
Rehabilitation

Amenities & Lifestyle

25 amenities
24-Hour Security And Fire Safety Systems
Beauty Salon And Barber Shop
Bedside And Bathroom Call Lights
Certified Dietitian
Community Re-Entry Program
Complimentary Wireless Internet
Daily Activity Schedule
Family/Resident Councils
Fine Dining Program
Flat-Screen Tvs
Flexible Visiting Hours
Full-Time
Certified Activity Director
Homelike Setting
Housekeeping And Laundry Services
Landscaped Grounds And Courtyards
Library
Non-Smoking Facility
Pet Visitors Allowed
Private And Semiprivate Rooms
Private Bathrooms
Religious Services
Patient/Family Education Program
Telephone And Cable Television Hookups
Transportation Services
Specific ProgramsSkilled Nursing, Rehabilitation, Alzheimer's & Dementia Care, Independent & Assisted Living
Contact Life Care Center of North Glendale

Performance summary

Key indicators of commitment to quality care and safety.

Ratings

Quality Rating
A Highest rating

Based on state quality rating data.

Inspection History

In Arizona, the Department of Health Services, Bureau of Long Term Care Licensing performs regular onsite inspections and investigates complaints for all licensed residential and nursing facilities.

17 visits/inspections

15 complaint inspections

Arizona average: 6 complaint visits

Arizona average: 5 inspections

15 complaints

Formal expressions of dissatisfaction or concern made by residents, or their families regarding various aspects of the care, services, and environment provided.

Arizona average: 6 complaints

Latest inspection

Date July 7, 2025
Complaint
Results No deficiencies

10 deficiencies

Deficiencies indicate regulatory issues. A higher number implies the facility had several areas requiring improvement.

Arizona average: 9 deficiencies

Inspection Report Summary for Life Care Center of North Glendale

The most recent inspection on July 11, 2025, found no deficiencies. Earlier inspections showed a mix of results, with some citations related to nursing personnel sufficiency, abuse prevention, and notification procedures. Prior reports also noted issues with life safety code compliance, including egress doors, cooking facilities, corridor doors, and utilities, as well as policies for health services and preadmission screening. Complaint investigations were mostly unsubstantiated, with no enforcement actions or fines listed in the available reports. The overall trend suggests improvement, as recent inspections have not identified deficiencies after a period of mixed findings.

Health Inspection History

Inspections
Total health inspections 6

Arizona average 6.3


Last Health inspection on Mar 2025

Total health citations 28

Arizona average 23.2

Citations per inspection
4.67

Arizona average 3.82


Health citations are formal notices following inspections when they fail to comply with safety and care standards.

25 of 28 citations resulted from standard inspections; and 3 of 28 resulted from complaint investigations.

Breakdown of citation severity (last 3 years)
Critical Health citations More info 0
100% better than Arizona average

Arizona average: 0.1


Serious Health citations More info 0
100% better than Arizona average

Arizona average: 0.6

0 critical citations More info Arizona average: 0.1

0 serious citations More info Arizona average: 0.6

28 moderate citations More info Arizona average: 22.3

0 minor citations More info Arizona average: 0.2
Citations history (last 3 years)
Nursing Services moderate citation Info Issues related to the availability and quality of nursing staff and the care they provide. Mar 12, 2025
Corrected

Abuse/Neglect moderate citation Info Issues related to protecting resident's from harm, including abuse, neglect, or mistreatment. Aug 28, 2024
Corrected

Resident Rights moderate citation Info Issues related to resident's rights, including dignity, privacy, and the ability to make decisions about their care. Jun 14, 2024
Corrected

Care Planning moderate citation Info Issues related to creating and updating personalized care plans for residents based on their needs and conditions. Jul 03, 2023
Corrected

Compare Nursing Homes around Glendale The information below is reported by the Arizona Department of Health Services, Bureau of Long Term Care Licensing.

4 facilities compared · CMS & AZ Dept. of Health data · Updated Apr 2026

Filter by care type
Advanced Health Care of Glendale
AL

Assisted Living A licensed, long-term care setting for seniors or individuals with disabilities who need help with daily activities — like bathing, dressing, and medication management — but not 24-hour skilled nursing. Offers housing, meals, and around-the-clock support while aiming to maximize resident independence.

NH

Nursing Home Licensed facility providing 24/7 skilled nursing care for residents with complex, ongoing medical needs. Staffed by RNs, LPNs, and CNAs. Inspected and star-rated annually by CMS. Accepts Medicare (short-term rehab) and Medicaid (long-term care).

Glendale (Brandywine Estates)
54
86.3%
+19%
3.85
+16%
-5%
0
11
2.8
0
49
62
Caldwell, Wyatt
$16.0M
$5.2M
32.3%
35275
Life Care Center of North Glendale
AL

Assisted Living A licensed, long-term care setting for seniors or individuals with disabilities who need help with daily activities — like bathing, dressing, and medication management — but not 24-hour skilled nursing. Offers housing, meals, and around-the-clock support while aiming to maximize resident independence.

NH

Nursing Home Licensed facility providing 24/7 skilled nursing care for residents with complex, ongoing medical needs. Staffed by RNs, LPNs, and CNAs. Inspected and star-rated annually by CMS. Accepts Medicare (short-term rehab) and Medicaid (long-term care).

Glendale
223
52.9%
-27%
3.47
-10%
-15%
0
28
4.7
0
120
52
Norhton, Todd
$17.8M
$8.1M
45.5%
35126
Glencroft Center for Modern Aging
-
AL

Assisted Living A licensed, long-term care setting for seniors or individuals with disabilities who need help with daily activities — like bathing, dressing, and medication management — but not 24-hour skilled nursing. Offers housing, meals, and around-the-clock support while aiming to maximize resident independence.

NH

Nursing Home Licensed facility providing 24/7 skilled nursing care for residents with complex, ongoing medical needs. Staffed by RNs, LPNs, and CNAs. Inspected and star-rated annually by CMS. Accepts Medicare (short-term rehab) and Medicaid (long-term care).

Glendale
-
-
-
-
-
-
-
-
-
0
0
0.0
0
-
33
-
-
-
-
-
Golden Age Care Home
-
NH

Nursing Home Licensed facility providing 24/7 skilled nursing care for residents with complex, ongoing medical needs. Staffed by RNs, LPNs, and CNAs. Inspected and star-rated annually by CMS. Accepts Medicare (short-term rehab) and Medicaid (long-term care).

AL

Assisted Living A licensed, long-term care setting for seniors or individuals with disabilities who need help with daily activities — like bathing, dressing, and medication management — but not 24-hour skilled nursing. Offers housing, meals, and around-the-clock support while aiming to maximize resident independence.

Glendale (Brandywine Estates)
5
-
-
-
-
-
-
-
-
0
0
0.0
0
-
54
-
-
-
-
-

Places of interest near Life Care Center of North Glendale

Address 4.8 miles from city center — 0.13 miles to nearest hospital (Banner Thunderbird Medical Center)
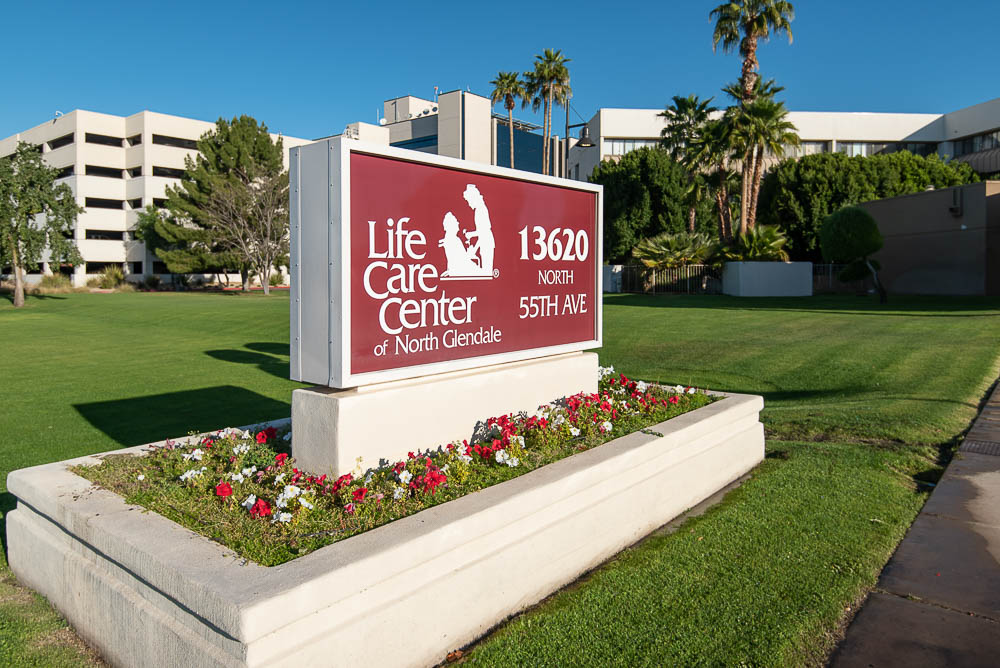
Address 13620 N 55th Ave, Glendale, AZ 85304

Calculate Travel Distance to Life Care Center of North Glendale

Add your location

Address

Staffing Data (Q2 2025)

This data corresponds to Q2 2025 and is based on CMS Payroll-Based Journal.

Total staff 133
Employees 130
Contractors 3
Staff to resident ratio 1.11:1
39% worse than Arizona average

Arizona average ratio: 1.83:1

Avg staff/day 60
Average shift 8.4 hours
0% compared with Arizona average

Arizona average: 8.5 hours

Total staff hours (quarter) 45,974
Nursing staff breakdown
Registered Nurse

Manages medical care and health needs.

Total count 12
Average shift length Info Average shift length. Calculated as total hours divided by days worked and average staff per day. 9.7 hours

No contractors work on this role.

Licensed Practical Nurse

Assists with medical care and medications.

Total count 26
Average shift length Info Average shift length. Calculated as total hours divided by days worked and average staff per day. 9.4 hours

No contractors work on this role.

Certified Nursing Assistant

Helps with daily care and mobility.

Total count 55
Average shift length Info Average shift length. Calculated as total hours divided by days worked and average staff per day. 8.6 hours

No contractors work on this role.

Contractor staffing

Total hours from contractors

0.5%

214 contractor hours this quarter

Occupational Therapy Aide: 1 Occupational Therapy Assistant: 1 Medical Director: 1
Staff by category
Certified Nursing Assistant5505521,88991100%8.6
Licensed Practical Nurse2602610,68291100%9.4
Registered Nurse120124,21391100%9.7
Clinical Nurse Specialist4041,3057684%7.2
Speech Language Pathologist6061,1908593%6.4
Physical Therapy Aide6061,0847987%6.2
Other Dietary Services Staff2026829099%6.6
Physical Therapy Assistant5056766774%7.9
Occupational Therapy Aide1125576268%7.3
Administrator1015206571%8
Respiratory Therapy Technician4045147886%6.3
Nurse Practitioner1015126470%8
Mental Health Service Worker1015046369%8
Dental Services Staff1014675864%8
RN Director of Nursing1014635965%7.8
Dietitian1014145560%7.5
Qualified Social Worker3032133437%6.1
Occupational Therapy Assistant0116867%11.3
Medical Director0112333%7.5
55 Certified Nursing Assistant
% of Days 100%
26 Licensed Practical Nurse
% of Days 100%
12 Registered Nurse
% of Days 100%
4 Clinical Nurse Specialist
% of Days 84%
6 Speech Language Pathologist
% of Days 93%
6 Physical Therapy Aide
% of Days 87%
2 Other Dietary Services Staff
% of Days 99%
5 Physical Therapy Assistant
% of Days 74%
2 Occupational Therapy Aide
% of Days 68%
1 Administrator
% of Days 71%
4 Respiratory Therapy Technician
% of Days 86%
1 Nurse Practitioner
% of Days 70%
1 Mental Health Service Worker
% of Days 69%
1 Dental Services Staff
% of Days 64%
1 RN Director of Nursing
% of Days 65%
1 Dietitian
% of Days 60%
3 Qualified Social Worker
% of Days 37%
1 Occupational Therapy Assistant
% of Days 7%
1 Medical Director
% of Days 3%

Facility Characteristics

Source: CMS Long-Term Care Facility Characteristics (Data as of Jan 2026)

Total census
120 residents
Residents by payment source
Medicare
8 residents (6.7%)
Medicaid
69 residents (57.5%)
Private pay or other
43 residents (35.8%)
Programs & Services
Residents' Group

Residents meet regularly to discuss policies, care quality, and activities

Active Resident Council

Organized group of residents that meets regularly to discuss facility policies, quality of life, and activities.

Quality of care over time

These measures show how residents usually do over time at this home, based on health outcomes and preventive care.

High-risk clinical events score Info A composite score based on pressure ulcers, falls with injury, weight loss, walking ability decline, and activities of daily living decline. 4.2
45% better than Arizona average

Arizona average: 7.6

Functional decline score Info A composite score based on activities of daily living decline, walking ability decline, and incontinence. 9.5
41% better than Arizona average

Arizona average: 16.1

Long-stay resident measures
Significantly above average Arizona avg: 3.7 Info CMS star rating based on long-stay quality measure performance. 5 stars = significantly above average, 1 star = significantly below average.
Need for Help with Daily Activities Increased Info Percent of long-stay residents whose need for help with daily activities has increased 3.3%
71% better than Arizona average

Arizona average: 11.2%

Walking Ability Worsened Info Percent of long-stay residents whose ability to move independently worsened 5.9%
62% better than Arizona average

Arizona average: 15.8%

Low Risk Residents with Bowel/Bladder Incontinence Info Percent of low risk long-stay residents who lose control of their bowels or bladder 19.2%
8% better than Arizona average

Arizona average: 20.8%

Falls with Major Injury Info Percent of long-stay residents experiencing one or more falls with major injury 2.0%
In line with Arizona average

Arizona average: 2.1%

High Risk Residents with Pressure Ulcers Info Percent of long-stay high risk residents with pressure ulcers 5.1%
In line with Arizona average

Arizona average: 5.1%

Urinary Tract Infection Info Percent of long-stay residents with a urinary tract infection 0.3%
75% better than Arizona average

Arizona average: 1.3%

Lost Too Much Weight Info Percent of long-stay residents who lose too much weight 4.5%
17% better than Arizona average

Arizona average: 5.4%

Depressive Symptoms Info Percent of long-stay residents who have depressive symptoms 2.1%
54% better than Arizona average

Arizona average: 4.5%

Antipsychotic Use Info Percent of long-stay residents who received an antipsychotic medication 11.1%
8% worse than Arizona average

Arizona average: 10.3%

Pneumococcal Vaccine Info Percent of long-stay residents assessed and appropriately given the pneumococcal vaccine 100.0%
In line with Arizona average

Arizona average: 97.2%

Influenza Vaccine Info Percent of long-stay residents assessed and appropriately given the seasonal influenza vaccine 98.8%
In line with Arizona average

Arizona average: 94.6%

Short-stay resident measures
Significantly above average Arizona avg: 4.3 Info CMS star rating based on short-stay quality measure performance. 5 stars = much above average, 1 star = much below average.
Pneumococcal Vaccine Info Percent of short-stay residents assessed and appropriately given the pneumococcal vaccine 99.5%
9% better than Arizona average

Arizona average: 91.5%

Antipsychotic medication increase Info Percent of short-stay residents who newly received an antipsychotic medication 1.1%
In line with Arizona average

Arizona average: 1.0%

Influenza Vaccine Info Percent of short-stay residents assessed and appropriately given the seasonal influenza vaccine 98.8%
13% better than Arizona average

Arizona average: 87.3%

Re-hospitalized after SNF stay Info Percentage of short-stay residents who were re-hospitalized after their nursing home admission. 31.2%
27% worse than Arizona average

Arizona average: 24.6%

Emergency department visits Info Percentage of short-stay residents who had an outpatient emergency department visit. 7.1%
34% better than Arizona average

Arizona average: 10.7%

Falls with major injury Info Percentage of SNF residents who experience falls with major injury during their stay. 0.9%
14% worse than Arizona average

Arizona average: 0.8%

Ability to care for self at discharge Info Percentage of residents at or above expected ability to care for themselves at discharge. 73.2%
36% better than Arizona average

Arizona average: 53.7%

Successful return to home or community Info Rate of successful return to home or community from a skilled nursing facility. 52.2%
In line with Arizona average

Arizona average: 50.6%

Guides for Better Senior Living

Care Cost Calculator: See Prices in Your Area

Nursing Home Data Explorer

Don’t Wait Too Long: 7 Red Flag Signs Your Parent Needs Assisted Living Now

The True Cost of Assisted Living in 2025 – And How Families Are Paying For It

Understanding Senior Living Costs: Pricing Models, Discounts & Financial Assistance

Financial Aid for Arizona Seniors

Get financial aid guidance

Arizona Long Term Care System

ALTCS

Age 65+ or disabled, Arizona resident, Medicaid-eligible, nursing home-level care need.

~$2,829/month (300% FBR, individual).

$2,000 (individual), $3,000 (couple).

Covers tribal members; rural outreach.

Non-Medical Home and Community Based Services

AZ DES Non-Medical HCBS

Age 60+, Arizona resident, at risk of institutionalization.

~$2,000/month (individual, varies).

$10,000 (individual).

Limited funding; waitlists common.

Senior Community Service Employment Program (SCSEP)

AZ SCSEP

Age 55+, Arizona resident, unemployed, low-income.

~$1,519/month (125% of poverty level, individual).

Not specified; income-driven.

Wages at highest of federal/state/local minimum ($14.35/hour in 2025).

Weatherization Assistance Program (WAP)

AZ WAP

Age 60+ priority, Arizona resident, own/rent home, low-income.

~$2,510/month (200% of poverty level, individual).

Not applicable; income-focused.

High demand in rural desert areas; limited annual funds.

Section 202 Supportive Housing for the Elderly

AZ Section 202

Age 62+, Arizona resident, very low income, able to live independently with support.

~$1,645/month (50% of area median income, individual, varies by county).

$10,000 (individual, excludes home if owned).

Limited units; high demand in metro areas like Phoenix.

Arizona CARES Program

AZ CARES

Caregivers of Arizona residents 60+ needing help with 3+ daily activities; no caregiver age limit.

No strict limit; cost-sharing above ~$2,500/month threshold.

Not applicable; need-based.

Focus on rural access; complements ALTCS respite.

AZ DES Non-Medical Home and Community Based Services (HCBS)

AZ DES Non-Medical HCBS

Age 60+ or disabled, Arizona resident, need assistance with daily activities, not eligible for Medicaid/ALTCS.

Above Medicaid threshold but low-income (~$1,500-$2,500/month, varies by region).

Not specified; income-driven eligibility.

Targets those ineligible for ALTCS; prioritizes rural and tribal areas.