Life Care Center of Port Townsend
Nursing Home · Port Townsend, WA
CMS overall rating Info The Overall CMS Rating is scored from 1 to 5 stars and combines results from health inspections, staffing levels, and quality measures. Health inspections carry the most weight. Staffing and quality scores can increase or decrease the final rating based on performance compared to state and national standards.

Life Care Center of Port Townsend

Nursing Home · Port Townsend, WA
CMS overall rating Info The Overall CMS Rating is scored from 1 to 5 stars and combines results from health inspections, staffing levels, and quality measures. Health inspections carry the most weight. Staffing and quality scores can increase or decrease the final rating based on performance compared to state and national standards.
Calculator: See prices in your area
Life Care Center of Port Townsend accepts Medicare, Medicaid, and private pay.

Overview of Life Care Center of Port Townsend

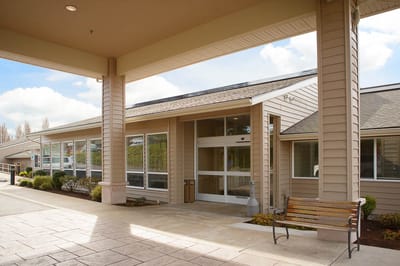
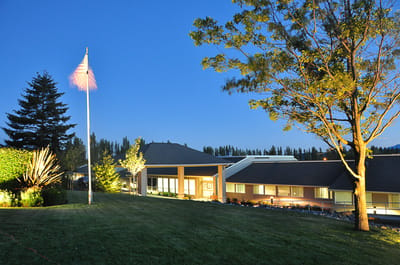
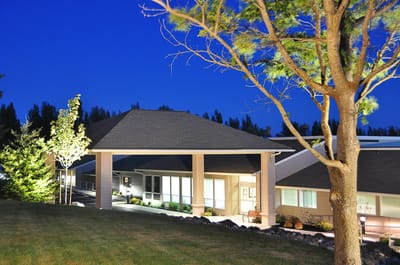
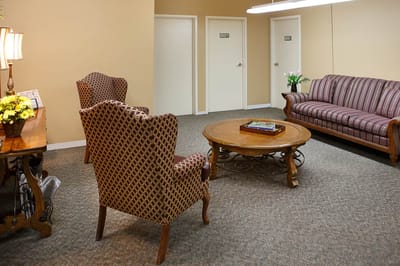
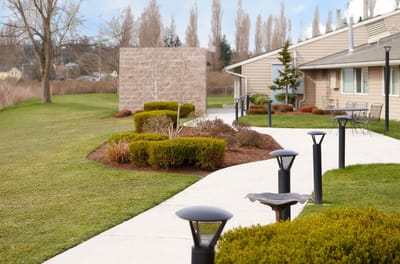
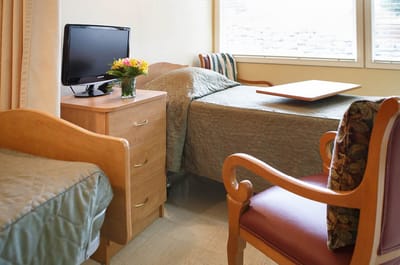
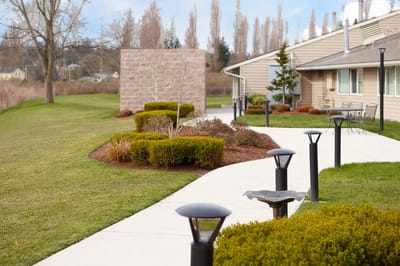
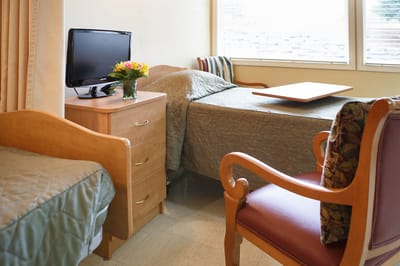
Nestled in the serene beauty of Port Townsend, WA, Life Care Center of Port Townsend overlooks the stunning Kah Tai Lagoon with a backdrop of the Olympic Mountains, offering a peaceful environment for healing and recovery. This welcoming community provides a full range of care services, including skilled nursing, long-term care, and comprehensive inpatient, and outpatient rehabilitation. Here, residents can benefit from private and semi-private accommodations designed for comfort, complemented by individualized treatment plans tailored to support their recovery and independence.

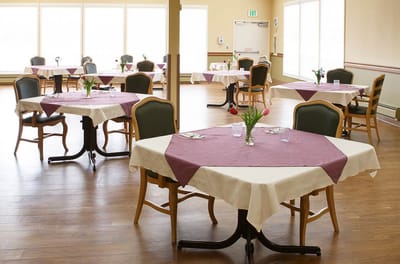
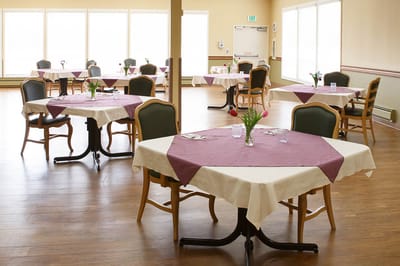
Providing top-of-the-line amenities and services, residents can enjoy delicious and nutritious meals, a library, an onsite beauty salon and barber shop, and beautifully landscaped walking paths. A robust daily activity schedule and wireless internet ensure residents stay connected and engaged. With a compassionate team and a mission to enhance well-being, this community creates an ideal space for healing and growth.

(360) 385-3555

Quality ratings

Measured by Centers for Medicare & Medicaid Services (CMS)

Overall rating Info The Overall CMS Rating combines results from health inspections, staffing levels and quality measures. Health inspections carry the most weight. Staffing and quality scores can increase or decrease the final rating based on performance compared to state and national standards.
▲ 44.5% Above WA avg. ▲ 44.5% Above WA avg.Click the badge to see the full State ranking.Click here to see the full State ranking.
Health Inspection Info Based on the results of the facility's three most recent standard inspections and any complaint investigations. CMS reviews the number, scope, and severity of deficiencies, with more recent findings weighted more heavily.
▲ 38.9% Above WA avg. ▲ 38.9% Above WA avg.Click the badge to see the full State ranking.Click here to see the full State ranking.
Staffing Info Measures average nursing staff hours per resident per day, including Registered Nurses (RNs) and total nursing staff. Ratings are adjusted based on the level of care residents require and are compared to state and national benchmarks.
▼ 22.1% Below WA avg. ▼ 22.1% Below WA avg.Click the badge to see the full State ranking.Click here to see the full State ranking.
Quality Measures Info Based on clinical and physical health indicators reported to CMS, such as hospital readmissions, falls, pressure ulcers, and improvements in mobility. These measures reflect how well residents' health needs are being managed.
▲ 22.5% Above WA avg. ▲ 22.5% Above WA avg.Click the badge to see the full State ranking.Click here to see the full State ranking.

Staffing hours breakdown

Info Daily nursing hours per resident by staff type, reported to CMS. Higher is generally better — compare this facility to state and national averages to see where staffing stands.

Hours per resident per day — compared to Washington state averages

Total nursing care / resident Info This home is ranked 52nd out of 89 homes in Washington. Total adjusted nursing hours per resident per day, combining RN, LPN, and aide time. CMS adjusts this for case-mix so facilities can be fairly compared.
3h 59m per day
Rank #52 / 89Nurse hours — State benchmarkedThis home is ranked 52nd out of 89 homes in Washington. Shows adjusted nurse hours per resident per day benchmarked to the Washington average, with a ranking across 89 Washington SNFs. More hours mean more direct care. The national average is about 3.5 hrs; below 3.0 is a red flag.Click the rank badge to see the full State ranking.Click here to see the full State ranking.
This facility Washington avg (4h 22m per day)
vs Washington avg
-8%

4 of 6 metrics below state avg

Standout metric Physical Therapist is +60% above state avg
Staff typeHours / Day / Residentvs state avg
Registered Nurse (RN) Info RNs hold the highest nursing license and can assess residents, interpret test results, and direct care plans. More RN hours per day often signals stronger clinical oversight and faster response to health changes. 51m per day ▼ 4% State avg: 53m per day · National avg: 41m per day
LPN / LVN Info Licensed Practical Nurses (LPNs) or Licensed Vocational Nurses (LVNs) deliver routine hands-on care — medication administration, wound dressing, and monitoring vital signs. They work under RN supervision and make up a large share of daily bedside care. 32m per day ▼ 35% State avg: 49m per day · National avg: 52m per day
Nurse Aide Info Certified Nurse Aides (CNAs) provide the most direct day-to-day assistance: bathing, dressing, feeding, and mobility. Nurse aide hours are typically the largest staffing category and directly affect residents' quality of life. 2h 22m per day ▼ 12% State avg: 2h 41m per day · National avg: 2h 21m per day
Total Nursing (Weekend) Info Combined nursing hours (RN + LPN + Nurse Aide) per resident per day on weekends. Staffing often drops on weekends — this figure reveals whether the facility maintains adequate coverage outside of weekday hours. 3h 14m per day ▼ 15% State avg: 3h 47m per day · National avg: 3h 26m per day
Physical Therapist Info Hours per resident per day provided by licensed Physical Therapists (PTs) or PT Assistants. PT services help residents recover mobility after injury or illness and are especially important for post-acute (short-stay) rehabilitation. 8m per day ▲ 60% State avg: 5m per day · National avg: 4m per day
RN (Weekend) Info Registered nurse hours specifically on weekends. Facilities sometimes reduce RN presence on Saturdays and Sundays — a low weekend RN figure compared to weekday hours can indicate reduced clinical oversight when most administrative staff are absent. 43m per day ▲ 13% State avg: 38m per day · National avg: 29m per day

Types of Care at Life Care Center of Port Townsend

Nursing Home

Capacity and availability

This home usually has availability

Occupancy lower than 85% suggests more openings may be available.

Lower occupancy than the Washington average: 72.5%
Occupancy rate 41.3% Rank #87 / 94Occupancy rate — State benchmarkedThis home is ranked 87th out of 94 homes in Washington. Shows this facility's occupancy rate versus the Washington average, with its Statewide rank out of 94. Higher occupancy signals strong local demand and financial stability.Click the rank badge to see the full State ranking.Click here to see the full State ranking.
Avg. Length of Stay 58 days
Occupancy rate
41.3% Rank #87 / 94Occupancy rate — State benchmarkedThis home is ranked 87th out of 94 homes in Washington. Shows this facility's occupancy rate versus the Washington average, with its Statewide rank out of 94. Higher occupancy signals strong local demand and financial stability.Click the rank badge to see the full State ranking.Click here to see the full State ranking.
Avg. Length of Stay
58 days
Walk Score
Walk Score: 64 / 100 Rank #31 / 95Walk Score — State benchmarkedThis home is ranked 31st out of 95 homes in Washington. Shows how walkable this facility's neighborhood is compared to the average Walk Score across Washington SNFs. Higher scores benefit residents, families, and staff.Click the rank badge to see the full State ranking.Click here to see the full State ranking.
Moderately walkable. Some errands can be accomplished on foot, with a mix of nearby amenities.

About this community

Awards

AwardsBest Nursing Home - U.S. News & World Report 2026

License Details

CMS Certification Number505306

Safety & Compliance

Emergency Systems24-hour security and fire safety systems.

Staffing

Key information about the people who lead and staff this community.

Leadership

ContactHeather Jeffers, Executive Director

Therapy & Rehabilitation

1 service
Rehabilitation Services

Staffing & Medical

1 service
24-Hour Staffing

Amenities & Lifestyle

24-Hour Skilled Nursing Care
Beauty Salon And Barber Shop
Library
Landscaped Grounds
Walking Paths
Wireless Internet
Fine Dining Program
Daily Activity Schedule
Transportation Services
ActivitiesDaily activity schedule available.
Specific ProgramsAlzheimer's & Dementia Care, Independent & Assisted Living
Religious ServicesYes

Dining & Nutrition

Food DescriptionFine dining program with a variety of meal options.

Contact Life Care Center of Port Townsend

Inspection History

In Washington, the Department of Social and Health Services, Residential Care Services conducts unannounced inspections and issues reports on the quality of care in all licensed settings.

Since 2023 · 3 years of data 31 deficiencies

Inspection Scorecard Info This scorecard compares key inspection, citation, and complaint metrics at this facility against the Washington state average. Metrics rated ≥15% worse than average are highlighted in red; those ≥15% better are highlighted in green.

Since 2023 vs. Washington state average
Overall vs. WA average 0 Worse No metrics in this bucket. 2 At Avg Metrics at Washington average:
• Total deficiencies (at WA avg)
• Deficiencies per year (at WA avg)
0 Better No metrics in this bucket.
Latest Inspection April 11, 2025 Annual Inspection

Deficiencies Info Deficiencies are formal regulatory issues recorded during state inspections.

This FacilityWA Averagevs. WA Avg
Total deficiencies Info Formal regulatory issues recorded by inspectors across all inspection types. 3131 This facility has total deficiencies in line with the Washington average (31 vs. WA avg 31).— At avg
Deficiencies per year Info Average deficiencies per year since 2023. 10.310.3 This facility has deficiencies per year in line with the Washington average (10.3 vs. WA avg 10.3).— At avg

Inspection Reports Summary Info An editor-reviewed summary of the themes and findings across this facility's recent inspection reports.

The most recent inspection on April 11, 2025, identified multiple deficiencies related to care planning, medication management, infection control, and facility operations. Earlier inspections showed a pattern of issues with care planning, PASRR screenings, medication administration, infection prevention, and safety measures, including a substantiated complaint investigation in October 2023 where inadequate care planning and supervision contributed to a resident’s fall causing injury. Inspectors cited recurring problems with incomplete or inaccurate care plans, improper medication storage and monitoring, and lapses in infection control practices. Complaint investigations were mostly unsubstantiated except for the October 2023 case involving resident harm due to insufficient assistance and supervision. The inspection history indicates ongoing challenges with resident care and safety protocols, with no clear improvement trend over time.

Read the full inspection reports for this facility, including detailed findings and corrective actions.

Show Inspection Reports

Health Inspection History

Inspections Since 2023
Total health inspections 5

Washington average 7.8


Last Health inspection on Apr 2025

Total health citations
32 Rank #20 / 91Health citations — State benchmarkedThis home is ranked 20th out of 91 homes in Washington. Shows this facility's total health deficiency citations benchmarked to the Washington State average, with a ranking across all 91 WA SNFs. Lower citation counts earn a better rank.Click the rank badge to see the full State ranking.Click here to see the full State ranking.

Washington average 48.9

Citations per inspection
6.4 Rank #48 / 91Citations per inspection — State benchmarkedThis home is ranked 48th out of 91 homes in Washington. Shows average deficiency citations per CMS inspection for this facility versus the Washington mean across 91 SNFs with citation data. Lower is better.Click the rank badge to see the full State ranking.Click here to see the full State ranking.

Washington average 6.92


Health citations are formal notices following inspections when they fail to comply with safety and care standards.

29 of 32 citations resulted from standard inspections; and 3 of 32 resulted from complaint investigations.

Breakdown of citation severity (last 3 years)
Critical Health citations
1
233% worse than Washington average

Washington average: 0.3


Serious Health citations
2 Rank #27 / 63Serious citations (G–I) — State benchmarkedThis home is ranked 27th out of 63 homes in Washington. Shows G–I scope serious health citations for this facility versus other Washington SNFs. Lower counts rank better.Click the rank badge to see the full State ranking.Click here to see the full State ranking.
18% worse than Washington average

Washington average: 1.7

1 critical citation Washington average: 0.3

2 serious citations Washington average: 1.7

27 moderate citations Washington average: 46.3

2 minor citations Washington average: 0.5
Citations history (last 3 years)
Abuse/Neglect moderate citation Apr 11, 2025
Corrected

Infection Control moderate citation Apr 11, 2025
Corrected

Nutrition moderate citation Apr 11, 2025
Corrected

Pharmacy moderate citation Apr 11, 2025
Corrected

Staffing Data

Reporting period: October 1 – December 31, 2025 (Q4 2025). Source: CMS Payroll-Based Journal report.

Total staff 78
Employees 48
Contractors 30
Staff to resident ratio 2.00:1
8% better than Washington average
Washington average ratio: 1.85:1 Washington average ratio: 1.85:1See full Washington ranking
Avg staff/day 23
Average shift 8.7 hours
7% better than Washington average
Washington average: 8.1 hours Washington average shift: 8.1 hoursSee full Washington ranking
Total staff hours (quarter) 18,417

Nursing staff breakdown

Q4 2025 · Oct 1 – Dec 31 More info This data comes from the CMS Payroll-Based Journal report covering October 1 – December 31, 2025.
Registered Nurse

Manages medical care and health needs.

Total count 13
Average shift length Info Average shift length. Calculated as total hours divided by days worked and average staff per day. 10.4 hours

This role is partially covered by contractors.

Licensed Practical Nurse

Assists with medical care and medications.

Total count 5
Average shift length Info Average shift length. Calculated as total hours divided by days worked and average staff per day. 8.4 hours

This role is partially covered by contractors.

Certified Nursing Assistant

Helps with daily care and mobility.

Total count 38
Average shift length Info Average shift length. Calculated as total hours divided by days worked and average staff per day. 9.6 hours

This role is partially covered by contractors.

Contractor staffing

Q4 2025 · Oct 1 – Dec 31 More info This data comes from the CMS Payroll-Based Journal report covering October 1 – December 31, 2025.

Total hours from contractors

25.6%

4,716 contractor hours this quarter

Certified Nursing Assistant: 17 Registered Nurse: 7 Licensed Practical Nurse: 2 Occupational Therapy Assistant: 2 Occupational Therapy Aide: 1 Other Physician: 1

Staff by category

Q4 2025 · Oct 1 – Dec 31 More info This data comes from the CMS Payroll-Based Journal report covering October 1 – December 31, 2025.
Certified Nursing Assistant2117389,13992100%9.6
Registered Nurse67133,19192100%10.4
Licensed Practical Nurse3251,2279098%8.4
Administrator1015286672%8
RN Director of Nursing1014716166%7.7
Clinical Nurse Specialist1014695964%8
Dietitian1014656065%7.8
Respiratory Therapy Technician1014526166%7.4
Speech Language Pathologist1014415661%7.9
Nurse Practitioner1014215358%7.9
Qualified Social Worker2023666267%5.9
Mental Health Service Worker1013534448%8
Physical Therapy Aide1013315863%5.7
Other Dietary Services Staff2022383134%7.7
Physical Therapy Assistant2021423437%4.1
Occupational Therapy Aide011741921%3.9
Dental Services Staff202461516%2
Other Physician0112933%9.5
Occupational Therapy Assistant0222367%3.8
Nurse Aide in Training1011311%12.6
38 Certified Nursing Assistant
% of Days 100%
13 Registered Nurse
% of Days 100%
5 Licensed Practical Nurse
% of Days 98%
1 Administrator
% of Days 72%
1 RN Director of Nursing
% of Days 66%
1 Clinical Nurse Specialist
% of Days 64%
1 Dietitian
% of Days 65%
1 Respiratory Therapy Technician
% of Days 66%
1 Speech Language Pathologist
% of Days 61%
1 Nurse Practitioner
% of Days 58%
2 Qualified Social Worker
% of Days 67%
1 Mental Health Service Worker
% of Days 48%
1 Physical Therapy Aide
% of Days 63%
2 Other Dietary Services Staff
% of Days 34%
2 Physical Therapy Assistant
% of Days 37%
1 Occupational Therapy Aide
% of Days 21%
2 Dental Services Staff
% of Days 16%
1 Other Physician
% of Days 3%
2 Occupational Therapy Assistant
% of Days 7%
1 Nurse Aide in Training
% of Days 1%

Penalties and fines

Includes penalties issued in 2023

Federal penalties imposed by CMS for regulatory violations, including civil money penalties (fines) and denials of payment for new Medicare/Medicaid admissions.

Source: CMS Penalties Database (Data as of Jan 2026)

Total fines amount $67K Rank #57 / 91Federal fines — State benchmarkedThis home is ranked 57th out of 91 homes in Washington. Shows this facility's cumulative CMS federal fine dollars versus the Washington average among facilities with fines, and where it ranks among 91 skilled nursing facilities in the pool. Lower total dollars mean a better rank.Click the rank badge to see the full State ranking.Click here to see the full State ranking.
18% lower than Washington average

Washington average: $82K

Number of fines 2
8% more fines than Washington average

Washington average: 1.8

Payment Denials Info Serious action where Medicare and/or Medicaid temporarily stops payments for new residents until issues are fixed. 0
100% fewer payment denials than Washington average

Washington average: 0.3

Fines amount comparison
This facility $67K
Washington average $82K
Penalty History

Penalties are imposed by CMS for violations of federal nursing home regulations.

1 penalty in the past 3 years

Oct 4, 2023 · $35K

Civil Money Penalty Info Fines imposed for noncompliance, which can be assessed per day or per instance of violation. Oct 4, 2023
$35K

Last updated: Jan 2026

Quality of care over time

These measures show how residents usually do over time at this home, based on health outcomes and preventive care.

High-risk clinical events score Info A composite score based on pressure ulcers, falls with injury, weight loss, walking ability decline, and activities of daily living decline. 8.4
17% better than Washington average

Washington average: 10.0

Functional decline score Info A composite score based on activities of daily living decline, walking ability decline, and incontinence. 20.4
In line with Washington average

Washington average: 20.9

Long-stay resident measures
Significantly above average Washington avg: 3.6 Info CMS star rating based on long-stay quality measure performance. 5 stars = significantly above average, 1 star = significantly below average.
Need for Help with Daily Activities Increased Info Percent of long-stay residents whose need for help with daily activities has increased 11.3%
31% better than Washington average

Washington average: 16.4%

Walking Ability Worsened Info Percent of long-stay residents whose ability to move independently worsened 19.2%
12% better than Washington average

Washington average: 21.8%

Low Risk Residents with Bowel/Bladder Incontinence Info Percent of low risk long-stay residents who lose control of their bowels or bladder 30.7%
26% worse than Washington average

Washington average: 24.3%

Falls with Major Injury Info Percent of long-stay residents experiencing one or more falls with major injury 3.7%
40% worse than Washington average

Washington average: 2.6%

High Risk Residents with Pressure Ulcers Info Percent of long-stay high risk residents with pressure ulcers 3.0%
40% better than Washington average

Washington average: 4.9%

Urinary Tract Infection Info Percent of long-stay residents with a urinary tract infection 0.0%
100% better than Washington average

Washington average: 1.7%

Lost Too Much Weight Info Percent of long-stay residents who lose too much weight 4.8%
18% better than Washington average

Washington average: 5.8%

Depressive Symptoms Info Percent of long-stay residents who have depressive symptoms 7.5%
54% better than Washington average

Washington average: 16.2%

Antipsychotic Use Info Percent of long-stay residents who received an antipsychotic medication 15.0%
In line with Washington average

Washington average: 14.5%

Pneumococcal Vaccine Info Percent of long-stay residents assessed and appropriately given the pneumococcal vaccine 97.8%
In line with Washington average

Washington average: 96.2%

Influenza Vaccine Info Percent of long-stay residents assessed and appropriately given the seasonal influenza vaccine 100.0%
7% better than Washington average

Washington average: 93.8%

Hospitalizations per 1,000 days Info Number of hospitalizations per 1,000 long-stay resident days. 0.89
36% better than Washington average

Washington average: 1.38

ED visits per 1,000 days Info Number of outpatient emergency department visits per 1,000 long-stay resident days. 2.70
79% worse than Washington average

Washington average: 1.51

Short-stay resident measures
Significantly above average Washington avg: 3.6 Info CMS star rating based on short-stay quality measure performance. 5 stars = much above average, 1 star = much below average.
Pneumococcal Vaccine Info Percent of short-stay residents assessed and appropriately given the pneumococcal vaccine 88.6%
In line with Washington average

Washington average: 88.1%

Antipsychotic medication increase Info Percent of short-stay residents who newly received an antipsychotic medication 2.2%
53% worse than Washington average

Washington average: 1.4%

Influenza Vaccine Info Percent of short-stay residents assessed and appropriately given the seasonal influenza vaccine 63.6%
22% worse than Washington average

Washington average: 82.0%

Re-hospitalized after SNF stay Info Percentage of short-stay residents who were re-hospitalized after their nursing home admission. 12.2%
39% better than Washington average

Washington average: 19.9%

Emergency department visits Info Percentage of short-stay residents who had an outpatient emergency department visit. 19.3%
46% worse than Washington average

Washington average: 13.2%

Falls with major injury Info Percentage of SNF residents who experience falls with major injury during their stay. 0.0%
100% better than Washington average

Washington average: 0.8%

Ability to care for self at discharge Info Percentage of residents at or above expected ability to care for themselves at discharge. 58.3%
9% better than Washington average

Washington average: 53.7%

Successful return to home or community Info Rate of successful return to home or community from a skilled nursing facility. 60.2%
19% better than Washington average

Washington average: 50.6%

Breakdown by payment type

Medicare

62% of new residents, usually for short-term rehab.

Typical stay 20 days

Private pay

25% of new residents, often for short stays.

Typical stay 2 months

Medicaid

13% of new residents, often for long-term daily care.

Typical stay 8 - 9 months

Facility Characteristics

Source: CMS Long-Term Care Facility Characteristics (Data as of Jan 2026)

Total residents 39
Medicare
8
20.5% of residents
Medicaid
22
56.4% of residents
Private pay or other
9
23.1% of residents
Programs & Services
Residents Group

Residents meet regularly to discuss policies, care quality, and activities

Active Resident Council

Organized group of residents that meets regularly to discuss facility policies, quality of life, and activities.

Finances and operations

Privately-owned community
Operated by a partnership between two or more business owners.
Home revenue
$7.5M
Operating loss
-$396.3K
Privately-owned community Operated by a partnership between two or more business owners.
Home revenue
$7.5M Rank #82 / 93Revenue — State benchmarkedThis home is ranked 82nd out of 93 homes in Washington. Shows this facility's annual revenue compared to the Washington SNF average. Higher revenue generally means more resources for staffing and capital — read alongside Payroll %.Click the rank badge to see the full State ranking.Click here to see the full State ranking.
Operating loss
-$396.3K
Payroll costs Info The portion of the home's budget spent on staff, including nurses, caregivers, and other employees who support care and operations. Rank #76 / 93Payroll — State benchmarkedThis home is ranked 76th out of 93 homes in Washington. Shows total annual staff payroll benchmarked to the Washington average. Higher payroll investment relative to peers often signals better staffing and less reliance on cheaper contract labor.Click the rank badge to see the full State ranking.Click here to see the full State ranking.
$4.2M
56.5% of revenue Rank #24 / 93Payroll % — State benchmarkedThis home is ranked 24th out of 93 homes in Washington. Shows payroll as a percentage of revenue versus the Washington average. Well-run Washington SNFs typically land around 53–61% — the top third Statewide. Below 25% may signal understaffing or heavy agency use — read with Staffing ratings.Click the rank badge to see the full State ranking.Click here to see the full State ranking.
Other operating costs Info All remaining costs needed to run the home, such as food, utilities, building maintenance, supplies and administrative expenses.
$3.6M
Total costs $7.9M

What does this home offer?

Total residents icon

Total Residents: 94 Residents

Housing options icon

Housing Options: Private / Semi-Private Rooms

Building type icon
Building type icon

Building Type: Single-story

Who this home usually serves

TYPE OF STAY

Mostly short-term rehab stays

Most residents typically stay for a few weeks or months before returning home or moving on.

Places of interest near Life Care Center of Port Townsend

Address 0.8 miles from city center Info Estimated distance in miles from Port Townsend's city center to Life Care Center of Port Townsend's address, calculated via Google Maps.

Calculate Travel Distance to Life Care Center of Port Townsend

Add your location

Address

Financial Assistance for
Nursing Home in Washington

Life Care Center of Port Townsend is located in Port Townsend, Washington.
Here are the financial assistance programs available to residents in Washington.

Get Financial aid guidance

Community Options Program Entry System (COPES)

WA Medicaid COPES

Age 65+ or disabled
General Washington resident, Medicaid-eligible, nursing home-level care need.
Income Limits (2025) ~$2,829/month 300% FBR, individual
Asset Limits $2,000 (individual), $3,000 (couple).
WA

High demand in urban areas (e.g., Seattle).

Benefits
Personal care (5-7 hours/day) Respite (240 hours/year) Adult day care ($70/day) Home modifications ($1,500 avg.)

Washington Family Caregiver Support Program

WA NFCSP

Age Caregiver of someone 60+ (or with dementia)
General Washington resident.
Income Limits No strict limit; prioritizes low-income.
Asset Limits Not applicable.
WA

High urban demand; rural outreach.

Benefits
In-home respite (4-6 hours/day) Adult day care (~$70/day) Short-term facility care (up to 5 days)

Community First Choice (CFC)

Washington Community First Choice

Age 65+ (or disabled 18+)
General WA resident, Medicaid-eligible, need help with 2+ ADLs/IADLs.
Income Limits (2025) ~$2,829/month; QIT optional.
Asset Limits $2,000 (individual), $3,000 (couple).
WA

Broader than COPES; serves ~20,000; self-directed option.

Benefits
Personal care (4-6 hours/day) Respite (~240 hours/year) Assistive devices Training Transportation

Older Americans Act (OAA) Services

Washington OAA Services

Age 60+
General WA resident; no income/asset limits.
Income Limits (2025) None; donations encouraged.
Asset Limits Not assessed.
WA

13 AAAs; includes Meals on Wheels; rural focus.

Benefits
Meals (~$5-$7/meal) Transportation Homemaker services (~4 hours/week) Respite (~5 days/year) Legal aid

Medicare Savings Program (MSP)

Washington Medicare Savings Program

Age 65+ or disabled
General WA resident, Medicare Part A/B.
Income Limits (2025) ~$2,510/month (QMB), ~$3,380/month (SLMB), ~$3,598/month (QI)—individual.
Asset Limits $9,430 (individual), $14,130 (couple).
WA

Includes Extra Help for Part D; no waitlist.

Benefits
Covers Part B premiums ($174.70/month) Deductibles ($240/year) Copays (~20%)

VA Aid and Attendance (A&A) and Housebound Benefits

Washington VA Aid and Attendance/Housebound

Age 65+ or disabled veteran/spouse
General WA resident, wartime service, ADL help (A&A) or homebound.
Income Limits (2025) Net income < ~$1,984/month (veteran with dependent, A&A); pension offsets income.
Asset Limits ~$155,356 net worth
WA

High veteran use; supports rural/urban needs.

Benefits
Cash (~$1,433-$2,642/month veteran, ~$951-$1,318 spouse) for care costs

Senior Citizens Property Tax Exemption

Washington Senior Property Tax Exemption

Age 61+ or disabled retiree
General WA resident, homeowner, income-based.
Income Limits (2025) ~$45,000-$70,000/year varies by county, e.g., King: $70,000
Asset Limits Not assessed; home value cap varies ~$250,000-$400,000
WA

Saves ~$500-$1,500/year; offered statewide.

Benefits
Tax exemption (~$500-$1,500/year depending on county)

Senior Farmers’ Market Nutrition Program (SFMNP)

Washington SFMNP

Age 60+
General WA resident, low-income.
Income Limits (2025) ~$2,322/month 185% FPL
Asset Limits Not assessed.
WA

Vouchers (~$80/season); serves ~20,000 via AAAs.

Benefits
Vouchers (~$80/season) for produce at farmers’ markets

Frequently Asked Questions about Life Care Center of Port Townsend

What neighborhood is Life Care Center of Port Townsend in?

Life Care Center of Port Townsend is in the Kearney Street neighborhood of Port Townsend.

Is Life Care Center of Port Townsend in a walkable area?

Life Care Center of Port Townsend has a walk score of 64. Moderately walkable. Some errands can be accomplished on foot, with a mix of nearby amenities.

What is the occupancy rate at Life Care Center of Port Townsend?

Life Care Center of Port Townsend's occupancy is 41.3%.

Are there photos of Life Care Center of Port Townsend?

Yes — there are 16 photos of Life Care Center of Port Townsend in the photo gallery on this page.

What is the address of Life Care Center of Port Townsend?

Life Care Center of Port Townsend is located at 751 Kearney St, Port Townsend, WA 98368, United States.

What is the phone number of Life Care Center of Port Townsend?

(360) 385-3555 will put you in contact with the team at Life Care Center of Port Townsend.

Is Life Care Center of Port Townsend Medicare or Medicaid certified?

Yes — Life Care Center of Port Townsend is a CMS-certified provider of Medicare and Medicaid.

Guides for Better Senior Living

Care Cost Calculator: See Prices in Your Area

Nursing Home Data Explorer

Don’t Wait Too Long: 7 Red Flag Signs Your Parent Needs Assisted Living Now

The True Cost of Assisted Living in 2025 – And How Families Are Paying For It

Understanding Senior Living Costs: Pricing Models, Discounts & Financial Assistance

Explore Open Rooms
1 Contact details
2 What type of senior care service are you looking for?
3 What budget do you have in mind for senior care?
4 How soon do you need to find care?
5 Additional details

Thank you for your interest!

Our team will be in touch shortly to help with next steps.